


Silver stock market trends are shifting, and the opportunities are real. At Natural Resource Stocks, we’re tracking both the quick wins for active traders and the solid long-term plays for investors building wealth.
This guide breaks down what’s moving silver prices right now, shows you the technical signals that matter, and reveals why silver belongs in your portfolio for the years ahead.
Current Silver Market Dynamics
Silver’s Price Action and What It Reveals
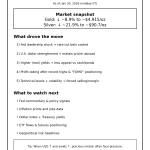
Silver traded near $106/oz on January 30, 2026, after hitting an all-time high of $121.64 earlier in the month. The volatility has been extreme-silver swung $16 intraday at its peak, a move that signals mania-like conditions rather than orderly price discovery. What matters most is that the underlying fundamentals have not reversed. Mine supply growth remains constrained due to lower ore grades and reduced capital expenditure, while industrial demand from solar panels, electronics, electric vehicles, and power infrastructure continues to tighten the physical market. This mismatch between tight physical supply and speculative futures trading shapes prices right now.
Physical Tightness Versus Paper Speculation
The divergence between paper prices and physical availability signals that this move has real legs. Deliverable inventories remain tight, and fabricators stockpile metal despite price swings, meaning end-users believe higher prices reflect genuine scarcity. Premiums across major regions stay firm even as futures prices whipsaw, which tells you industrial buyers are not backing away. This is not speculation-this is real demand from companies that need silver to manufacture products.
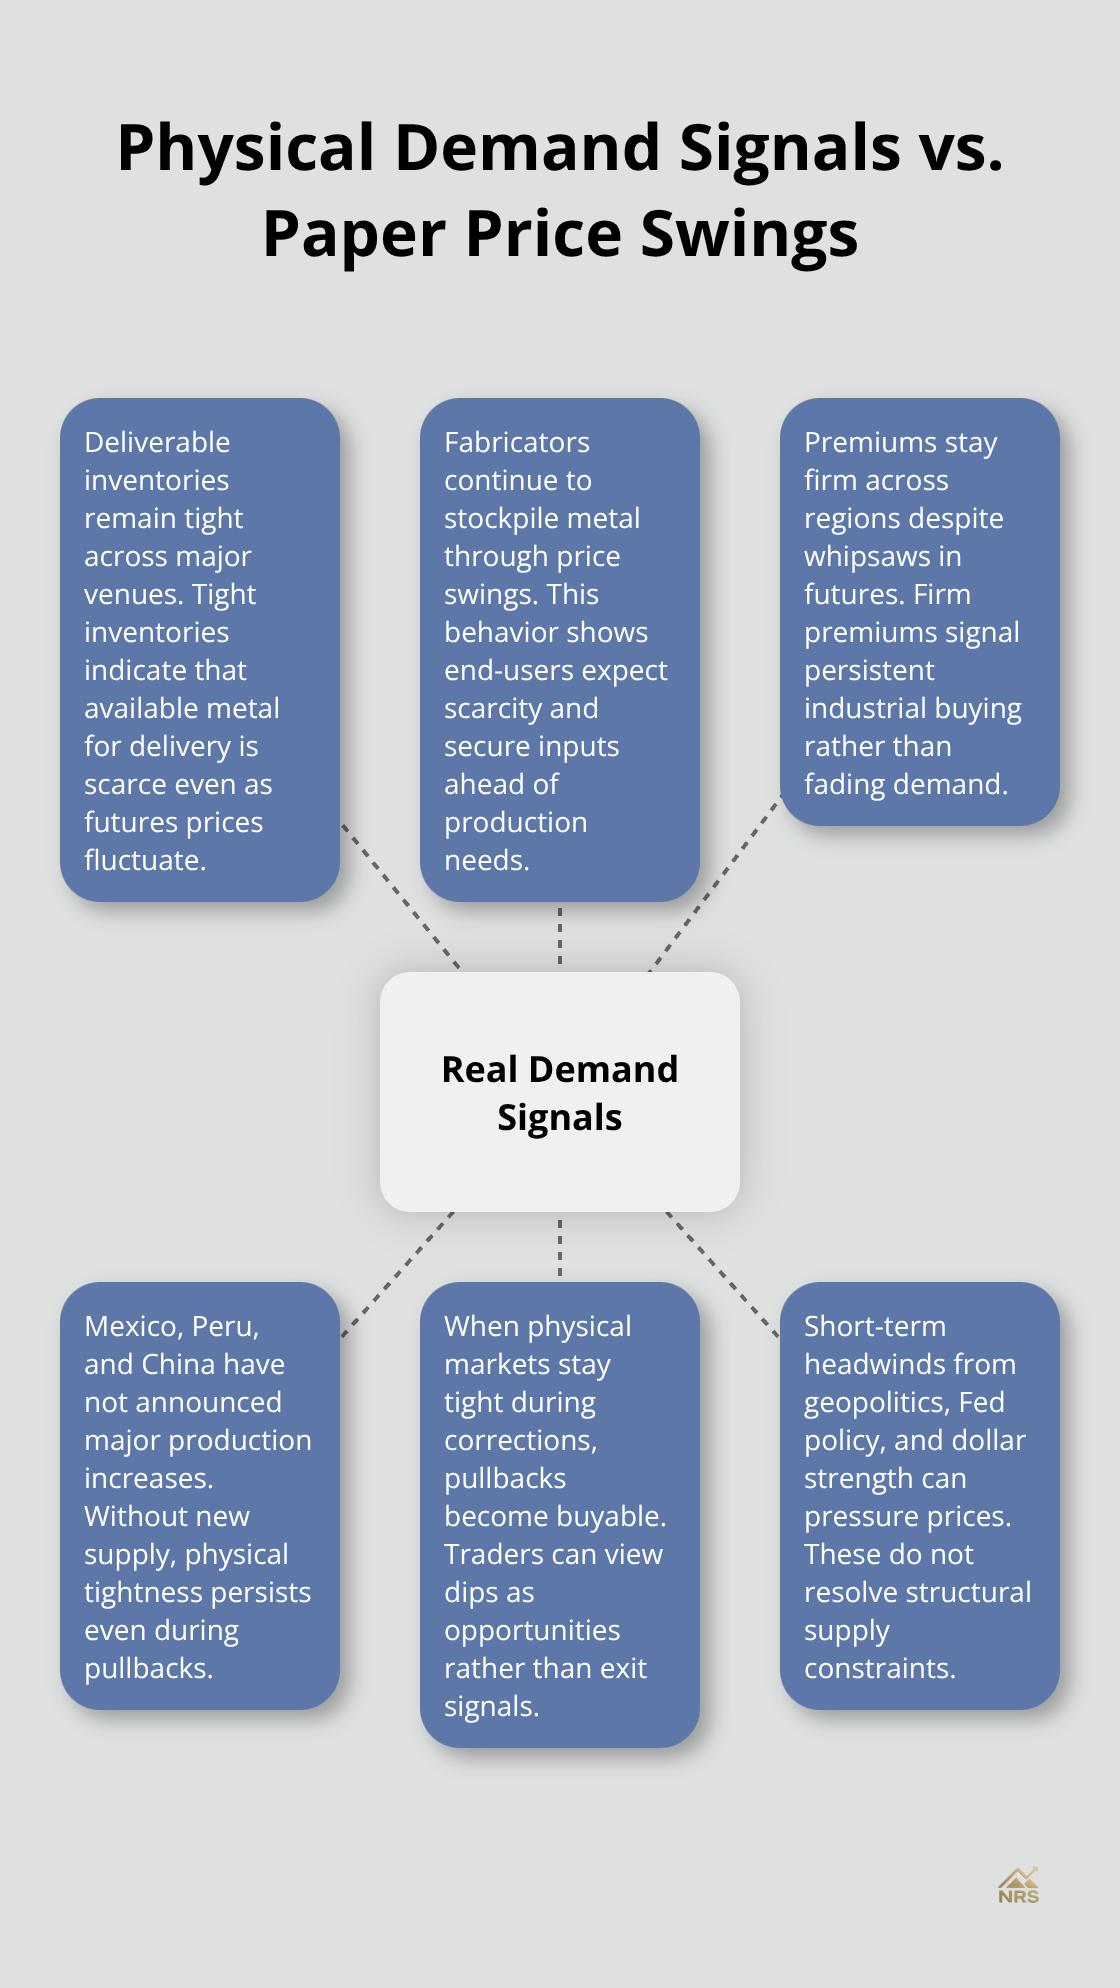
Mexico, Peru, and China supply most of the world’s primary silver, and none of these regions have announced major production increases that would ease supply pressure. When physical markets remain tight while prices correct, pullbacks become buying opportunities rather than warnings to exit. Geopolitical tensions, including Iran-related risks and EU policy shifts, have reinforced safe-haven demand alongside industrial fundamentals. The Federal Reserve’s unchanged rates and dollar strength in late January created short-term selling pressure, but these factors do not address the structural supply constraints and rising industrial demand for physical metal.
Support Levels and Risk Management for Traders
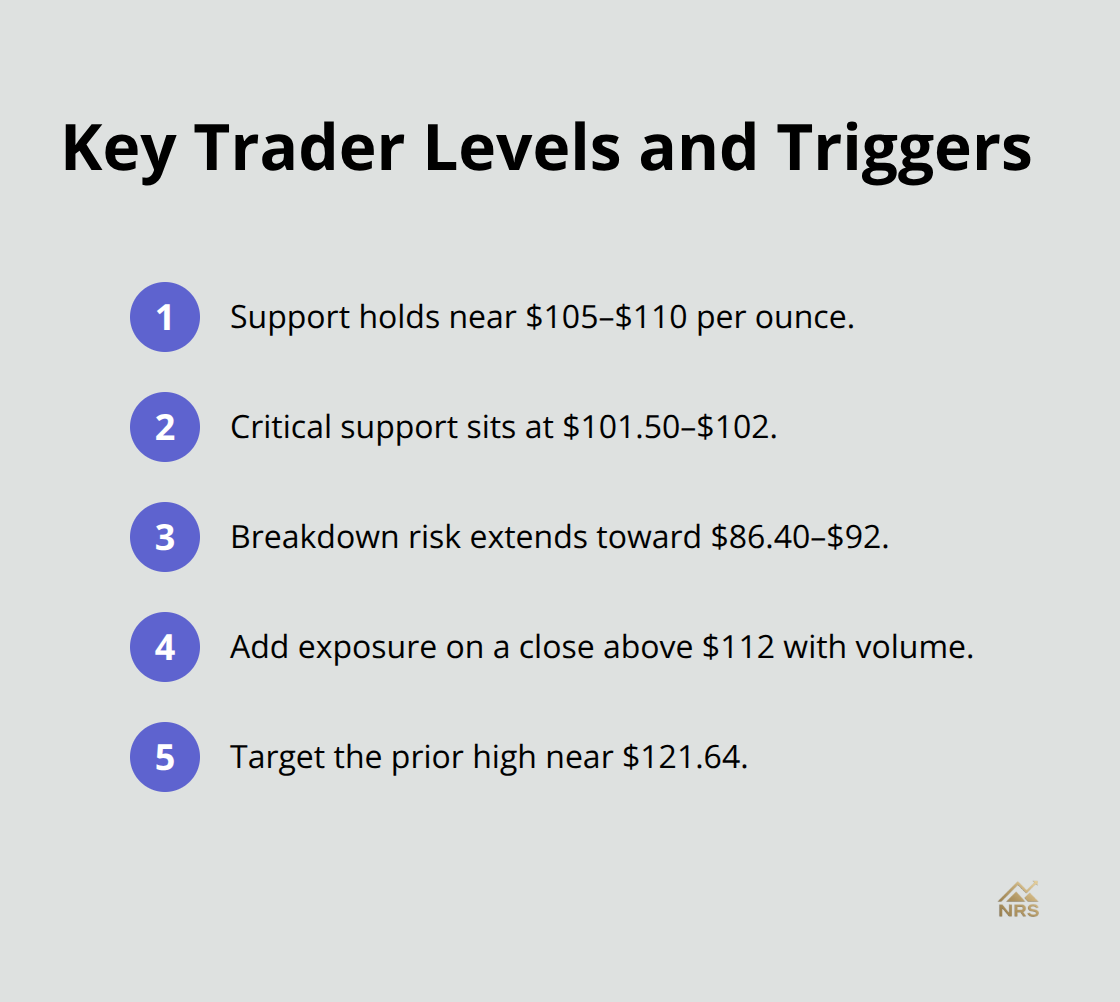
For short-term traders, the setup is clear: periodic profit-taking will occur near current levels, with support holding around $105–$110/oz. Any pullback into this zone represents a tactical re-entry point if you are comfortable with leverage and strict risk controls. The $101.50–$102 level marks critical support; a breakdown here could accelerate downside toward the $86.40–$92 corrective zone. Long-term investors should ignore the daily noise and focus on the fact that genuine scarcity translates into outsized price moves.
Silver’s investable market is roughly eight to nine times smaller than gold’s by value, which means liquidity-driven moves can be sharp and nonlinear.
Mining Stocks and the Scarcity Premium
If you hold silver through mining stocks, watch for permitting updates and production announcements from primary producers. The tightness in physical silver means that companies with low all-in sustaining costs and strong balance sheets will benefit disproportionately as prices remain elevated. This structural advantage creates a clear separation between well-positioned operators and those facing margin pressure. The next section examines the specific technical signals and market sentiment patterns that active traders use to time their entries and exits in this volatile environment.
Short-Term Silver Trading: Where Price Action Meets Real Demand
Recognizing Structure in Volatile Markets
Silver’s $16 intraday swing in January 2026 created genuine trading opportunities for those who understood the mechanics. Mania-driven volatility does not eliminate technical structure-it amplifies it. When silver trades 100% above its 200-day moving average, as it did in early 2026, momentum indicators turn extreme, but this is precisely when disciplined traders scale into positions near support rather than chase breakouts. The $105–$110 support zone held multiple times during the January pullback, and each test attracted aggressive buying from fabricators and long-term holders securing physical metal. This behavior matters because it tells you where institutional demand sits.
Using Physical Market Signals for Entry Timing
Traders who placed limit orders at $108–$109/oz captured entries with defined risk, knowing that the $101.50–$102 critical support level provided a hard stop if the thesis broke. The spread between spot prices and regional premiums-which remained firm even as futures prices whipsawed-gave traders a real-time signal that physical demand had not evaporated. When you see tight premiums persisting through a correction, it means end-users view lower prices as buying opportunities, not warnings. This is actionable intelligence. Set alerts at $107 and $105 if you are watching silver for short-term entries. Position sizing matters more than timing in volatile markets; take half-sized positions at $108 and scale in again if silver tests $105. This approach keeps you in the game without risking overexposure to the inevitable rebound.
Capitalizing on Consolidation Phases
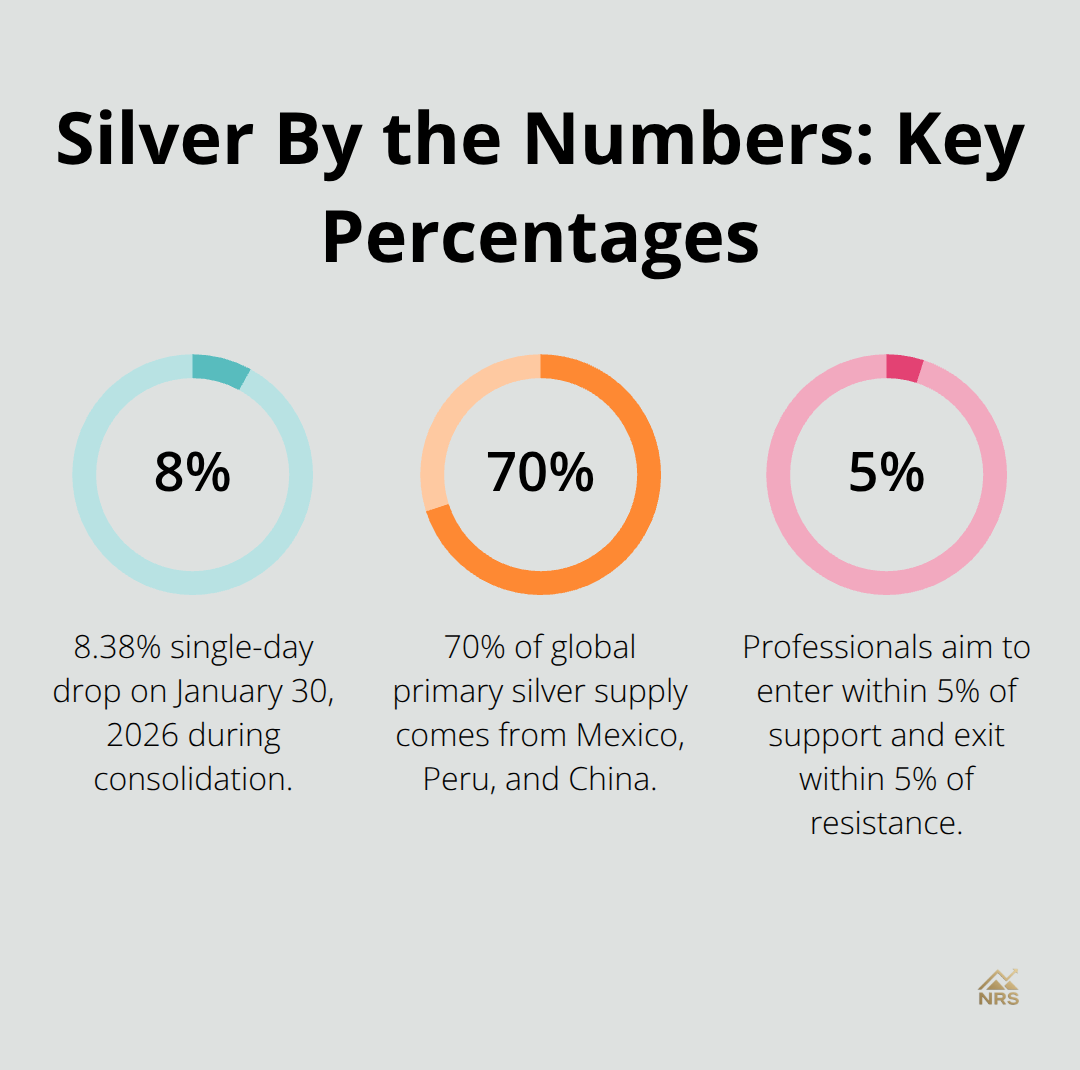
The sentiment shift from mania to consolidation typically happens fast in silver. After January’s record run, profit-taking accelerated as the dollar strengthened and the Federal Reserve signaled unchanged rates, pushing silver down 8.38% in a single day by January 30. However, consolidation creates the best risk-reward setups for traders willing to act decisively. When volatility contracts after extreme moves-typically when the 14-day RSI drops below 50 after being above 80-relief rallies often push 3–5% higher before meeting resistance. Trading Economics projects silver near $115/oz within 12 months, which means current pullbacks near $106 offer asymmetric risk for those with conviction. The practical approach is to avoid leverage entirely during consolidation phases and instead scale into small positions with tight stops at $102. Once silver closes above $112 on volume, aggressive traders can add exposure, knowing that the next target sits near the previous high of $121.64.
Supply Constraints Keep the Bias Bullish
Mexico, Peru, and China account for roughly 70% of global primary silver supply, and none have announced major production expansions that would ease the supply squeeze driving this cycle. This structural reality keeps the longer-term bias bullish even when short-term traders take profits. For active traders, the January 2026 pattern-a surge to $121.64 followed by a $15 correction-will likely repeat as silver consolidates. Each cycle offers entry points, but only if you execute with discipline and accept that catching the exact low is impossible. Professionals focus instead on entering within 5% of support levels and exiting within 5% of resistance. That methodology beats timing. The next section examines how long-term investors can build positions that capture silver’s structural upside without exposing themselves to the daily volatility that active traders exploit.
Why Silver’s Industrial Demand Drives Long-Term Value
Solar and Electronics Power Structural Demand
Solar installations and electronics manufacturing reshape silver’s price floor. The photovoltaic sector consumes roughly 100 million ounces annually, and this number accelerates as countries commit to renewable energy targets. A single solar panel requires approximately 15–20 grams of silver for electrical contacts and conductivity, meaning that each 1 gigawatt of installed solar capacity demands roughly 50–70 metric tons of silver. Global solar capacity expands at 15–20% annually, creating industrial silver demand with structural tailwinds that speculative traders cannot reverse. Electronics manufacturing, data centers, and electric vehicle battery components add another 300+ million ounces of annual consumption, creating a demand profile that grows independently of macroeconomic cycles.
Industrial buyers do not sell into rallies-they buy forward to lock in supply. This explains why premiums remained firm even as futures prices whipsawed in January 2026. Long-term investors should position accordingly: silver prices at $106–$115 per ounce represent genuine value when you account for the supply constraints and rising industrial consumption.
Supply Constraints Tighten the Market
Mexico, Peru, and China produce 70% of global primary silver, yet ore grades at major mines continue declining. Operators must process more ore to maintain output, and capital expenditure on new silver projects has contracted significantly. Supply growth will remain subdued for at least 3–5 years. This supply-demand math reflects real mine economics and fabricator behavior, not theoretical projections.
The structural reality keeps the longer-term bias bullish. When physical markets remain tight while prices correct, pullbacks become buying opportunities rather than warnings to exit.
Monetary Expansion Amplifies Silver’s Upside
Inflation protection and portfolio diversification create a powerful case for silver exposure over 5–10 year horizons. Gold has demonstrated cointegration with US M2 money supply since 1970, with roughly a 0.9% correlation-meaning each 1% increase in money supply historically corresponds to a 0.9% rise in gold prices. Silver amplifies this relationship because its smaller investable market means the same monetary stimulus pushes prices higher in percentage terms.
US M2 sits above $22.3 trillion and grows over 4% year-over-year, fiscal deficits expand, and velocity rises. The monetary backdrop supports continued precious metals strength. Investors holding 5–10% of portfolio value in silver through either physical bullion or mining stocks capture inflation protection while maintaining diversification from equities and bonds.
The Gold-to-Silver Ratio Points to Significant Upside
The gold-to-silver ratio compressed from above 80:1 to the mid-40s in early 2026. Historical precedent from 1967, 1980, 1997, and 2011 shows that late-cycle ratio compressions often overshoot before stabilizing. Silver could trade toward $150–$180 per ounce if the ratio compresses further toward historical 2011 levels, with potential upside above $250 under stress scenarios. This reflects the mathematical relationship between gold anchoring monetary confidence and silver reflecting scarcity and industrial leverage.
Building a Diversified Silver Position
For long-term holders, the practical approach involves building a core position now at current levels, then adding on any pullbacks toward $105–$107 per ounce. Scale into mining stocks with established cash flows like Northern Star Resources or Evolution Mining alongside pure-play silver exposure through companies advancing projects toward production. This diversification captures upside from both rising silver prices and operational leverage from established producers, while avoiding the execution risk of pre-revenue exploration companies. The structural case for silver remains intact regardless of near-term consolidation or pullbacks.
Final Thoughts
Silver stock market trends reveal a market shaped by genuine supply constraints and rising industrial demand, not speculation alone. Active traders exploit the $105–$110 support zone with disciplined position sizing and strict stop losses at $102, capturing 3–5% relief rallies as consolidation unfolds. Long-term investors build core positions now, recognizing that structural supply tightness from Mexico, Peru, and China will persist for years while solar, electronics, and EV demand accelerates.
Risk management remains non-negotiable in this volatile environment. Monitor critical support levels closely; a breakdown below $101.50 triggers sharper corrections toward $86–$92. Watch for shifts in geopolitical sentiment that reverse safe-haven flows, and track US dollar strength as a near-term headwind, while physical premiums staying firm signal genuine industrial demand that supports higher prices over time.
Scale into silver through mining stocks with established cash flows like Northern Star Resources or Evolution Mining alongside pure-play exposure to balance execution risk. Build a 5–10% portfolio allocation to silver through a mix of physical bullion and mining stocks, then rebalance on rallies above $115 and add on pullbacks toward $107. Explore expert analysis and market insights at Natural Resource Stocks to refine your positioning as silver stock market trends evolve.