


Silver has quietly become one of the most underrated assets in investor portfolios. At Natural Resource Stocks, we’ve watched silver navigate volatile markets while maintaining its dual appeal as both an industrial commodity and a wealth preserver.
This silver investment guide breaks down the strategies that work. Whether you’re considering physical ownership, mining stocks, or timing your entry points, we’ll show you how to position yourself effectively in today’s silver market.
Why Silver Matters Now
Silver’s performance over the past year tells a story that most investors are still missing. According to the Silver Institute, silver surged to above $36 per ounce in 2025, its highest level since 2013, driven by record industrial demand of approximately 680.5 million ounces and five consecutive years of supply deficits. This isn’t speculation or temporary momentum. The fundamentals are real. In 2023, the global solar photovoltaics industry accounted for 193.5 million ounces of global silver demand, representing about 16% of overall consumption.
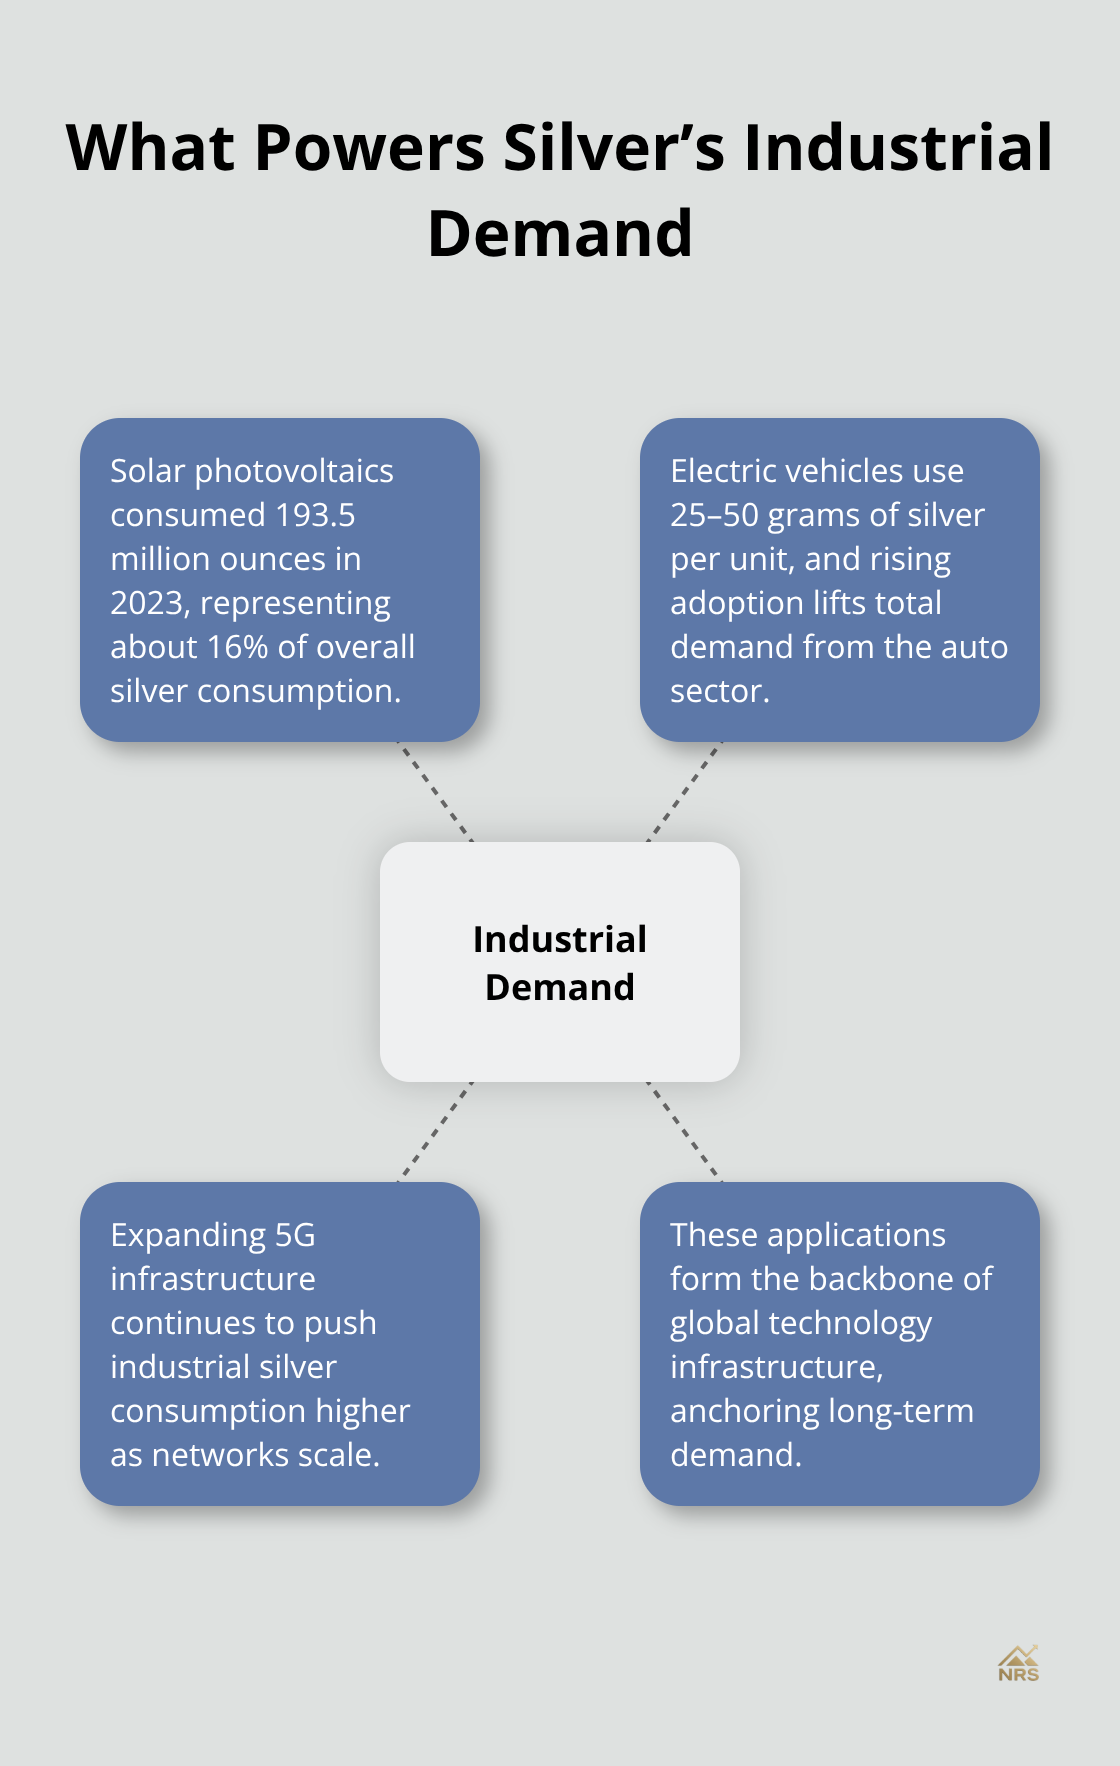
Electric vehicles require between 25 and 50 grams of silver per unit, and expanding 5G infrastructure continues to push industrial consumption higher. These applications represent the backbone of global technology infrastructure. The gold-to-silver ratio currently sits near 92:1, well above the historical average of 60:1, which signals that silver remains undervalued relative to gold in the current cycle. This ratio matters because it gives you a concrete reference point for positioning.
Why the Gold-to-Silver Ratio Signals Opportunity
When the ratio widens, it historically indicates buying opportunities for silver. A narrower ratio favors silver appreciation relative to gold. You can use this metric to time your entries and exits across both metals. The current 92:1 ratio suggests silver has more upside potential than gold in the near term, assuming the ratio normalizes toward the 60:1 historical average. This positioning strategy works because it removes emotion from your decision-making process.
Silver’s Volatility as a Strategic Advantage
Silver trades with roughly twice the volatility of gold, and that’s actually an advantage if you understand how to use it. A 10% move in silver prices often translates to 20 to 30% gains in high-quality mining stocks, according to S&P Global Market Intelligence data. That leverage cuts both ways, but for investors with a five-year or longer horizon, the volatility creates entry points that gold rarely offers. Inflation expectations and currency weakness drive demand for physical silver as a hedge, but industrial consumption remains the real driver. The U.S. Mint reports that physical ownership provides genuine diversification because silver’s performance doesn’t move in lockstep with stocks or bonds.
Storage Realities and Cost Considerations
Storage and insurance costs are real expenses you need to factor in. A $50,000 position in silver requires roughly 1,400 ounces, which takes up approximately 56 times more physical space than the equivalent value in gold. This matters when you’re planning where to store it. Home safes offer immediate access but carry higher theft risk. Bank safe-deposit boxes provide security at low cost but limit your access. Private vaults maximize security and work well for IRA accounts, though they charge ongoing fees (typically $100–$300 annually). You must weigh these trade-offs against your investment timeline and portfolio size.
Price Targets and Supply Fundamentals
Analyst targets from Bank of America, CPM Group, and Metals Focus project bullish potential for silver into 2025 and beyond, with bull case scenarios reaching $50 per ounce or higher. The supply deficit story is genuine. Five consecutive years of supply shortfalls mean the market is tightening, not loosening. That structural imbalance supports higher prices over time, even if short-term volatility creates temporary pullbacks. These supply constraints won’t reverse quickly, which means the tailwinds for silver remain intact across multiple years.
Understanding these fundamentals positions you to make informed decisions about which silver investment method fits your situation. The choice between physical ownership, ETFs, and mining stocks depends on your specific goals and constraints.
How to Choose Your Silver Exposure Method
Physical Silver vs. ETFs: Understanding the Trade-offs
Physical silver coins and bars give you direct ownership with no counterparty risk, which matters if your primary goal is wealth preservation during financial stress. American Silver Eagles carry a 4 to 8 dollar premium over spot price and remain the most liquid bullion coin available, making them ideal if you need to sell quickly. Canadian Silver Maple Leafs trade with roughly 3 to 5 dollar premiums and offer 99.99% purity, giving you slightly better value per ounce. For larger positions, 10 ounce bars cut your per-ounce cost to just 0.99 to 2.00 dollars above spot, which compounds meaningfully on bigger holdings.
A practical approach many investors use divides holdings into 40% government coins for liquidity, 40% bars for cost efficiency, and 20% junk silver (pre-1965 90% coins trading around 20 to 22 times face value) for fractional flexibility. This allocation balances your need for quick sales against the cost savings that larger bars provide.
ETFs like iShares Silver Trust with its 0.50% annual expense ratio and Sprott Physical Silver Trust at 0.68% eliminate storage headaches and work seamlessly inside retirement accounts without IRS fineness requirements limiting your options. The real trade-off: ETFs expose you to counterparty and tracking risk while you own shares rather than metal, yet they provide instant liquidity that physical holdings cannot match.
The number 0% seems to be not appropriate for this chart. Please use a different chart type.
Mining Stocks and Leverage Exposure
Silver mining stocks amplify your exposure dramatically. A 10% silver price move historically generates 20 to 30% returns in quality miners. This leverage cuts both ways-company-specific operational risks and equity volatility add layers of complexity that physical silver avoids entirely. You gain exposure to silver prices while accepting the additional risks that come with equity ownership.
Timing Your Entry Points
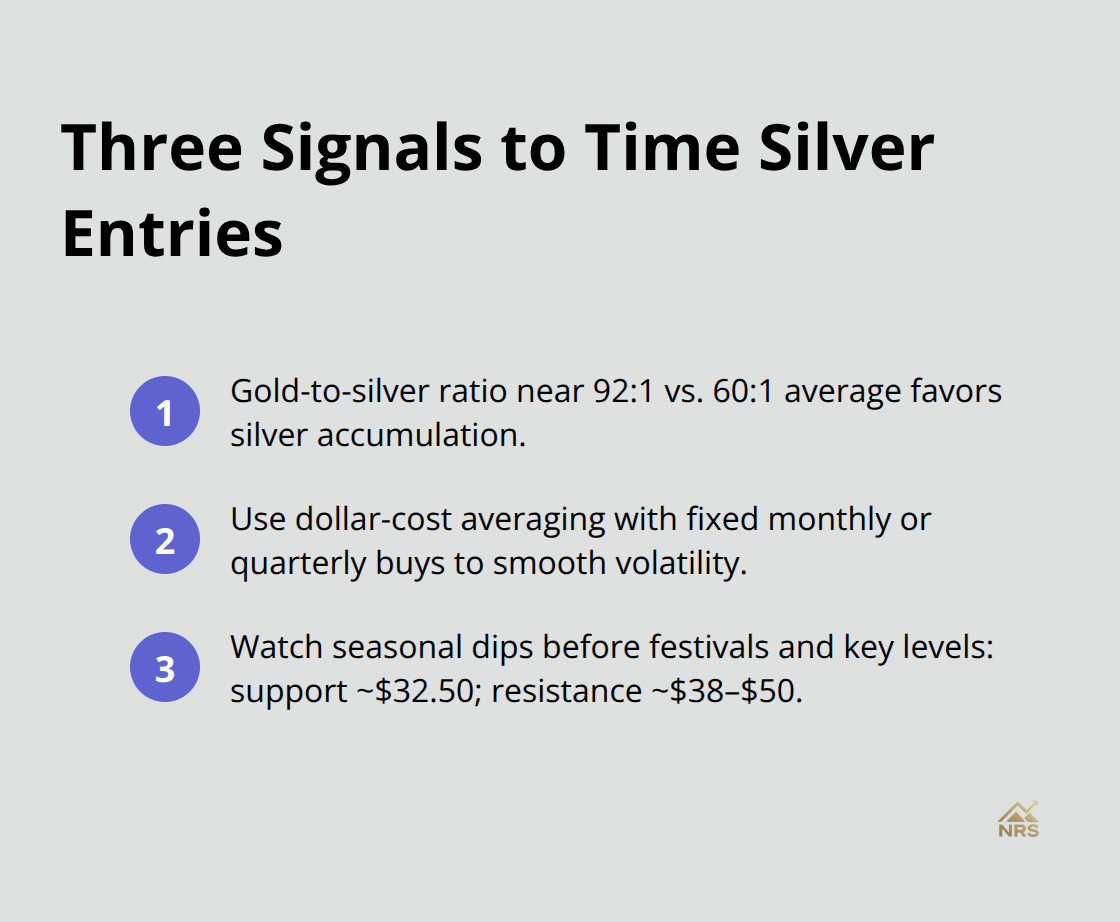
Timing silver entries requires watching three concrete signals that remove guesswork from your positioning. The gold-to-silver ratio at 92:1 versus the 60:1 historical average tells you silver has significant upside potential before ratio normalization occurs, making this an environment favoring silver accumulation over gold. Dollar-cost averaging works best for silver given its volatility-investing fixed amounts monthly or quarterly smooths out price swings and eliminates the impossible task of perfect timing.
Seasonal patterns matter too: jewelry demand spikes in India and China during major festivals, creating predictable price dips beforehand that reward patient buyers. Support levels sit around 32.50 dollars per ounce with resistance between 38 to 50 dollars, giving you concrete price targets for scaling into positions or taking profits.
Building Your Accumulation Strategy
Many successful stackers start with 500 to 1,000 dollars to diversify across product types, then add 50 to 100 dollars monthly as their core strategy. Bank of America projects bull scenarios reaching 50 dollars per ounce, CPM Group targets 48 dollars, and Metals Focus sees potential at 55 dollars-these analyst targets provide realistic upside anchors without chasing speculative extremes.
The five consecutive years of supply deficits mean structural tailwinds persist for years, not months, so rushing entries based on short-term price moves contradicts the fundamental thesis. Your positioning method matters far less than your commitment to consistent accumulation across multiple years. Once you’ve selected your exposure method and entry strategy, the next critical decision involves understanding where and how to store your silver holdings safely.
What’s Actually Driving Silver Prices Right Now
Silver prices respond to three concrete forces that reshape the market in 2026. The supply deficit story provides the backbone, but geopolitical disruptions, central bank actions, and industrial consumption patterns create the actual volatility that impacts your entry timing.
Geopolitical Tensions Constrain Supply
Geopolitical tensions in major mining regions like Peru, Mexico, and Kazakhstan directly constrain silver output. Peru produces roughly 3,500 metric tons annually and faces ongoing labor disputes and political instability that threaten production continuity. Mexico contributes another 6,000 metric tons but operates amid rising security concerns affecting transportation and operations. These aren’t theoretical risks-production slowdowns translate directly into tighter supply, which intensifies the five-year deficit pattern that already exists. When supply constraints tighten further, prices move higher because industrial demand from solar, electronics, and automotive sectors won’t pause.
Federal Reserve Policy and Interest Rates Shape Demand
The Federal Reserve’s interest rate decisions matter tremendously because higher rates reduce inflation expectations and can temporarily suppress precious metal demand, while rate cuts reverse that dynamic. Currently, markets price in potential Fed rate cuts through 2026 after the 2025 tightening cycle, which supports silver’s inflation hedge narrative. Lower real interest rates-the difference between nominal rates and inflation-make non-yielding assets like silver more attractive relative to bonds. Watch the 10-year Treasury yield against inflation expectations; when that gap narrows, silver typically performs better.
Industrial Consumption Drives the Real Demand Story
Industrial demand remains the dominant consumption driver. Solar photovoltaic installations consumed 232 million ounces in 2024 according to the Silver Institute, and that figure continues climbing as renewable energy capacity expands globally. Electric vehicles now represent roughly 14 percent of global auto sales, and each EV contains 25 to 50 grams of silver in electrical components and connectors. That translates to roughly 1.4 million ounces of silver consumed annually just from EV production at current manufacturing volumes. 5G infrastructure rollout adds another 50 to 100 million ounces annually as telecom companies upgrade networks. These three sectors-solar, automotive, and telecommunications-consume roughly 380 million ounces yearly and show no signs of slowing.
Practical Monitoring and Action Steps
Monitor quarterly earnings reports from major solar manufacturers like First Solar and automotive suppliers to assess whether industrial demand accelerates or stalls. If solar installations exceed 1,000 gigawatts annually or EV production surpasses 20 million units per year, industrial silver demand will push prices higher regardless of macro headwinds. The supply deficit persists because mine output struggles to keep pace with this demand surge, meaning your positioning strategy should emphasize accumulation during price dips rather than waiting for perfect entry points that may never arrive.
Final Thoughts
Silver’s structural fundamentals remain intact heading into 2026, with five consecutive years of supply deficits, record industrial demand exceeding 680 million ounces annually, and the 92:1 gold-to-silver ratio all pointing toward sustained upside potential. The supply tightness won’t reverse quickly, which means your silver investment guide should emphasize consistent accumulation rather than perfect timing. Select your exposure method based on your situation: physical ownership for wealth preservation, ETFs for retirement accounts and liquidity, or mining stocks if you accept leverage and equity risk.
Dollar-cost averaging smooths volatility and removes emotion from your entries, while monitoring industrial demand signals from solar installations, EV production, and 5G rollouts keeps you aligned with the sectors consuming roughly 380 million ounces annually. Many successful investors start with $500 to $1,000 across multiple product types, then add $50 to $100 monthly to build meaningful positions over years without requiring perfect market timing. The choice between American Silver Eagles, Canadian Maple Leafs, 10-ounce bars, or junk silver matters far less than starting your accumulation plan.
We at Natural Resource Stocks provide expert analysis on macroeconomic factors affecting silver prices, geopolitical impacts on mining supply, and emerging opportunities across metals sectors through video content, market analysis, and community insights that help you refine your positioning strategy. Visit Natural Resource Stocks to access the research and expert commentary that informs smarter silver positioning decisions. The structural tailwinds supporting silver prices persist across multiple years, making consistent action more valuable than waiting for ideal conditions that may never arrive.