


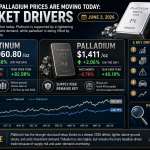


Commodity prices move in response to forces far beyond supply and demand. Interest rates, currency strength, geopolitical tensions, and production constraints all shape where resources trade.
At Natural Resource Stocks, we’ve seen investors miss major opportunities because they overlooked these macroeconomic factors. Understanding how these forces interact with commodity prices separates successful portfolio positioning from costly mistakes.
How Interest Rates Shape Commodity Valuations
Central banks don’t set commodity prices directly, but their rate decisions fundamentally alter the economics of holding resources. When the Federal Reserve or European Central Bank raises rates, the cost of storing and financing commodity inventories increases. Higher carry costs make it more expensive for traders and producers to hold physical stocks, which typically pushes prices lower.
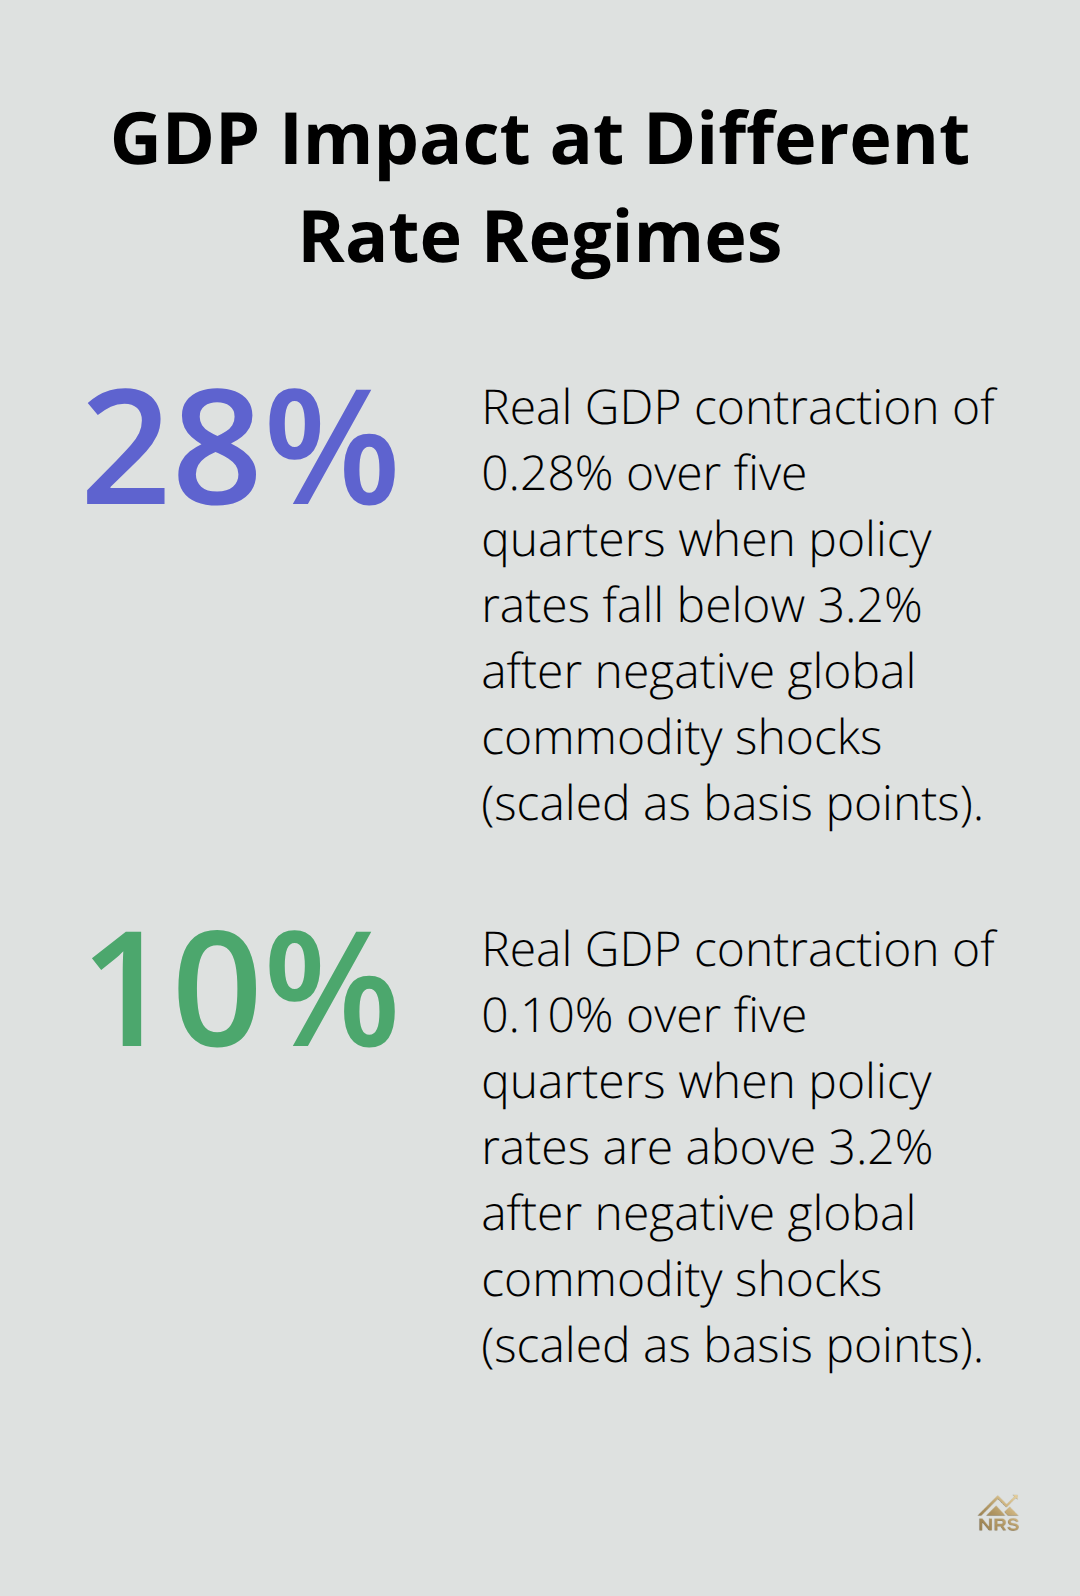
Research from Ahmed (2023) analyzing 17 advanced economies across four decades identifies a critical threshold: when policy rates fall below 3.2%, negative global commodity shocks trigger roughly 0.28% real GDP contraction over five quarters. Above that threshold, the contraction drops to just 0.10%. This regime-dependent relationship means investors face fundamentally different risks depending on where rates sit relative to this inflection point.
The 2022-2023 Rate Cycle in Action
The Federal Reserve raised rates from near zero to 5.25%-5.50% between March 2022 and July 2023, and oil prices fell from their March 2022 peak of $130 per barrel to around $75 by late 2023. Gold, often viewed as a rate-sensitive asset, declined roughly 15% during the same aggressive tightening period, though it recovered as rate-hike expectations reversed. These movements illustrate how quickly rate shifts translate into commodity price pressure.
Monitor the Futures-Spot Price Gap
The gap between futures prices and spot prices reveals market expectations about future rate environments and inventory dynamics. When this spread widens, it signals that traders expect carry costs to remain elevated, suggesting rates will stay restrictive longer. Conversely, narrowing spreads indicate expectations of rate relief ahead. Track the three-month and twelve-month futures spreads for oil, copper, and gold as leading indicators of macro positioning.
Real Interest Rates Matter More Than Nominal Rates
Real interest rates-nominal rates minus inflation expectations-matter more than nominal rates alone. A 4% nominal rate with 3% expected inflation leaves just 1% real return, which changes commodity demand calculations entirely compared to a 4% nominal rate with 1% inflation. The Federal Reserve Economic Research finds that oil prices can affect inflation through supply-chain cost transmission, though effects vary significantly by economic context.
This creates a feedback loop where rate expectations adjust based on commodity-driven inflation signals, which then reset commodity prices themselves. Investors should monitor the 10-year Treasury yield breakeven rate, which markets price in daily and reflects inflation expectations over the medium term. When breakevens rise sharply while nominal rates stay flat, real rates are actually falling, which typically supports commodity prices despite seemingly unchanged Fed policy.
How Rate Regimes Shift Portfolio Risk
The threshold effects identified in research (Ahmed 2023) persist across time and country composition, suggesting a structural phenomenon rather than a period-specific artifact. When central banks operate near the zero lower bound, economies become more susceptible to external demand shocks, elevating macro risk from commodity price moves. This means your portfolio positioning should shift based on where policy rates stand relative to that 3.2% threshold-a low-rate environment demands different hedging strategies than a restrictive one.
Currency strength and geopolitical tensions amplify these rate-driven dynamics, creating additional layers of complexity that investors must navigate when positioning around commodity exposure.
Currency Fluctuations and Global Demand Dynamics
Most commodities trade in U.S. dollars globally, which means currency fluctuations and commodity prices directly control what foreign buyers pay. When the dollar strengthens against major currencies, commodity prices fall in dollar terms, making resources more expensive for buyers holding euros, yen, or emerging-market currencies. A stronger dollar dampens demand from international purchasers precisely when U.S. producers benefit least from higher nominal prices.
Why Dollar Strength Pressures Commodity Prices
This dynamic played out clearly in 2023 and early 2024: as the Federal Reserve maintained rates above 5% while other central banks eased policy, the dollar index climbed toward 107, and copper prices fell roughly 8% despite strong underlying demand from renewable energy projects. Investors must track the dollar index daily because currency moves often precede commodity price shifts by one to three weeks. When the dollar rallies on rate differentials alone, commodity weakness typically follows within days.
Conversely, when dollar strength stems from safe-haven demand during geopolitical crises, commodity prices sometimes rise simultaneously as investors fear supply disruptions. This inverse relationship reveals that the dollar’s impact on commodities depends on what drives the currency move-not all dollar strength affects resources the same way.
Emerging Market Growth and Metal Demand
China accounts for roughly 50% of global copper demand and 60% of iron ore consumption, making Chinese manufacturing data the most actionable leading indicator for base metals. When emerging market manufacturing data and base metal demand weaken, copper and iron ore prices typically decline within two weeks. India’s steel production and cement output drive demand for iron ore and coal, with Indian construction spending rising approximately 8% annually over the past five years.
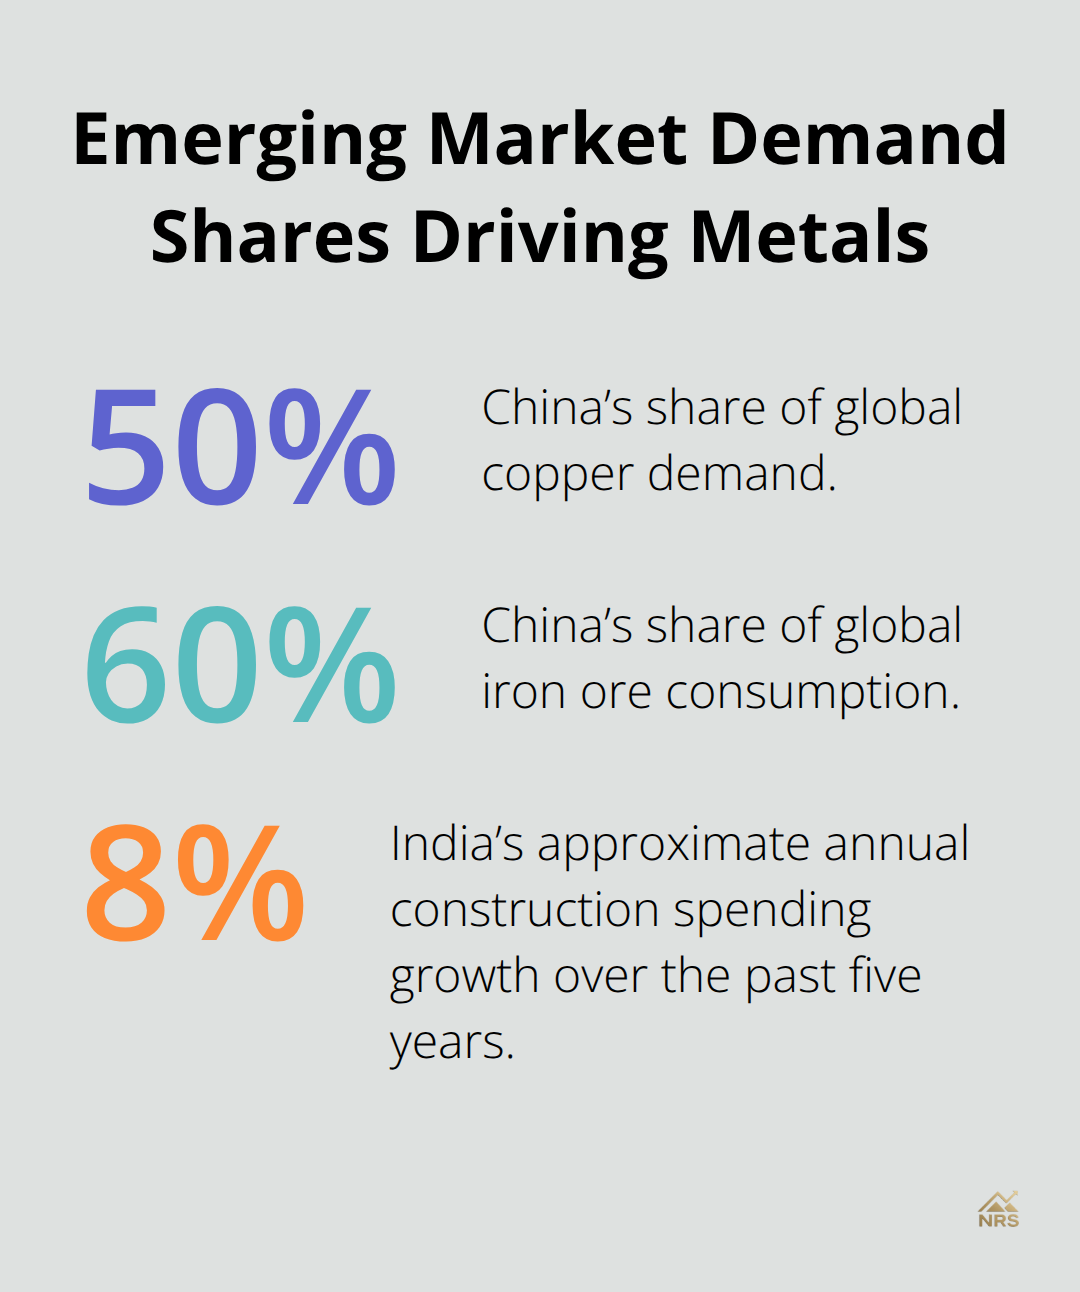
Track emerging-market PMI releases and Chinese infrastructure spending announcements as concrete signals of where commodity prices head next. These indicators move markets faster than backward-looking economic data.
Energy Demand and Geopolitical Supply Shocks
OPEC production decisions and U.S. shale output shifts determine oil availability, but demand from developing economies drives the price floor. The 2022 Russia-Ukraine conflict created immediate supply fears that pushed oil toward $120 per barrel, yet prices fell sharply once markets recognized that demand destruction from higher prices would offset supply losses.
Sanctions targeting energy producers reshape global supply chains within weeks, forcing importers to source from alternative suppliers at premium prices temporarily, until markets adjust and prices normalize. Supply chain disruptions from geopolitical events prove temporary, but the initial price spikes create real trading opportunities for investors positioned ahead of the adjustment.
Supply Chain Disruptions and Production Constraints
Mining operations face hard physical limits that markets often ignore until prices move violently. Copper mines take seven to ten years from exploration to first production, meaning supply cannot respond quickly to price rallies. When major mines face unexpected shutdowns-whether from labor strikes, equipment failures, or environmental restrictions-the market discovers instantly that replacement supply does not exist. In 2023, Peru’s political instability disrupted copper output from Antapaccay and other key operations, tightening global supply within weeks and pushing copper prices higher despite weakening Chinese demand signals. This taught investors a critical lesson: production constraints matter more than macro forecasts when physical supply cannot expand.
Mining Output Limitations and Market Impact
Track mining company guidance on production volumes and watch for labor negotiations at major operations. When a mine representing 2% of global copper supply faces a contract dispute, that single event can move prices more than Federal Reserve policy announcements. The 2023 Peru disruption proved this principle in real time-copper prices responded to the supply shock faster than they reacted to broader economic weakness. Investors who monitored mining company announcements positioned ahead of the price move, while those focused solely on macro indicators missed the opportunity entirely.
Energy Production Bottlenecks and Price Dynamics
Oil production behaves similarly but with different timing constraints. The U.S. Energy Information Administration reports global oil production reached 102.6 million barrels per day in 2024, but that figure masks critical bottlenecks. OPEC production cuts since 2020 removed roughly 3 million barrels daily from markets, creating a persistent supply deficit that supports prices regardless of demand weakness. Saudi Arabia and Russia control whether that deficit shrinks or grows, making their production decisions the most actionable commodity indicator available.
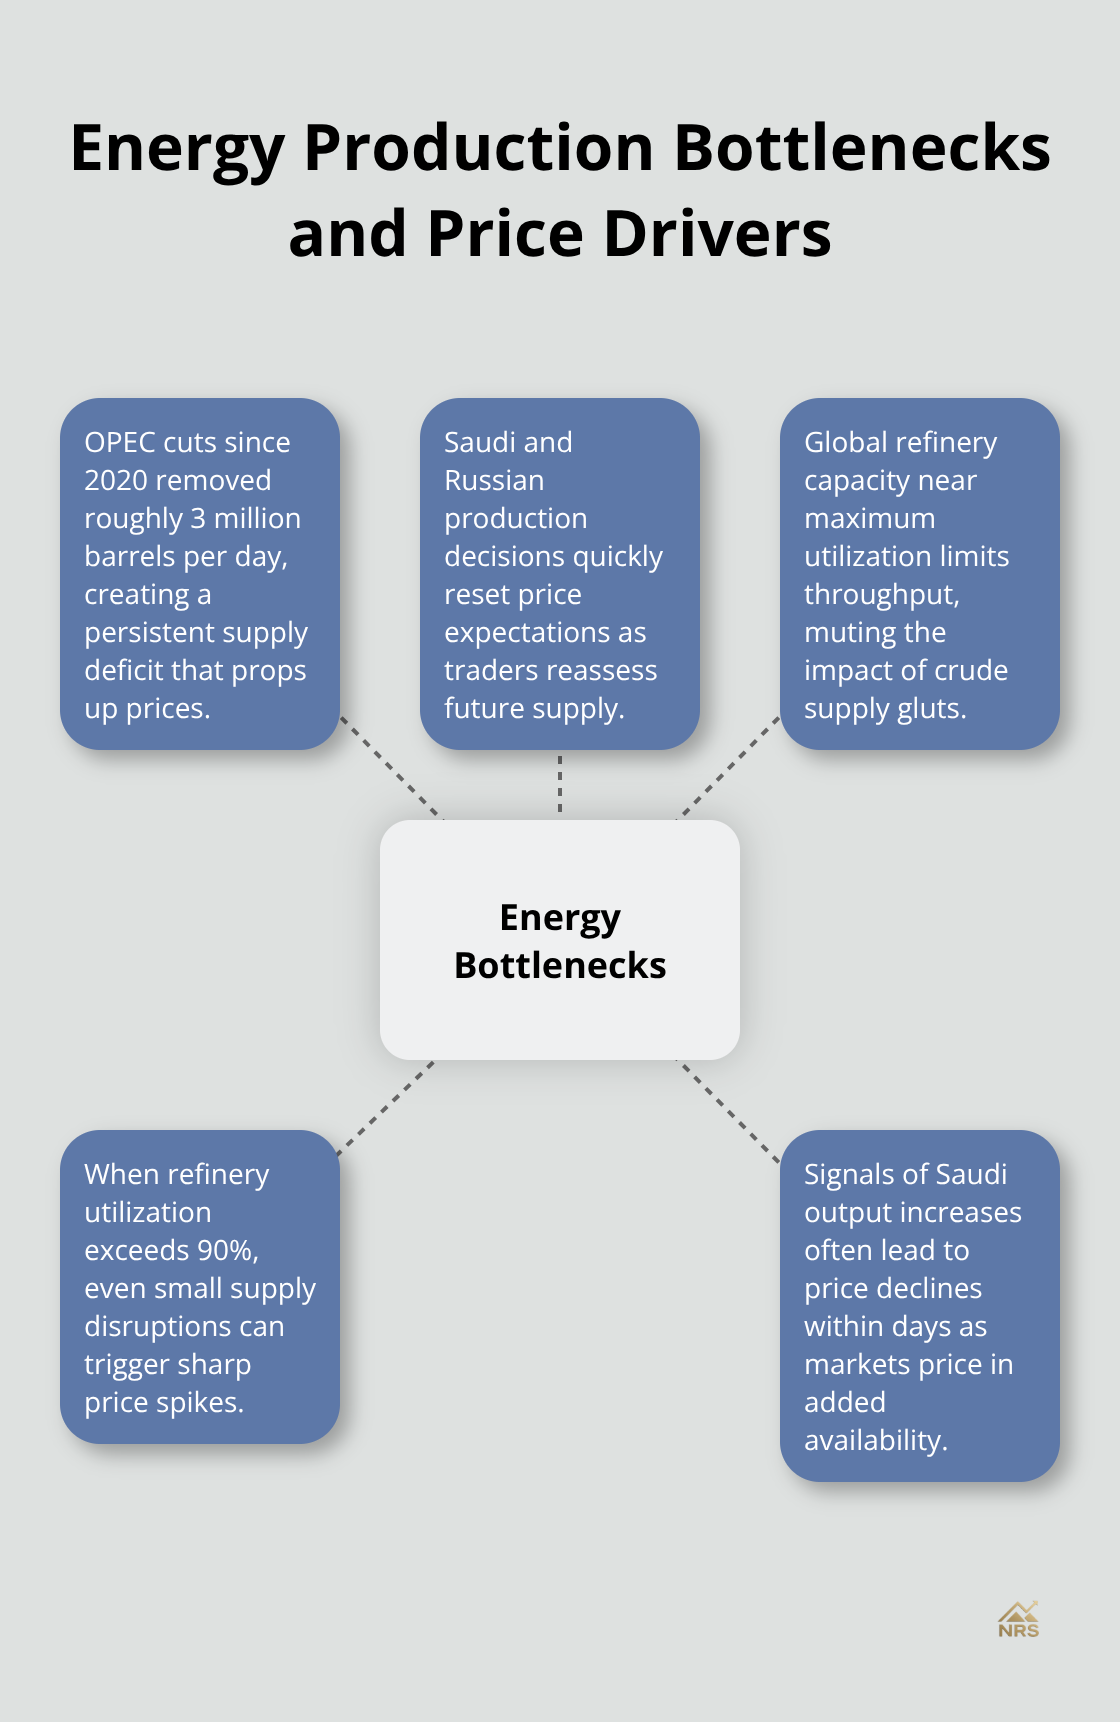
When Saudi Arabia signals output increases, oil prices typically fall within days-not because demand changed, but because traders immediately reassess supply availability months forward.
Energy production faces different constraints than mining. Refinery capacity globally sits near maximum utilization, meaning crude oil supply gluts cannot flow to markets when refineries run full. This created the 2022 dynamic where oil prices stayed elevated despite rising production because refineries could not process additional crude fast enough. Track global refinery utilization rates monthly; when they exceed 90%, even small supply disruptions create price spikes because no processing capacity exists to absorb additional barrels.
How Sanctions Reshape Resource Availability
Sanctions reshape energy markets faster than any other commodity sector. When Western nations sanctioned Russian oil following the 2022 Ukraine invasion, markets had roughly four weeks before Russian crude disappeared from European refineries. Prices spiked initially, but the adjustment proved temporary-within eight weeks, alternative suppliers filled the gap at modest premiums. However, sanctioned energy producers face permanent market share losses because buyers invest in alternative supply relationships and infrastructure that persists even after sanctions lift. This makes sanctions on energy producers far more consequential than temporary supply disruptions.
For investors, sanctions targeting mining or energy operations in major producing nations warrant immediate portfolio review because supply losses often prove structural rather than cyclical. Monitor sanctions announcements from the U.S. Treasury, European Union, and United Nations closely; when they target resource producers, commodity prices often move before mainstream financial media recognizes the significance.
Final Thoughts
Macroeconomic factors and commodity prices move together in patterns that most investors fail to recognize until prices shift sharply. Interest rates, currency strength, and production constraints form a framework that separates profitable positioning from reactive trading. Track the Federal Reserve’s policy rate against that 3.2% threshold because when rates fall below this level, your portfolio faces amplified risk from global demand shocks transmitted through commodity prices. Watch the dollar index daily since currency moves often precede commodity price shifts by weeks, and when the dollar strengthens on rate differentials, expect commodity weakness within days.
For actionable signals, monitor emerging market manufacturing data and Chinese infrastructure spending announcements because these indicators move base metal prices faster than backward-looking economic reports. Mining company production guidance and labor negotiations at major operations matter more than macro forecasts when physical supply cannot expand quickly. Energy investors should track global refinery utilization rates monthly and OPEC production decisions weekly, as these determine whether supply deficits persist or shrink. When sanctions target major resource producers, treat supply losses as structural rather than temporary since buyers invest in alternative relationships that persist long-term.
Position your portfolio by matching your time horizon to the macroeconomic regime you face. In low-rate environments, commodity exposure requires different hedging strategies than restrictive-rate periods. We at Natural Resource Stocks provide the market analysis and expert commentary you need to understand how macroeconomic factors affect commodity prices in real time through our platform’s video and podcast content.