


Silver prices swing wildly based on industrial demand, geopolitical shocks, and macroeconomic shifts. At Natural Resource Stocks, we’ve seen investors struggle to navigate this silver market volatility without a clear strategy.
This guide walks you through the forces behind price swings, historical patterns, and practical tactics to protect your portfolio from sudden moves.
What Actually Moves Silver Prices
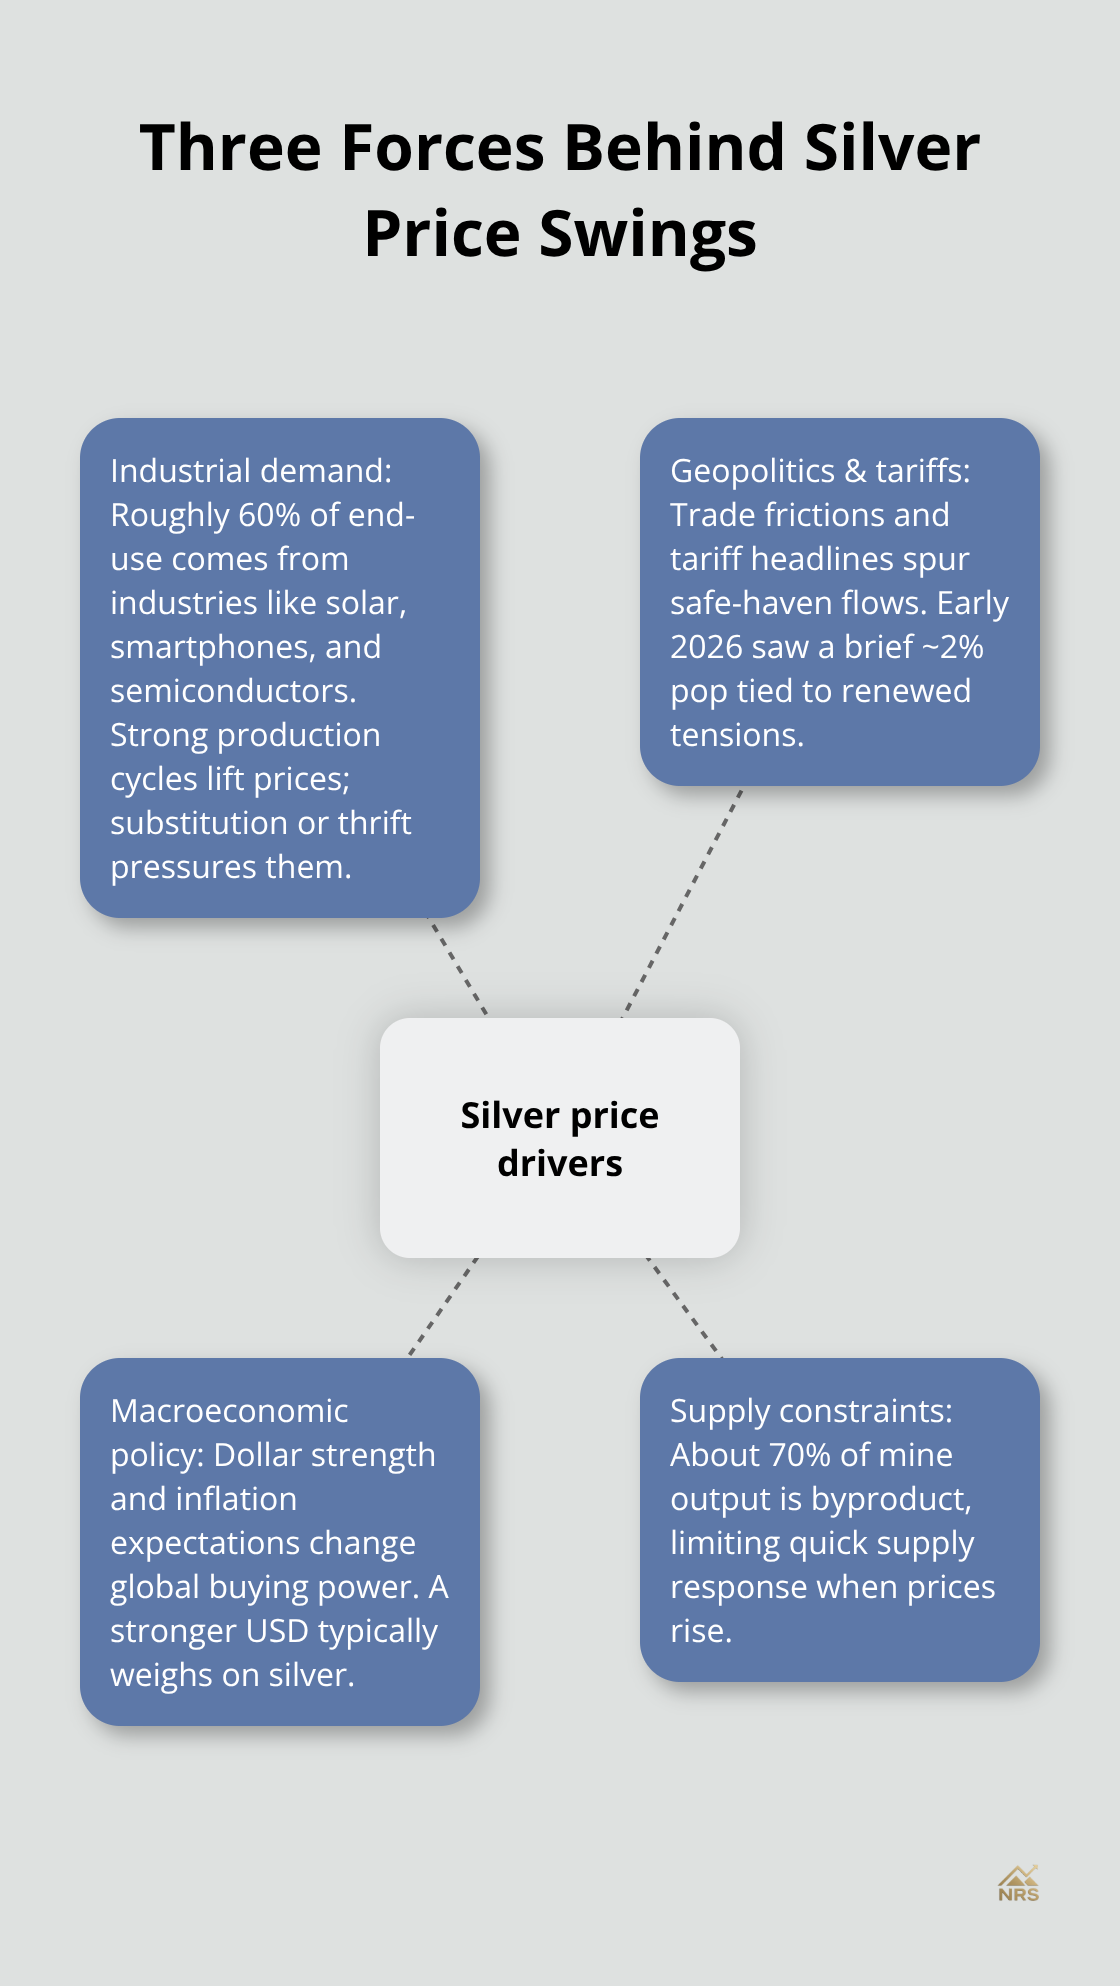
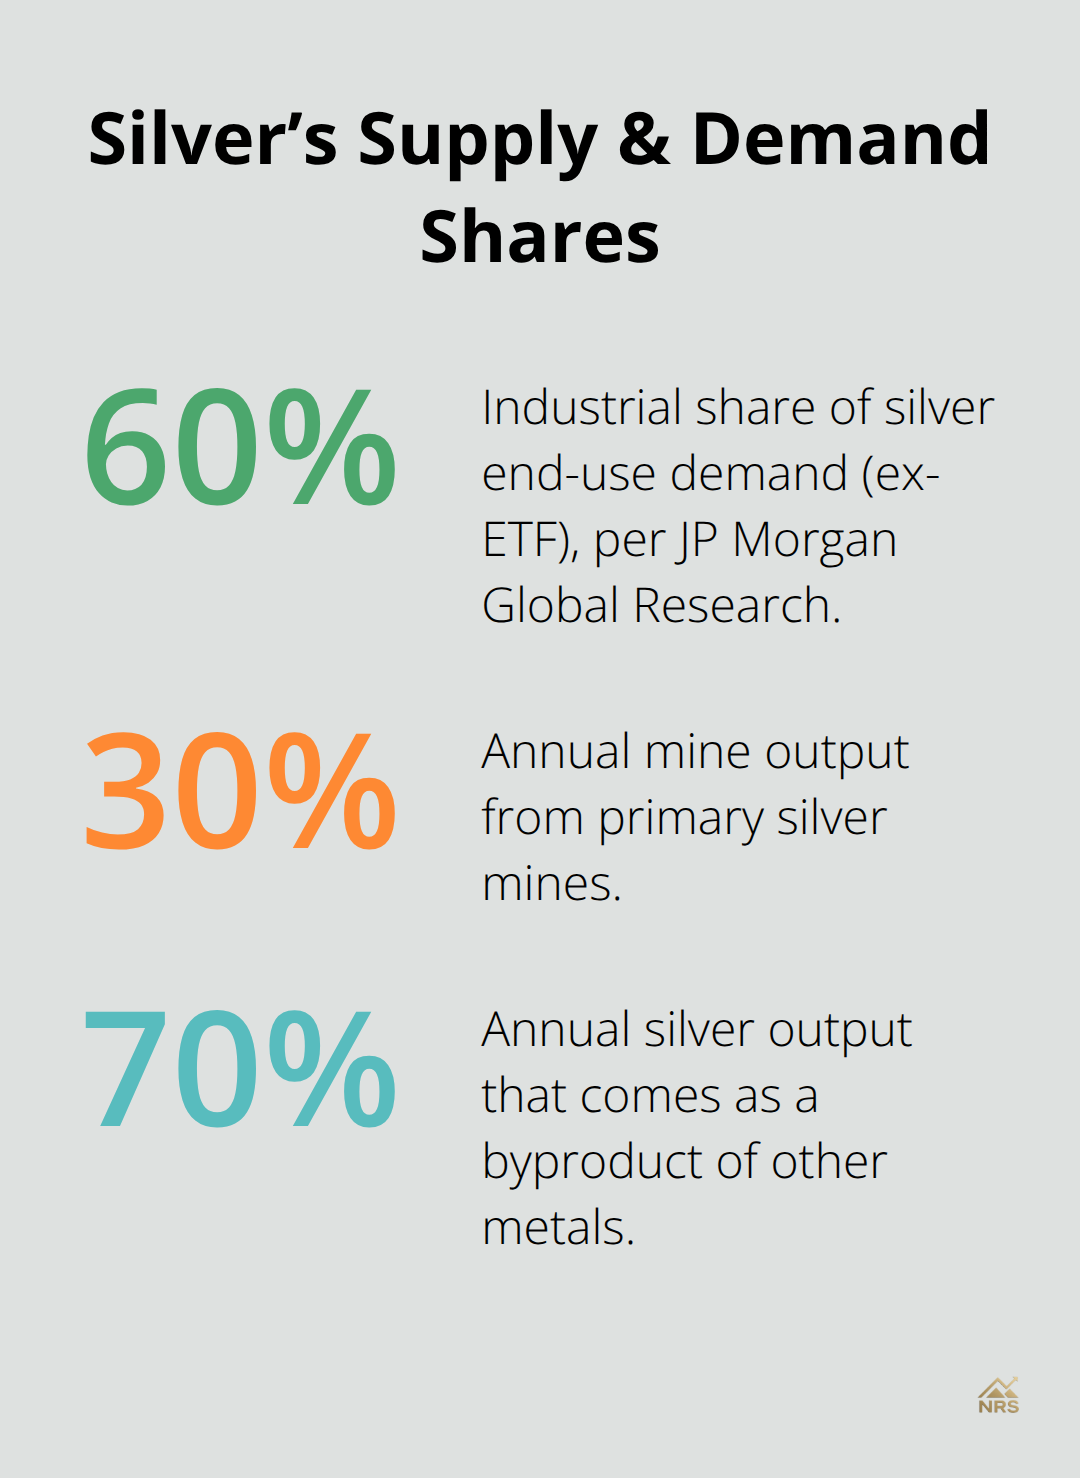
Silver’s price swings stem from three interconnected forces that most investors misunderstand or ignore. First, industrial demand drives roughly 60 percent of silver’s end-use consumption, excluding ETF flows, according to JP Morgan Global Research. This makes silver fundamentally different from gold, where industrial demand accounts for only about 5 percent. Solar panels alone consumed roughly 200 million ounces of silver in recent years, with the metal representing over 30 percent of panel costs. When solar manufacturers accelerate production or when smartphone and semiconductor demand picks up, silver prices typically rise. Conversely, when tech companies explore silver-free alternatives or reduce silver content through thrift measures, prices face downward pressure.
Geopolitical Risk and Tariff Uncertainty
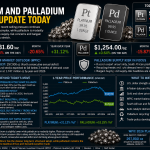
The second driver is geopolitical risk and tariff uncertainty. In February 2026, silver climbed roughly 2 percent as renewed tariff tensions boosted demand for safe-haven assets, ultimately reaching 87.22 USD per ounce. U.S. tariff increases from 10 percent to 15 percent, Europe’s suspension of a trade deal ratification, and India delaying interim talks all contributed to this rally. The third force is macroeconomic policy, particularly dollar strength and inflation expectations. A softer U.S. dollar supports silver prices because international buyers need fewer dollars to purchase the metal. Conversely, a strong dollar makes silver more expensive globally and typically pressures prices downward. The USD index hovered in the mid-to-high 97s in mid-February 2026, providing some support but leaving silver vulnerable to sudden policy announcements.
Supply Constraints Amplify Volatility
About 30 percent of annual silver mine output comes from primary silver mines, according to JP Morgan Global Research, while the remaining 70 percent arrives as a byproduct from copper, lead, zinc, or gold mining operations. This inelastic supply structure means mine production cannot quickly adjust to rising prices. When tariffs threaten copper or other byproduct metals, mining companies cannot simply increase silver extraction to compensate. The late-2025 rally occurred amid a tight physical market, with notable shifts of metal from London to New York as investors hedged against tariff risk. Silver’s physical market is roughly one-tenth the size of gold’s, and futures open interest is about one-fifth of gold’s level, making silver far more volatile when large trades occur. This smaller market means your investment decisions carry outsized impact on pricing, and you should avoid market-timing strategies that assume normal liquidity.
Why Silver Moves Faster Than Gold
Silver is more sensitive to gold price movements than vice versa. A modest 5 percent drop in gold can translate into a much larger decline in silver, signaling higher near-term downside risk during corrections. Central banks actively buy gold during market dips, creating a price floor, but they do not purchase silver in the same manner. This absence of central bank support leaves silver valuations dependent entirely on industrial and investment demand. JP Morgan Global Research’s 2026 forecast projects a choppy quarterly path, with silver averaging 81 USD per ounce for the year, implying roughly 84 USD in the first quarter, 75 USD in the second quarter, 80 USD in the third quarter, and 85 USD in the fourth quarter. This quarterly volatility reflects silver’s sensitivity to tariff announcements, Federal Reserve statements, and global trade developments.
Taking Action on Market Signals
You should monitor tariff developments under the Section 232 Critical Minerals investigation, track physical liquidity shifts between London and New York exchanges, and follow Chinese and Indian demand trends closely. These actionable signals matter far more than broad macroeconomic sentiment. Understanding these three forces-industrial demand, geopolitical shocks, and policy shifts-positions you to recognize when silver volatility stems from temporary noise versus structural changes. The next section examines how historical patterns reveal which volatility spikes warrant attention and which ones fade quickly.
How Silver Reacts to Economic Shocks and Policy Shifts
Silver’s historical behavior during economic stress reveals a pattern that most investors miss: the metal amplifies downturns far more than gold does. During the 2008 financial crisis, silver fell roughly 80 percent while gold declined approximately 5 percent, illustrating silver’s vulnerability when risk appetite collapses. This asymmetry stems from silver’s dual nature as both an industrial commodity and a safe-haven asset. When recession fears spike, manufacturers immediately cut production forecasts, crushing industrial silver demand. Simultaneously, investors flee equities for gold, but they often overlook silver because central banks and institutional buyers prioritize gold as a crisis hedge.
This two-pronged pressure creates devastating drawdowns for silver holders who lack diversification.
Silver’s Performance During Recent Market Stress
The 2025 market environment demonstrated this dynamic again when the S&P 500 fell nearly 19 percent at one point during the first half of the year, yet silver remained supported by tariff-driven safe-haven demand and industrial growth expectations. Federal Reserve policy shifts compound this volatility. When the Fed signals rate hikes, the U.S. dollar typically strengthens, pressuring silver prices because international buyers need more currency units to purchase the metal. Conversely, rate cuts weaken the dollar and boost silver as investors seek inflation hedges. JP Morgan Global Research projects that tariff uncertainty and potential Federal Reserve adjustments in 2026 will create quarterly swings, with silver averaging 81 USD per ounce but fluctuating between 75 USD and 85 USD across quarters. This means you cannot rely on smooth uptrends; instead, you should expect sharp pullbacks when Fed officials adopt hawkish rhetoric or when policy shifts stall tariff negotiations.
Why Silver Diverges from Stock Market Moves
Silver’s correlation with equities strengthens during broad risk-off events but weakens during normal market conditions. This inconsistency traps investors who assume a simple hedging relationship. When the stock market corrects 10 percent, silver often falls alongside equities because leveraged investors liquidate positions across asset classes to meet margin calls. However, when central banks signal easy monetary policy or when geopolitical tensions rise, silver can rally while stocks decline, creating genuine diversification benefits.
The practical takeaway is straightforward: silver alone cannot protect your portfolio during systemic shocks. Instead, combine silver with gold, broad commodities, and international stocks to cushion drawdowns without sacrificing long-term upside. Monitoring the gold-to-silver ratio serves as your most reliable valuation signal. When the ratio sits around 65 to 1, silver trades near fair value relative to gold. If the ratio tightens toward 48 to 1 or lower, silver has likely run ahead of fundamentals and faces near-term pullback risk. Conversely, when the ratio widens above 70 to 1, silver becomes attractive on a relative basis.
Using Data to Time Your Exposure
Track the gold-to-silver ratio weekly alongside tariff announcements and Federal Reserve meeting schedules to adjust your exposure. This disciplined, data-driven approach beats emotional reactions to price swings and positions you to capture opportunities when valuations normalize. The next section examines specific strategies that help you manage silver’s volatility without abandoning your long-term allocation to natural resource stocks.
How to Actually Protect Your Silver Holdings
Silver’s volatility demands a three-part approach that most investors either ignore or execute poorly. First, you need exposure to multiple precious metals rather than silver alone, because gold and silver move differently during market stress. When the S&P 500 fell nearly 19 percent in early 2025, silver initially dropped alongside equities, but gold held more stable ground because central banks actively defend gold prices during crises while silver receives no such support. A balanced precious metals allocation maintains gold at roughly 60 percent of your metals exposure, with silver comprising no more than 30 percent, leaving 10 percent for platinum or palladium to capture industrial demand shifts. This structure prevents catastrophic losses when silver crashes 40 percent during recessions while gold declines 10 percent. Beyond metals, broad commodities and international stocks provide genuine diversification that pure precious metals cannot deliver. During the 2025 volatility, investors who held 70 percent equities, 15 percent gold, 10 percent broad commodities, and 5 percent silver weathered drawdowns far better than those concentrated in either asset alone.
Dollar-Cost Averaging Removes Emotion from Silver Purchases
Dollar-cost averaging eliminates the temptation to time silver’s quarterly swings. Instead of deploying capital when silver hits 80 USD per ounce because you believe it represents value, commit to fixed monthly or quarterly purchases regardless of price. A 500 USD monthly allocation into silver ETFs across twelve months captures an average entry point and removes emotion from decisions. This discipline particularly matters given silver’s sensitivity to gold movements; a 5 percent gold decline can trigger 15 percent silver selloffs, creating false urgency to buy or sell.

Monitor the Gold-to-Silver Ratio and Tariff Developments
Establish a monitoring routine around the gold-to-silver ratio, tariff announcements under Section 232 Critical Minerals investigations, and Federal Reserve meeting schedules rather than checking prices daily. When the gold-to-silver ratio sits near 65 to 1, silver trades fairly relative to gold and warrants your standard monthly allocation. If the ratio tightens toward 48 to 1, silver has likely overheated, and you should reduce allocation size or skip months until the ratio widens again. Track London versus New York physical silver spreads, because widening gaps signal tariff concerns that historically precede price corrections. This data-driven framework transforms silver volatility from a threat into a manageable component of a diversified portfolio.
Final Thoughts
Silver market volatility stems from industrial demand that accounts for roughly 60 percent of consumption, geopolitical shocks that drive safe-haven flows, and macroeconomic policy shifts that move currency values. Understanding these dynamics positions you to navigate price swings without panic or emotional decisions. Silver’s smaller market size and sensitivity to gold movements mean quarterly fluctuations between 75 USD and 85 USD per ounce are normal, not warning signs of structural problems.
The long-term outlook for silver remains constructive despite near-term turbulence. Industrial demand from solar panels, semiconductors, and AI data centers continues to grow, while tariff uncertainty and geopolitical tensions support safe-haven demand. JP Morgan Global Research projects silver averaging 81 USD per ounce in 2026, implying meaningful upside from current levels if volatility subsides, though substitution risks in solar manufacturing and the absence of central bank buying support mean silver requires active monitoring rather than passive holding.
Build resilience in your natural resource portfolio by combining silver with gold, broad commodities, and international stocks to cushion drawdowns while capturing long-term appreciation. Dollar-cost averaging removes emotion from quarterly swings, while monitoring the gold-to-silver ratio and tariff developments provides actionable signals for adjusting exposure. Visit Natural Resource Stocks to access expert commentary on how geopolitical and policy impacts shape resource prices and strengthen your natural resource allocation.