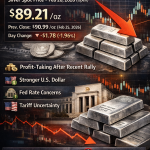


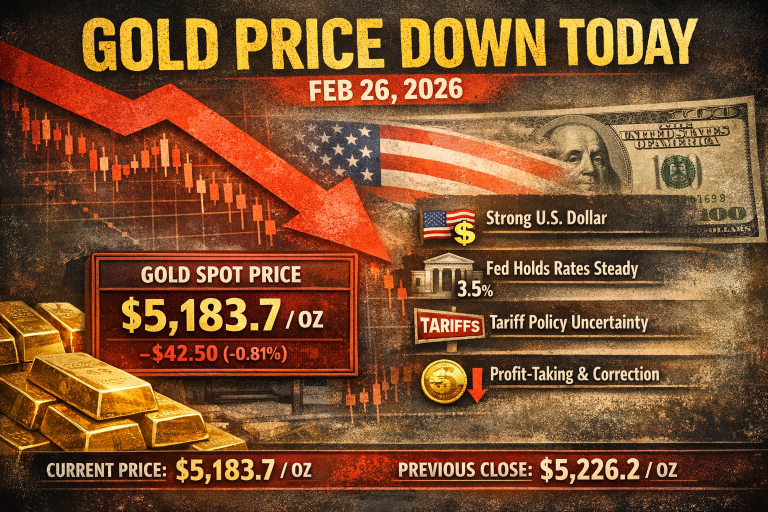
Gold opened at $5,183.7 per ounce on February 26, 2026, sliding from the previous close of $5,226.2 recorded on February 25 — a decline of approximately $42.50 in a single session. If you’ve been tracking the current gold spot price today, February 26, 2026, and wondering what’s causing the pullback, you’re not alone. Precious metals traders and natural resource investors are closely watching a convergence of macroeconomic forces that are putting downward pressure on the gold price in February 2026. Let’s break down each key driver.
Today’s Gold Price Snapshot: February 26, 2026
| Metric | Value |
|---|---|
| Gold Open (Feb 26, 2026) | $5,183.7 / oz |
| Previous Close (Feb 25, 2026) | $5,226.2 / oz |
| Intraday Change | –$42.5 (–0.81%) |
| 52-Week Range | $2,866.3 – $5,626.8 |
The gold spot price per ounce on February 26, 2026, reflects a modest but notable pullback from the highs visited this week. While gold remains significantly elevated on a one-year basis — up over 70% from this time in 2025 — the short-term price action is showing signs of consolidation amid several headwinds converging.
1. Tariff Policy Uncertainty: The Supreme Court Ruling’s Mixed Impact on Gold
One of the biggest stories shaping the gold price drivers in February 2026 is the evolving U.S. tariff landscape. Earlier this month, the U.S. Supreme Court struck down President Donald Trump’s sweeping “reciprocal” tariffs imposed under the International Emergency Economic Powers Act (IEEPA). On the surface, this ruling reduced one layer of geopolitical trade anxiety — and according to analysts at Deutsche Bank, the ruling is only “marginally positive” for gold.
Deutsche Bank’s metals research team, led by Michael Hsueh, explained that the IEEPA tariff removal would have only a “debatable” impact on the broader U.S. fiscal picture. That’s because the White House has already been pursuing alternative legal mechanisms, including temporary Section 122 tariffs, to maintain trade pressure. The bank noted that if Congress-dependent alternatives prove less potent or shorter-lived, the resulting fiscal deficits could be larger than those projected by the Congressional Budget Office, which, in theory, would still support gold as a hedge against dollar weakness and inflation fears.
In other words, today’s gold price dip partly reflects the market pricing in a reduced but not eliminated tariff risk premium. Some safe-haven demand has been unwound as traders interpret the court ruling as a sign of de-escalation — even if only temporary.
2. A Stronger U.S. Dollar Weighing on the Gold Spot Price
The U.S. Dollar Index has strengthened since the nomination of former Federal Reserve Governor Kevin Warsh as the next Fed Chair — a development that rattled precious metals markets earlier in February. Warsh is widely known for advocating a tighter monetary policy. A stronger dollar makes the current gold spot price in February 2026 more expensive for foreign buyers, directly suppressing demand.
Since gold is priced globally in U.S. dollars, any uptick in the greenback’s value creates immediate headwinds for the yellow metal. Today’s softness in gold mirrors this inverse relationship with the dollar — a classic dynamic that plays out whenever dollar confidence picks up, even temporarily.
3. Federal Reserve Rate Cut Expectations Remain Subdued
The Federal Reserve has kept interest rates unchanged at 3.50–3.75%, and as of today, CME Group data shows that nearly 98% of market participants expect rates to hold at the March meeting, with only a 2% probability of a cut. For gold — a non-yielding asset — higher-for-longer interest rates reduce its relative appeal compared to Treasury bonds and other yielding instruments.
Two Fed officials recently signaled no near-term appetite to change interest rate policy, dampening hopes for a rate cut catalyst that would typically push gold higher. With rate cuts off the table in the near term, gold is losing one of its most reliable near-term bullish pillars, contributing to today’s downward price action.
4. Profit-Taking and Technical Correction After an Extraordinary Rally
Context matters: gold hit a record high of approximately $5,626 per ounce earlier in 2026, following a historic bull run that nearly doubled its level at the start of 2025. After such an extraordinary move, profit-taking and technical corrections are not just expected — they’re healthy. Analysts at CMC Markets have described recent gold retreats as a “classic air-pocket” after a crowded trade rather than a structural breakdown.
The gold price rally in the February 2026 precious metals market has been remarkable, but with gold well above all key moving averages, technical indicators suggest overbought conditions. Automated stop-loss triggers and institutional position-squaring have added to the selling pressure, with the gold spot price for February 26, 2026, reflecting this normalization dynamic.
5. CME Margin Requirement Hikes: A Structural Selling Trigger
In late January 2026, as gold approached $5,600/oz, the CME Group increased margin requirements on COMEX gold futures from 6% to 8%. This forced many over-leveraged traders to either inject fresh capital or liquidate positions immediately. The cascading effect of that margin hike is still reverberating through the market in late February, keeping a lid on speculative positioning and adding structural resistance to any sharp near-term recoveries.
This is a critical but often overlooked factor when analyzing today’s gold price in USD per ounce — the mechanics of futures markets can amplify selling during correction phases regardless of underlying fundamentals.
6. Reduced Geopolitical Risk Premium
Gold’s extraordinary rally from mid-2024 through January 2026 was partly fueled by an elevated geopolitical risk premium: tariff wars, U.S.-Iran tensions, U.S. policy uncertainty, and growing concern about the Federal Reserve’s institutional independence. As some of these concerns show signs of temporary resolution — particularly on the trade front following the IEEPA Supreme Court decision — investors are rotating out of defensive gold positions and back into risk assets.
Bank of America noted in a recent research note that investors have been slowing the pace at which they increase their exposure to gold, factoring in a potential period of consolidation heading into spring—though BofA still maintains a bullish long-term view, with a $6,000/oz target over the next 12 months.
7. The Chinese Lunar New Year Liquidity Factor
Chinese speculative money, which has historically been a significant driver of precious metals demand, was largely on the sidelines during the Lunar New Year holiday period (February 16–23, 2026). While Chinese markets have reopened, the resumption of full-scale trading participation has been gradual. Reduced Chinese speculative interest in the immediate post-holiday period has contributed to thinner market conditions, making it easier for sellers to push the gold price per ounce lower in February 2026 amid lower-than-average trading volumes.
What the Analysts Are Saying: Is This a Buying Opportunity?
Despite today’s pullback, the structural bull case for gold in 2026 remains well-supported:
Deutsche Bank analysts wrote following the February sell-off that “gold’s thematic drivers remain positive and we believe investors’ rationale for gold allocations will not have changed.” The bank had previously reiterated a $6,000/oz target, up from a revised $4,450 forecast set in late 2025.
TD Securities’ Bart Melek, one of the most closely watched commodity strategists on Wall Street, maintained that his team “still likes gold here,” with a base case of a $5,000 quarterly average and a technical ceiling around $5,455, with potential upside to $5,700.
JP Morgan analysts projected gold could reach $6,300 per ounce by the end of 2026, citing strong investor demand and ongoing macroeconomic uncertainty. The median gold price forecast for 2026 from a Reuters poll of 30 analysts is $4,746.50 per troy ounce — the highest annual consensus in Reuters polling history going back to 2012.
Key technical support levels to watch are clustered around $5,107–$5,154 on the downside. A sustained move below $4,550 would bring the psychologically critical $4,000 zone into view — but most analysts regard this scenario as unlikely given the structural demand from central banks, which collectively purchased 863 tonnes of gold in 2025 and are forecast to buy approximately 850 tonnes in 2026.
What This Means for Natural Resource Stock Investors
For investors in gold mining equities and natural resource stocks, today’s pullback in the current gold price on February 26, 2026, may present a selective opportunity. Producers with strong balance sheets and low all-in sustaining costs (AISC) below the $2,000/oz level are generating exceptional free cash flow at any price above $5,000/oz — and that picture doesn’t change meaningfully on a $40-per-day dip.
Investors should also watch the silver market, as Deutsche Bank sees silver prices ending the year at elevated levels, driven by industrial demand from AI data centers and solar infrastructure — themes that continue to support the broader precious metals complex even through near-term gold consolidation phases.
Summary: Why Is Gold Moving Down Today, February 26, 2026?
Today’s decline in the gold spot price on February 26, 2026 is driven by a combination of interrelated forces:
- The Supreme Court’s partial easing of tariff risk via the IEEPA ruling reduced the geopolitical safe-haven premium.
- A firmer U.S. dollar and hawkish Federal Reserve signals (Kevin Warsh nomination) are raising the opportunity cost of holding gold.
- Rate cut expectations remain low, removing a key near-term catalyst.
- After an extraordinary 70%+ annual gain, profit-taking and technical corrections are natural and expected.
- CME margin hike mechanics continue to suppress speculative re-leveraging.
- Reduced Chinese liquidity in the post-Lunar New Year period has created thinner, more volatile trading conditions.
Despite these short-term headwinds, the gold price in February 2026 is still trading at historically elevated levels, and the medium- to long-term structural drivers — central bank demand, U.S. fiscal deficits, dollar weakness, and geopolitical uncertainty — remain firmly intact. Most major institutional forecasts still point to gold making new highs by the end of 2026.