


Uranium prices have surged over 400% since 2020, driven by nuclear energy’s comeback as a climate solution. We at Natural Resource Stocks track how supply constraints, geopolitical tensions, and reactor construction shape this volatile market.
Understanding the uranium prices trend requires examining both immediate market forces and long-term structural shifts. This analysis breaks down the dynamics reshaping uranium investment opportunities.
Where Uranium Supply Falls Short of Rising Demand
Uranium demand accelerates faster than production can keep pace. According to the World Nuclear Association, global reactor fuel demand reached approximately 204 million pounds in 2025, while production supplied only about 173 million pounds-a deficit of 31 million pounds that signals structural tightness in the market. This gap persists despite decades of established mining infrastructure, which means the shortfall reflects genuine production constraints rather than temporary disruptions.
Utilities lock in long-term contracts to cover reactor commitments, forcing them to compete aggressively for available supply. This supply-demand imbalance acts as the primary price driver over the next decade, and investors should focus on production bottlenecks rather than speculative sentiment.
Asia’s Nuclear Push Creates Structural Demand
China and India reshape global uranium flows in ways that directly constrain availability for Western markets. China operates 60 reactors and has 38 more under construction, positioning it to become the world’s largest uranium consumer outside the traditional Western-utility base. India signed a landmark deal with Cameco worth approximately C$2.6 billion to supply roughly 22 million pounds over nine years starting in 2027, demonstrating that sovereign demand from non-traditional buyers now competes directly with utilities for contracted supply. Chinese and Indian buyers prioritize long-term contracting over spot purchases, locking in supply before it reaches the open market. These bilateral agreements signal where future supply will flow and which regions face tightening availability. Western utilities face higher prices and longer lead times to secure term contracts, which feeds directly into spot price volatility.
Production Delays and Mining Economics Tighten Supply
New uranium production remains slow to materialize despite rising prices. Denison Mines’ Phoenix project in Saskatchewan became the first fully permitted uranium mine to enter construction in over a decade, with first production targeted for 2028 using in-situ recovery technology. This single data point illustrates the reality: bringing new supply online takes years of permitting, capital deployment, and operational ramp-up. Kazakhstan, which accounts for roughly 14 percent of identified global resources, faces real constraints including sulfuric acid shortages that limit production expansion. Mongolia and New Mexico projects face regulatory delays that push production timelines further into the future. Mining economics also matter-production costs form a price floor because uranium extraction is capital-intensive. Higher ore-processing costs and stricter environmental compliance standards have raised this floor over the past decade, meaning prices cannot fall to 2015-2017 lows without triggering mine closures. Supply cannot respond quickly to price signals, which creates a structural advantage for early movers in contracting and inventory accumulation.
Geopolitical Realignment Redirects Supply Flows
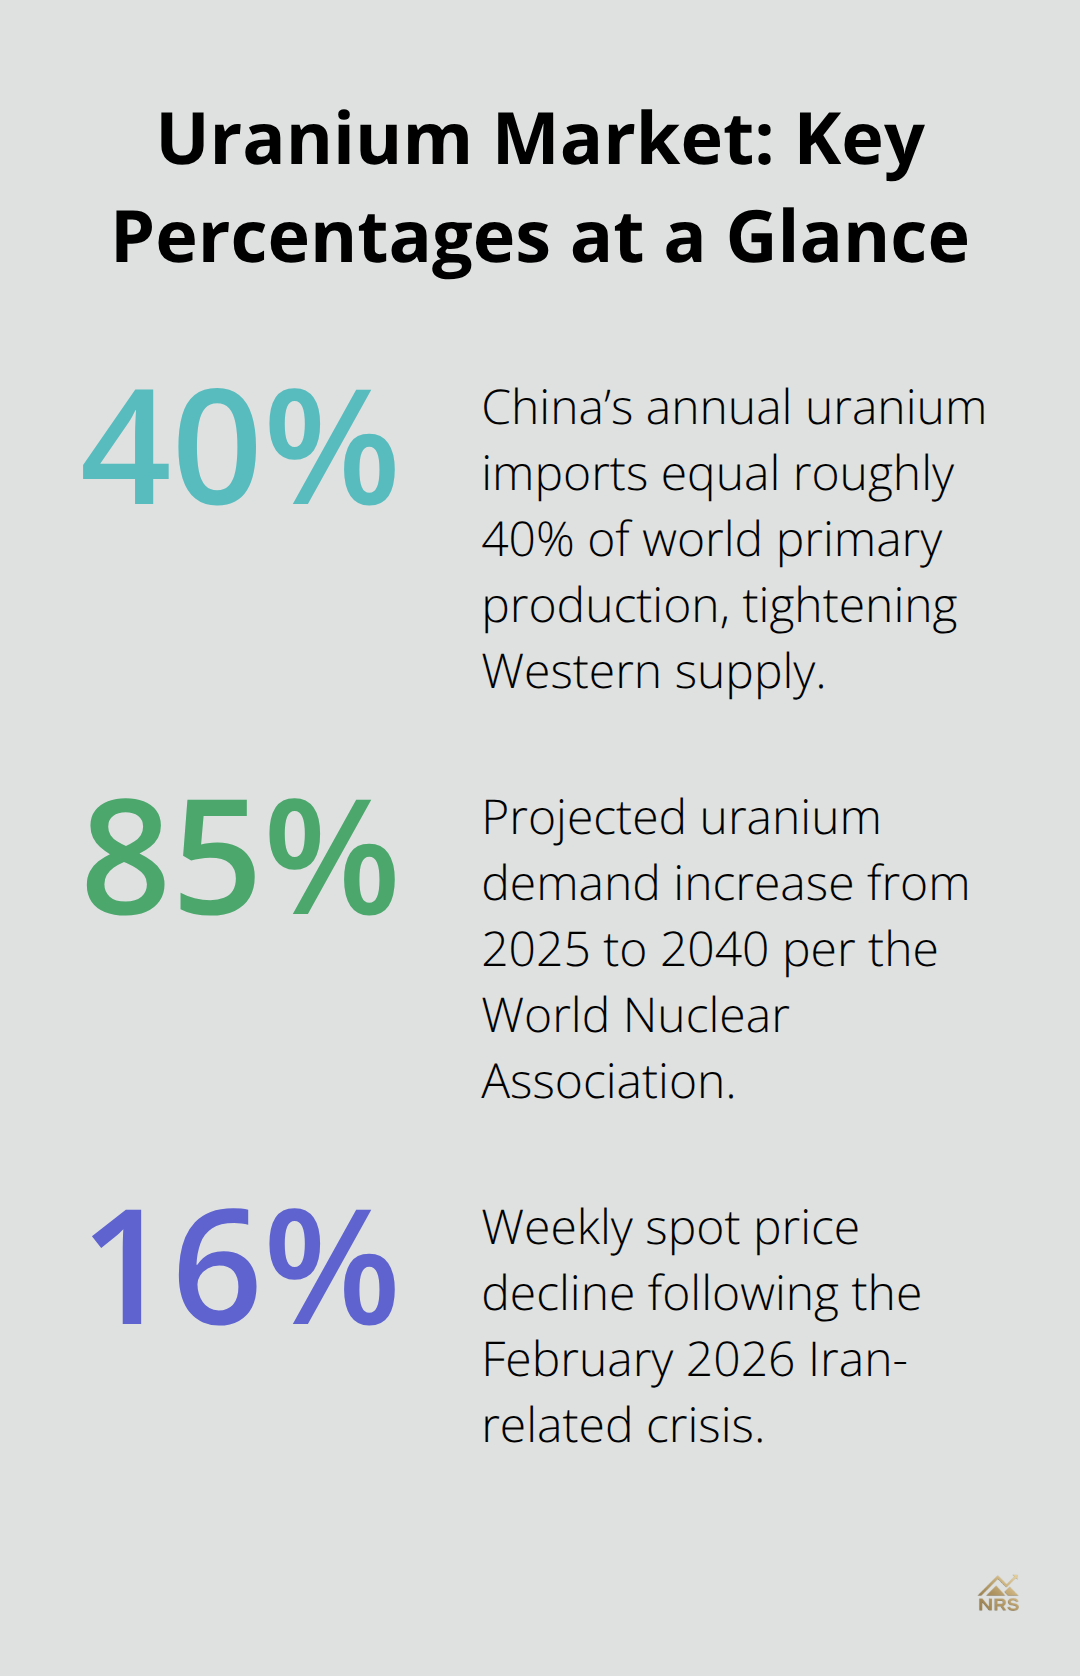
Russia import bans in the US and Europe eliminate a historical supply source and force utilities to source uranium from alternative regions. China absorbs this redirected supply, importing nearly 70 million pounds annually-roughly 40 percent of world primary production. This trade-flow shift means less uranium reaches Western markets at any given price level, tightening availability for North American and European reactors. Kazatomprom, Kazakhstan’s state uranium company, signals long-term supply arrangements with India alongside traditional European and North American customers, fragmenting the supply base and making it harder for any single buyer to secure large volumes. Secondary supplies from recycled uranium, depleted uranium tails, and weapons-derived material once covered meaningful portions of reactor fuel needs, but these sources decline as stockpiles deplete. The International Atomic Energy Agency maintains reserves in Kazakhstan, Russia, and the United States totaling roughly 500 tonnes of low-enriched uranium, but these strategic reserves serve geopolitical rather than market functions. Supply concentration in politically sensitive regions combined with rising demand from Asia creates upward price pressure that persists regardless of short-term spot volatility, setting the stage for how financial investors and utilities will compete for available material in the months ahead.
What Moves Uranium Prices in Real Time
Reactor Schedules and Policy Shifts Create Price Friction
Reactor construction timelines and policy shifts create friction that drives price volatility. The World Nuclear Association projects uranium demand rising from roughly 179 million pounds in 2025 to approximately 330 million pounds by 2040-an 85 percent increase that assumes reactors come online as planned. However, reactor startups rarely follow schedules. Each delayed startup postpones uranium purchases by months or quarters, forcing utilities to adjust contracting timelines and creating temporary supply gluts that suppress spot prices. Accelerated restarts or new construction announcements trigger immediate buying waves because utilities must cover fuel needs years in advance.
Energy policy changes amplify this dynamic significantly. When governments announce nuclear expansion targets or extend reactor operating licenses, utilities immediately increase uncovered requirements-the tonnage they need to contract for over the next five to ten years. The International Energy Agency projects nuclear capacity must double over the next two decades to meet decarbonization targets, but this projection depends on policy commitments materializing into actual construction permits and funding. When policy stalls or changes direction, utilities reduce forward contracting and spot prices weaken temporarily. Climate goals alone do not move prices; only concrete policy backed by capital allocation does.
Utility Contracting Patterns Signal Demand Acceleration
Track announced reactor restarts and new construction permits in your region as leading indicators of utility demand acceleration, not general climate rhetoric. Utilities lock in long-term contracts months or years before reactors start operations, meaning contracting activity precedes actual fuel consumption. When utilities announce large forward purchases, spot prices typically strengthen within weeks as other buyers anticipate tighter availability. Conversely, when utilities delay contracting decisions, spot prices often fall as financial participants exit positions and wait for clearer demand signals. This pattern repeats across market cycles, making utility contracting announcements more reliable price indicators than policy statements alone.
Financial Buyers Now Rival Utilities in Price Impact
Inventory levels and spot market participants determine price direction over weeks and months, independent of long-term supply fundamentals. The Sprott Physical Uranium Trust purchased more than 5 million pounds year-to-date through early 2026, accumulating physical inventory that removed material from the spot market and supported prices during geopolitical weakness. When financial buyers accumulate inventory aggressively, spot prices strengthen even if utility demand remains flat. Conversely, when financial buyers pause accumulation or liquidate positions, spot prices fall sharply despite tight underlying supply.
The spot price hit US$101.41 on January 29, 2026, then dropped 15.91 percent in one week following the Iran-related crisis in February as financial investors exited positions. This 16 percent weekly decline occurred despite the supply deficit persisting unchanged. Utilities using the spot-market carry trade-locking in futures contracts when spot weakens-helped stabilize prices and prevented deeper declines, but this mechanism works only when financial inventory positions remain liquid.
Spot-to-Term Price Spreads Reveal Accumulation Signals
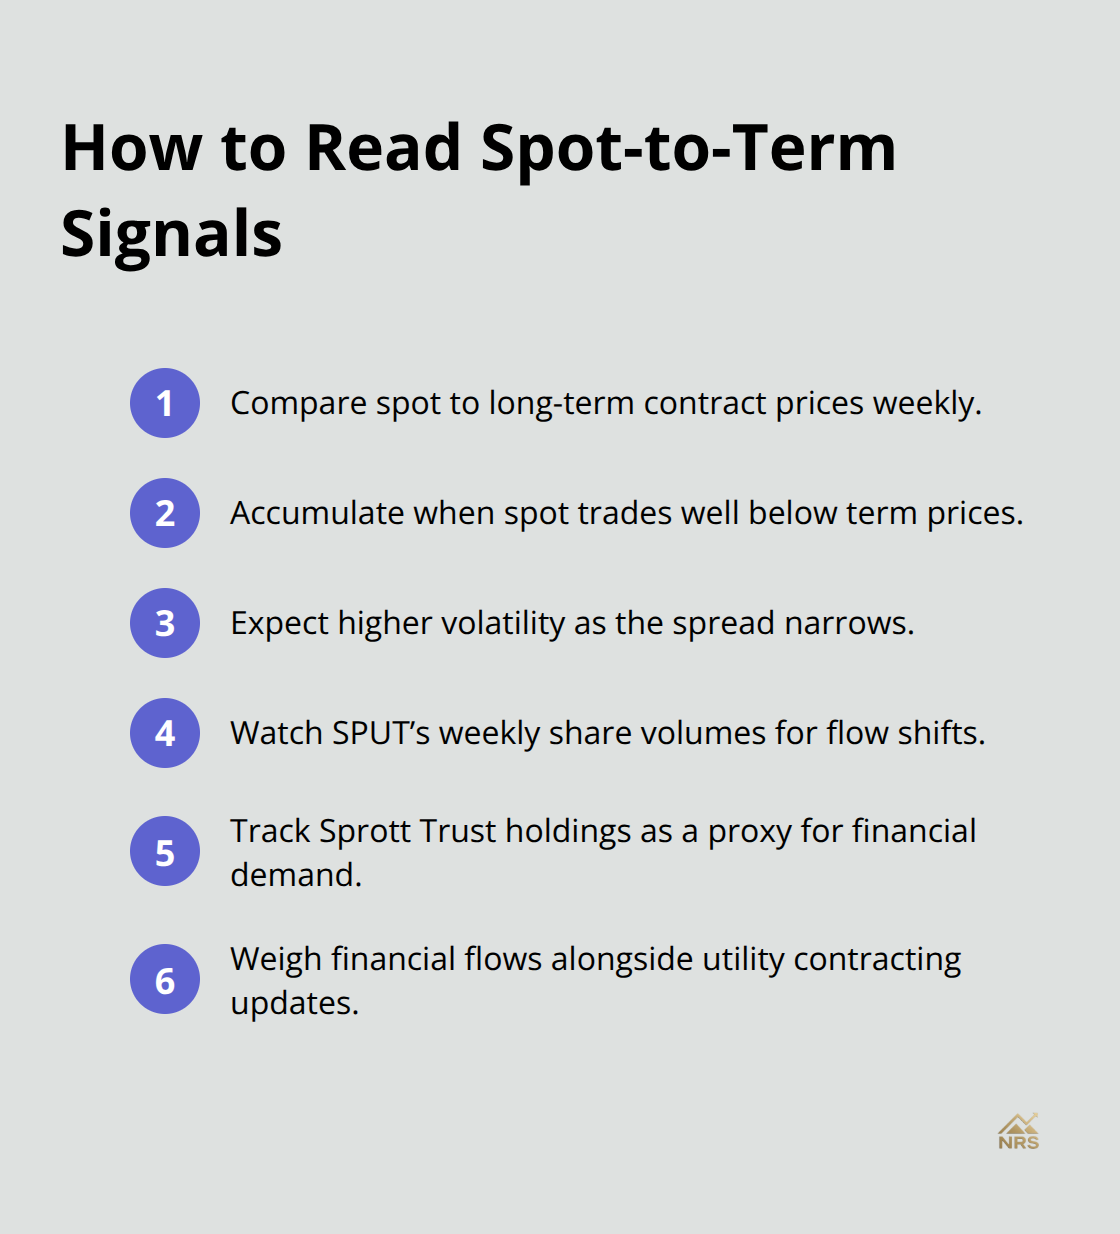
Monitor the weekly spot price relative to the long-term contract price, which stood around US$90 per pound while spot traded near US$83.90 by end of Q1 2026. When spot trades significantly below long-term prices, financial buyers typically accumulate aggressively because the spread offers profit opportunity. When the spread narrows, accumulation slows and spot volatility increases. Track SPUT’s weekly share volumes and Sprott’s published trust holdings as real-time indicators of financial demand, which now rivals utility demand in determining monthly price direction.
Geopolitical tensions reshape resource markets faster than most investors realize, making these financial flows essential metrics for investors monitoring uranium market dynamics.
How Past Price Shocks Shape Today’s Uranium Market
The 2007 Supply Shock and Fukushima’s Demand Collapse
Uranium prices crashed from roughly $140 per pound in 2007 to $20 per pound by 2016-an 86 percent decline that wiped out exploration budgets and halted mine development for years. The 2007 spike originated from a flood at the Cigar Lake mine in Saskatchewan that restricted supply precisely when utilities expected nuclear expansion to accelerate. This single disruption sent prices skyward as buyers feared a prolonged shortage, demonstrating that physical supply disruptions create outsized price reactions regardless of underlying demand fundamentals. The subsequent crash followed the 2011 Fukushima Daiichi disaster, which triggered an immediate policy reversal in Germany, Japan, and other nations that abandoned nuclear expansion plans.
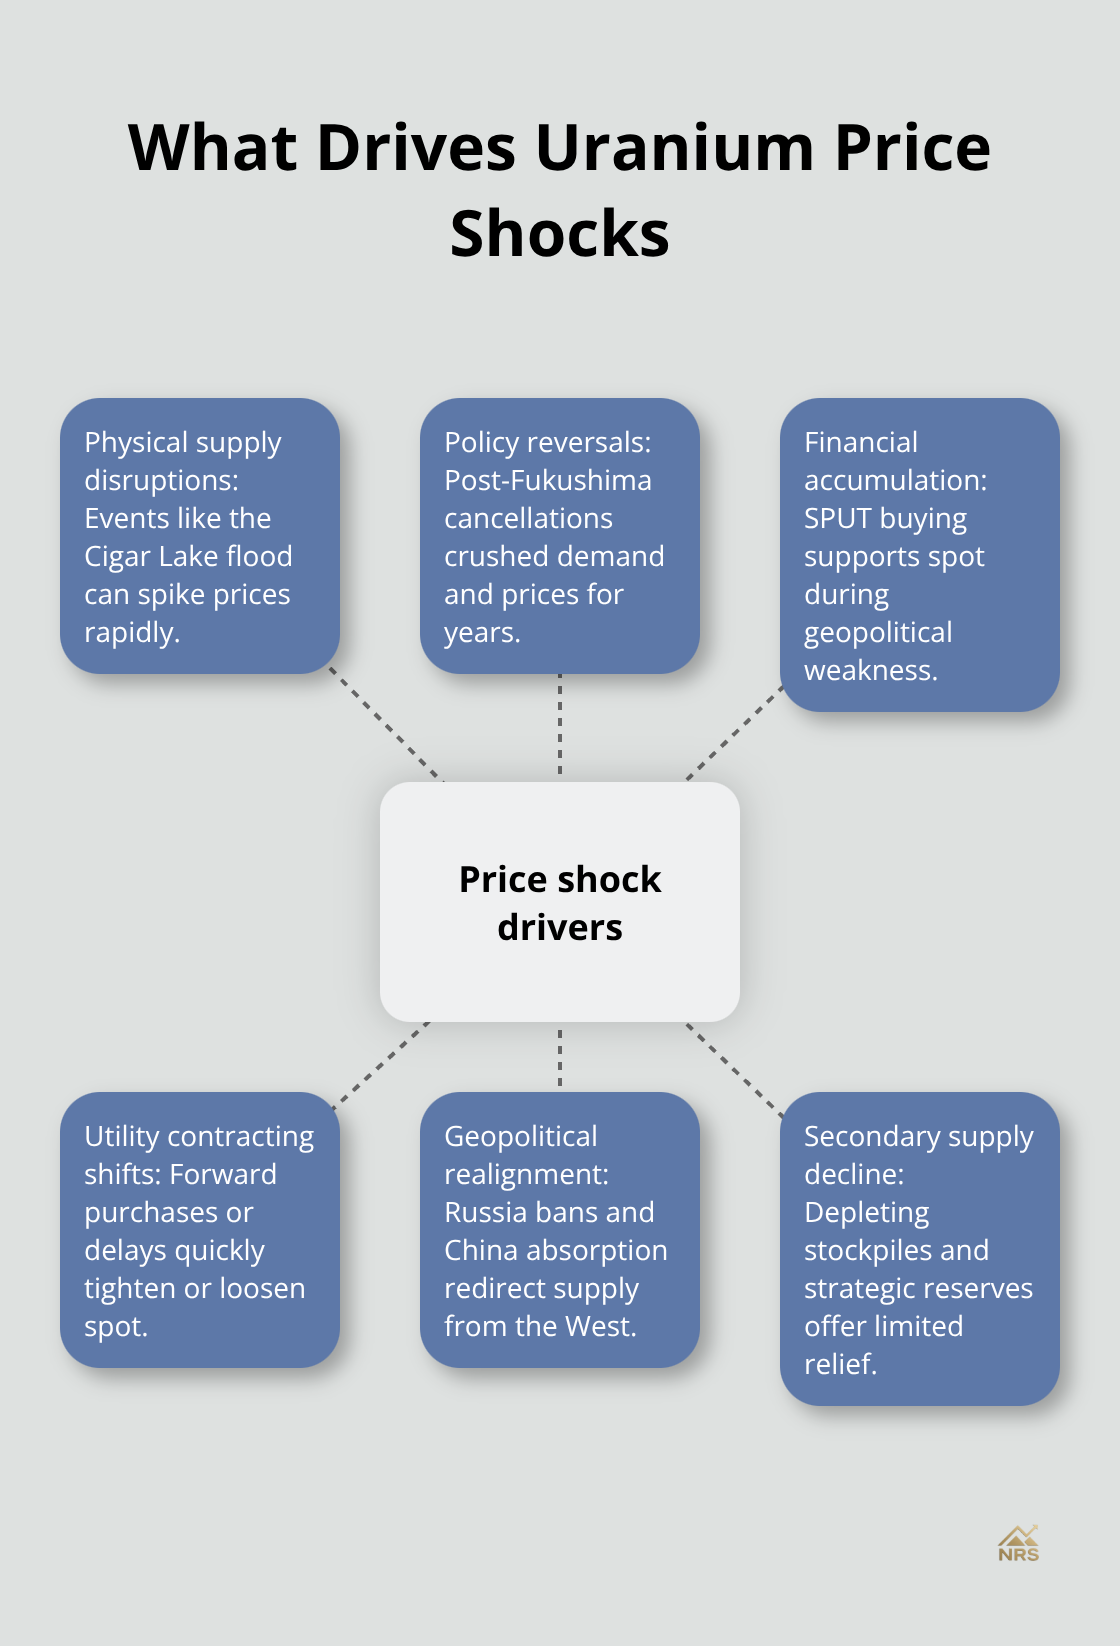
Utilities canceled forward contracts and drew down stockpiles, collapsing spot demand and prices for over a decade.
Why Historical Cycles Fail to Predict Current Market Dynamics
These historical episodes reveal a critical truth: uranium prices respond violently to supply shocks and policy reversals because utilities cannot quickly adjust reactor fuel needs. A mine closure or policy shift that appears temporary creates cascading contract cancellations that suppress prices for years until utilities rebuild confidence in nuclear expansion. The 2026 market operates in a fundamentally different environment than the 2007-2016 cycle because supply constraints now face rising demand rather than declining demand. Utilities learned from Fukushima that nuclear expansion requires decades of policy commitment and that spot price volatility creates unnecessary risk. This psychological shift drives utilities toward long-term contracting regardless of spot price levels, which explains why the supply deficit persists despite spot prices rising from $20 to $83.90 per pound between 2016 and 2026.
Financial Accumulation Reinforces Structural Price Support
Financial buyers like Sprott Physical Uranium Trust accelerated accumulation in early 2026 when geopolitical tension briefly pushed spot prices down, purchasing over 5 million pounds year-to-date and removing material from the market precisely when utilities needed supply. This combination of utility forward contracting plus financial accumulation means spot prices face structural support that did not exist during the 2007-2016 oversupply cycle. The World Nuclear Association projects uranium demand reaching 330 million pounds by 2040 versus 179 million pounds in 2025, requiring new production to nearly double within 15 years. No major uranium mine has entered construction in over a decade except Denison Mines’ Phoenix project in Saskatchewan, targeting 2028 production. This supply lag means price spikes during any supply disruption will prove far more severe than 2007 because production cannot expand quickly to meet demand. Geopolitical shocks, regulatory delays in Kazakhstan or Mongolia, or unexpected mine closures will trigger price rallies exceeding 30 percent within weeks rather than months, as financial buyers and utilities simultaneously compete for available inventory.
Final Thoughts
The uranium prices trend reflects a market fundamentally reshaped by supply constraints meeting rising demand from utilities and financial buyers competing simultaneously for limited inventory. We at Natural Resource Stocks observe that spot prices near US$83.90 per pound mask deeper structural forces: a 31-million-pound annual deficit, Asian buyers absorbing 40 percent of global primary production, and new mine construction delayed by years. Utilities locked into long-term contracting at US$90 per pound demonstrate confidence in nuclear expansion, while financial accumulation by Sprott Physical Uranium Trust removes material from spot markets and anchors prices during geopolitical weakness.
Uranium prices will respond violently to supply disruptions because production cannot expand quickly enough to meet the World Nuclear Association’s projected 85 percent demand increase through 2040. Regulatory delays in Kazakhstan, Mongolia, or New Mexico trigger price spikes exceeding 30 percent within weeks, and reactor construction timelines matter far less than actual contracting activity and financial buyer positioning. Track spot-to-term spreads, SPUT holdings, and utility forward purchase announcements as leading indicators rather than relying on climate policy rhetoric alone.
The long-term outlook remains bullish because supply growth remains constrained while demand accelerates, and Denison Mines’ Phoenix project represents the first major new production in over a decade (targeting 2028 startup). Any geopolitical shock or mine disruption will create sustained price pressure through the 2030s as this supply lag persists. Monitor uranium market dynamics through Natural Resource Stocks, where detailed market insights and real-time data help you track how macroeconomic factors shape resource prices across metals and energy sectors.