
























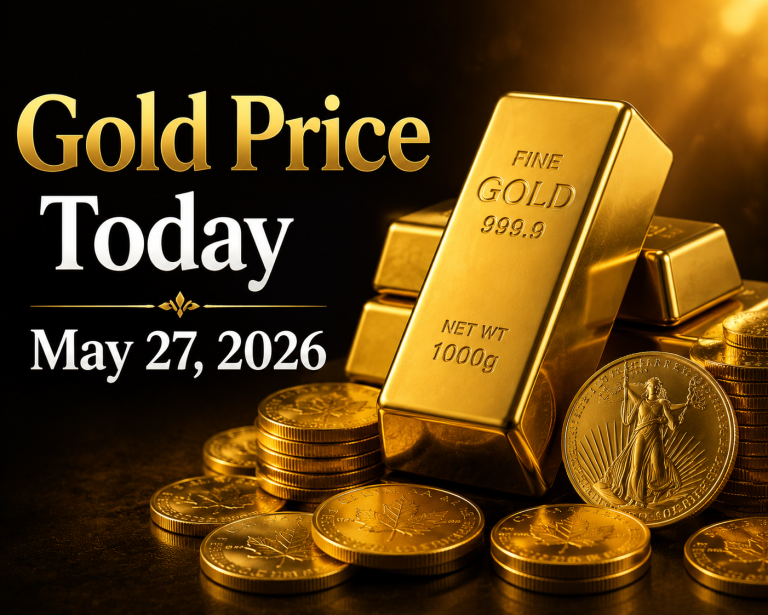
As of May 27, 2026 at 09:15 AM EDT, the live Gold spot price for 1 ounce of Gold in U.S. dollars (USD) is $4,544.85, 1 gram of Gold is $146.12 and 1 kilogram of Gold is $146,120.32. Gold spot price can fluctuate by the second, driven by investment supply and demand, and other factors.
Gold Spot Prices
Gold Price | Price | Change |
Gold Price Per Ounce | $4,544.85 | -$140.45 |
Gold Price Per Gram | $146.12 | -$4.52 |
Gold Price Per Kilo | $146,120.32 | -$4,515.57 |
Live Metal Spot Prices (24 Hours) Last Updated: 05/27/2026 at 11:51 AM EDT
Current Gold Price May 27, 2026: Market Snapshot
The current gold price on May 27, 2026 is firmly in the red, with the metal sliding roughly 3% during the U.S. session. After briefly trading near $4,600 earlier in the week, the gold spot price on May 27, 2026 has retreated sharply, opening at $4,655.40 before sellers pushed it down to an intraday low of $4,515.95. The day’s range of $4,515.95 to $4,670.00 underscores just how volatile trading conditions have become for precious metals.
For investors tracking the gold price May 27, 2026 USD per ounce, the headline figure of $4,544.85 represents a notable pullback from the previous close of $4,685.30. Even so, gold remains up more than 40% over the trailing 12 months, a reminder that today’s weakness sits inside a much larger structural bull market that began well before this spring’s correction.
Here is where the current gold spot price on May 27, 2026 stands across the most-watched units of measure:
- Gold price per ounce: $4,544.85 (-$140.45)
- Gold price per gram: $146.12 (-$4.52)
- Gold price per kilo: $146,120.32 (-$4,515.57)
The 52-week trading range for gold spans an extraordinary $3,235.30 to $5,626.80, illustrating how far and how fast sentiment has swung over the past year.
Why Is the Gold Price Falling Today?
Understanding the gold price drivers in May 2026 requires looking at the chain of macro events that has reshaped the precious metals market this quarter. Several forces are weighing on bullion as of May 27, 2026.
A Firmer U.S. Dollar and Rising Treasury Yields
A stronger U.S. dollar mechanically pressures gold because the metal is priced in dollars, making it more expensive for international buyers. With the U.S. Dollar Index hovering near 99.2 and ticking higher, gold has lost a key tailwind. At the same time, U.S. Treasury yields have climbed sharply, with the 10-year yield jumping to roughly 4.59% and the 30-year yield above 5.1%. Higher real yields raise the opportunity cost of holding a non-yielding asset like gold, which typically encourages rotation into income-bearing securities.
Fading Rate-Cut Expectations
Perhaps the single most important of the gold price drivers in May 2026 is the collapse of Federal Reserve rate-cut expectations. With year-over-year inflation running at 3.8% — the hottest reading since mid-2023 — markets have effectively priced out cuts for the remainder of 2026. The Fed has held its policy rate steady throughout the year, and some traders are now even contemplating the possibility of a rate hike rather than a cut. For a non-yielding asset, a “higher for longer” rate environment is a persistent headwind.
Easing Geopolitical Premium
Gold built much of its early-2026 record run on safe-haven demand tied to the U.S.-Iran conflict and the disruption of shipping through the Strait of Hormuz. In recent sessions, reports that Washington and Tehran are moving closer to an agreement — potentially reopening the strait and easing energy supply fears — have unwound part of that risk premium. As oil prices retreated from elevated levels, the inflation-shock narrative that supported gold has softened, prompting some investors to trim safe-haven positions.
Technical Selling Pressure
The precious metals market is also contending with momentum-driven selling. Gold’s technical posture has turned decidedly bearish in the short term: the 30-minute, hourly, 5-hour and daily readings all flash “Strong Sell,” even as the monthly view remains a “Strong Buy.” The metal has been pressed lower toward — and at times through — the closely watched $4,500 support zone, with the Relative Strength Index sliding into deeply oversold territory during the steepest legs of the decline. When prices break beneath widely followed moving averages, systematic and trend-following funds tend to add to the selling, amplifying intraday moves like the one seen today.
Gold Price Rally 2026: Is the Bull Market Over?
It is worth putting today’s drop in context. Despite the recent weakness, the broader gold price rally of 2026 has not been structurally broken. Gold hit an all-time high near $5,589 in late January 2026 before entering a multi-month correction. A pullback of this magnitude from a record high — with inflation still elevated and central banks continuing to accumulate reserves — is more consistent with a correction inside an ongoing bull market than with a confirmed bear market.
Many institutional forecasters remain constructive on gold for the back half of 2026. Major banks have published year-end targets that still sit well above current levels, generally anchored to the expectation that an eventual Fed pivot and calmer bond markets would reignite upside momentum. Central-bank buying and resilient bar-and-coin demand continue to provide a structural floor beneath the market, even as ETF flows have been choppy. For long-term investors, episodes like the May 27 selloff are often viewed as the kind of volatility that accompanies — rather than ends — a secular uptrend.
That said, traders are watching key support levels closely. A sustained weekly close beneath the multi-month consolidation floor would be the signal that bears have taken firmer control, while holding above it would keep the precious metals market within its broader sideways-to-higher pattern.
Gold Mining Sector in Focus: ESGold–Ocean Partners Deal
Beyond spot pricing, the corporate side of the gold industry continues to generate news that matters for investors in natural resource stocks. This week, ESGold Corp. announced it has signed a definitive gold and silver doré purchase agreement with Ocean Partners, a global metals trading and mine-financing group.
Under the agreement, Ocean Partners will purchase 100% of the gold and silver doré produced from ESGold’s Montauban Gold-Silver Project in Québec, derived from tailings and potential crown pillar material. The deal carries minimum delivery commitments totaling 50,000 ounces of gold and 1,000,000 ounces of silver over its term, with pricing based on prevailing LBMA or COMEX market rates. Crucially, the arrangement also provides ESGold with access to a non-dilutive working capital facility of up to C$9 million, helping fund the company’s transition toward near-term production without diluting existing shareholders.
For natural resource stock investors, deals like this highlight an important theme: even when the gold spot price is volatile, well-positioned developers can de-risk their path to production by locking in offtake and securing financing tied to prevailing market prices. The structure also illustrates how the precious metals market of 2026 — with prices still historically elevated — continues to make previously marginal projects, including tailings reprocessing, economically attractive.
Key Takeaways for Gold Investors on May 27, 2026
- The current gold price on May 27, 2026 is $4,544.85 per ounce, down about 3% on the day.
- The gold spot price on May 27, 2026 has been pressured by a firmer dollar, rising Treasury yields, fading Fed rate-cut hopes, and an easing geopolitical risk premium.
- Short-term technicals are bearish, but the longer-term monthly trend and institutional forecasts remain constructive.
- The gold price rally of 2026 appears to be in a correction phase rather than a confirmed bear market, with central-bank buying providing structural support.
- Corporate activity, such as ESGold’s purchase agreement with Ocean Partners, shows the gold mining sector remains active even amid spot-price volatility.
Frequently Asked Questions
What is the current gold price on May 27, 2026?
The gold price May 27, 2026 current spot rate is $4,544.85 per ounce, $146.12 per gram, and $146,120.32 per kilogram as of 11:51 AM EDT.
Why did the gold spot price per ounce fall on May 27, 2026?
Gold fell primarily on a stronger U.S. dollar, higher Treasury yields, the pricing-out of Fed rate cuts amid 3.8% inflation, and an easing geopolitical premium as U.S.-Iran tensions showed signs of de-escalation.
Is the 2026 gold price decline a bear market?
Most analysts characterize the move as a correction within a longer-term bull market. Gold remains up roughly 40% year-over-year, and central-bank demand continues to provide structural support.
What are the main gold price drivers in May 2026?
The dominant gold price drivers in May 2026 are U.S. dollar strength, real interest rates and Treasury yields, Federal Reserve policy expectations, and the evolving geopolitical situation surrounding Iran and global oil supply.