






















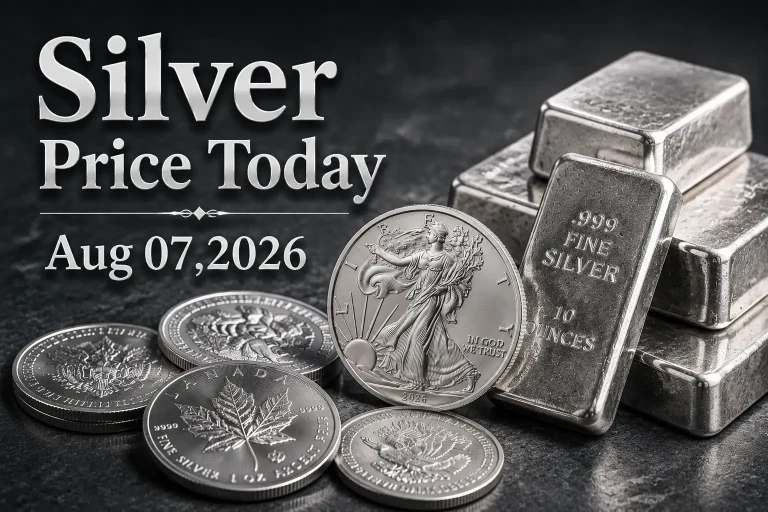
As of Aug 07, 2026, at 5.05 AM EDT, the live Silver spot price for 1 ounce of Silver in U.S. dollars (USD) is $64.53, 1 gram of Silver is $2.07, and 1 kilogram of Silver is $2,074.69. The silver spot price can fluctuate by the second, driven by investment supply and demand and other factors.
Silver Spot Prices
Silver Price | Price | Change |
Silver Price Per Ounce | $64.53 | +$2.08 |
Silver Price Per Gram | $2.07 | +$0.07 |
Silver Price Per Kilo | $2,074.69 | +$66.87 |
Live Metal Spot Prices (24 Hours) Last Updated: 08/07/2026 at 5.05 AM EDT
That works out to a gain of roughly +3.33% against the prior close near $62.45. The current silver spot price Aug 07 2026 puts the metal back within striking distance of the $65 handle after a firm overnight bid in Asian and early European hours.
For context on how quickly this market is moving, compare today’s print with yesterday’s snapshot in our Silver Price Today – Aug 06 2026 update.
Silver Price Aug 07 2026: Quick Reference Table
Investors who buy in physical increments will want the silver price Aug 07 2026 usd per ounce broken out by common trade weights:
Unit | Silver Price (USD) |
1 Troy Ounce | $64.53 |
1 Gram | $2.07 |
1 Kilogram | $2,074.69 |
1 Tola (11.6638 g) | $24.20 |
10 Troy Ounces | $645.30 |
100 Troy Ounces | $6,453.00 |
Note: Spot pricing reflects the unfabricated, wholesale market. Retail bars, rounds and sovereign coins carry a premium above spot. If you are pricing physical metal, see the Buy/Sell Gold & Silver resources on Natural Resource Stocks.
Silver Futures Snapshot – COMEX (SI)
The paper market is where the silver spot price Aug 07 2026 takes most of its direction. Here is where COMEX front-month silver futures stand, per Investing.com’s commodities data:
Metric | Level |
Current Front-Month Indication | ~$64.19 (+4.19%) |
Prior Session Settlement | $61.795 (−$0.493 / −0.79%) |
Prior Session Open | $62.255 |
Prior Session Range | $61.128 – $63.148 |
Prior Session Volume | 34,546 contracts |
52-Week Range | $36.960 – $121.785 |
Exchange | CME / COMEX |
The move from the $61.795 settlement to the current ~$64.19 indication is a +3.88% swing in a single session — a reminder that the 2026 silver market is trading with equity-like volatility, not the sleepy 2%-range days of prior cycles.
Silver Price Drivers Aug 07 2026: What’s Actually Moving the Metal
Below are the six silver price drivers Aug 07 2026 that matter most to positioning today.
1. The U.S. Non-Farm Payrolls Report Is the Session’s Main Event
Markets are effectively frozen ahead of Friday’s U.S. employment release. Consensus looks for 80,000 jobs, a meaningful step up from 57,000 in June, with the unemployment rate holding at 4.2%.
Why silver cares: the print feeds directly into the Federal Reserve’s rate path. A soft number strengthens the case for near-term easing, pushes real yields lower, and removes the opportunity cost of holding a non-yielding metal. A hot number does the reverse and would likely trigger profit-taking into an already extended rally. Because silver carries a higher beta than gold, it tends to move roughly 1.5x to 2x gold’s reaction on the same headline.
2. Treasury Yields Bounced Overnight — A Near-Term Headwind
The rates picture is not uniformly bullish:
- 2-Year Treasury yield: 4.2496% (up ~7 bps overnight)
- 10-Year Treasury yield: 4.6757% (up ~5 bps overnight)
Higher nominal yields at the front end usually cap precious metals. The fact that silver is up more than 3% despite this backup in yields tells you the bid is coming from somewhere other than the rates channel — namely safe-haven flow and industrial-scarcity positioning.
3. Middle East Risk Premium Is Back
Geopolitical escalation is providing direct safe-haven support. Houthi attacks on Saudi Arabia and the threat of action from Iran-backed militias have lifted both crude oil and Treasury yields. Separately, Iran is reviewing restrictions on U.S. and Israeli vessel transit through the Strait of Hormuz — a chokepoint through which a material share of seaborne energy moves.
For silver, the risk premium works twice: once as a monetary haven alongside gold, and again through the energy-cost channel, since mining and refining are energy-intensive. Our Copper & Nickel market drivers for August 7, 2026 cover how the same shock is filtering through the base-metals complex.
4. The Dollar Is Steady, Not Strong
The U.S. Dollar Index held broadly steady across the Asian session after an overnight bounce. The dollar traded at 158.51 yen, having gained 0.4% overnight and broken above its 200-day average near 158.
A stable-to-firm dollar would normally be a drag. Silver rallying through it is a genuine sign of underlying demand rather than a pure currency-mechanics move — one of the more constructive signals in today’s tape.
5. Gold Is Confirming, and the Gold-Silver Ratio Is Compressing
Metal | Price | Change |
Spot Gold | $4,243/oz | +0.1% |
Gold Futures | $4,350.65 | +1.19% |
Spot Silver | $64.53/oz | +3.33% |
Silver Futures | ~$64.19 | +4.19% |
At $4,243 gold and $64.53 silver, the gold-silver ratio sits near 65.8:1 — well below the ~80:1 long-run average of the last decade. Silver is outperforming gold roughly 30-to-1 on the day. Ratio compression of this kind is the classic signature of a silver price rally 2026 Aug precious metals market regime, where speculative and industrial demand pull the junior metal harder than the senior one.
Track the other half of the trade in our Gold Price Today – Aug 06 2026 report.
6. Silver Equities Face Their Own Test
The equity complex is being repriced alongside the metal. Wheaton Precious Metals, one of the largest streaming names with heavy silver exposure, heads into earnings with:
- 2026 attributable production guidance: 860,000 – 940,000 gold-equivalent ounces (a projected +30% year-over-year increase)
- Gross margin: 85.81%
- Q2 consensus: $1.17 adjusted EPS on $901.35 million revenue
- Estimate revisions: EPS estimates cut 9.55% and revenue estimates cut 9.5% over the trailing 60 days
The estimate cuts against a rising spot price create an unusual setup: analyst models may be lagging the tape. Because streaming economics are levered to spot, a sustained silver price Aug 07 2026 current level above $60 would flow through to margins with very little cost inflation offsetting it. Explore related names in our Company Spotlights, including Silver 47.
Technical Outlook: Silver Spot Price Per Ounce Aug 07 2026
Silver has been coiling in a roughly $2.50-wide range and is now testing the top of it. Key levels on the 5-hour chart:
Level Type | Price | Significance |
Breakout Target 2 | $72.28 | Extended measured move |
Breakout Target 1 | $68.20 | Primary upside objective |
Resistance 2 | $63.94 | Secondary supply zone |
Resistance 1 | $63.15 | Critical breakout trigger |
Upper Bollinger Band | $62.29 | Pierced to the upside |
Support 1 (SMA 200) | $60.94 | Bullish structural support |
Support 2 | $60.50 | Range floor |
Downside Target 1 | $59.32 | First failure objective |
Downside Target 2 | $58.17 | Secondary failure objective |
Double-Bottom Base | $55.00 | Pattern origin |
Momentum: RSI is at 73.2, firmly in overbought territory. ATR sits at 0.96, confirming elevated volatility — position sizing should reflect roughly a dollar of average daily true range.
The read: Price has now cleared the $63.15 trigger and is trading above the upper Bollinger Band, which validates the breakout from the $61.00–$63.00 chop range and activates the $68.20 objective. The completed double bottom at $55 remains the structural pattern underpinning the advance. The counterargument is equally clear: an RSI above 73 with price extended beyond the upper band is textbook mean-reversion risk. A failure back inside $63.15 would be the first tell that this is a false breakout.
Trade setups published around this structure carry risk/reward ratios ranging from 1.5 to 7.9, with the most favorable coming from pullback entries near the $60.94 SMA 200 rather than chasing strength. As the technical note put it: resist chasing late after explosive moves — wait for price to retest value zones or show a clear, volume-supported breakout.
Silver Price Rally 2026: Aug Precious Metals Market Context
The 52-week range of $36.96 to $121.785 tells the whole story of the 2026 precious metals market. Silver has traded across a band wider than its own current price. That kind of dispersion is not normal for a commodity — it reflects three overlapping forces:
- A structural supply deficit. Above-ground inventories at major vaults have been drawn down through consecutive deficit years, leaving the physical market thin and prone to squeezes.
- Industrial demand that no longer flexes with price. Solar photovoltaics, electric vehicle electronics, grid infrastructure and AI data-centre power hardware all consume silver in applications where it is difficult to substitute and where the metal is a small share of bill-of-materials cost. Demand is therefore price-inelastic.
- A monetary bid. With the Fed’s path uncertain, real yields volatile and geopolitical risk elevated, investment demand is re-engaging on top of an already tight industrial base.
The practical consequence is that the current silver price Aug 07 2026 is being set by a market where a modest shift in investment flow can move price disproportionately, because the industrial floor absorbs supply regardless. That is the mechanical explanation for why silver keeps outrunning gold on up-days.
For the broader resource-sector picture, see our Daily Mining Update – Gold, Copper & Nickel News and the Platinum and Palladium drivers for August 7, 2026.
What to Watch Next
Time (EDT) | Event | Silver Implication |
8:30 AM | U.S. Non-Farm Payrolls (cons. 80K) | Miss = bullish; beat = profit-taking risk |
8:30 AM | U.S. Unemployment Rate (cons. 4.2%) | An uptick reinforces the easing case |
Intraday | $63.15 retest | Holding above confirms the breakout |
Intraday | $60.94 SMA 200 | Loss of this level invalidates the bull structure |
Ongoing | Strait of Hormuz headlines | Escalation adds risk premium |
Ongoing | Wheaton Precious Metals results | Read-through for streaming and miner margins |
Frequently Asked Questions
What is the current silver spot price Aug 07 2026?
As of 5.05 AM EDT on August 07, 2026, the silver spot price is $64.53 per troy ounce, up $2.08 (+3.33%) on the session. Per gram, silver is $2.07, and per kilogram it is $2,074.69.
What is the silver price Aug 07 2026 usd per ounce for physical buyers?
Spot is $64.53 per ounce, but physical buyers pay a premium above spot for fabrication, distribution and dealer margin. Premiums vary by product — generic rounds and bars price closest to spot, while sovereign coins such as Silver Eagles and Maples carry the widest markups.
Why did the silver price move today?
The dominant silver price drivers Aug 07 2026 are anticipation of the U.S. non-farm payrolls report and its implications for Fed policy, an elevated Middle East risk premium from Houthi attacks and Strait of Hormuz transit threats, and a technical breakout above the $63.15 resistance level. Higher Treasury yields are the main offsetting headwind.
Is the 2026 silver rally sustainable?
The silver price rally 2026 Aug precious metals market is supported by a genuine structural deficit and price-inelastic industrial demand, which argues for a durable floor. Near term, however, an RSI of 73.2 and price extended above the upper Bollinger Band signal overbought conditions and real mean-reversion risk. The distinction matters: structural support does not prevent sharp interim corrections.
What is the gold-silver ratio right now?
With gold at $4,243 and the silver spot price per ounce Aug 07 2026 at $64.53, the ratio is approximately 65.8:1 — historically low, and consistent with silver outperforming gold during the current phase.
What levels should I watch on silver today?
Immediate resistance is $63.15 (now being tested as support after the break), then $63.94, with an upside objective at $68.20 and an extended target at $72.28. Structural support sits at the $60.94 200-period SMA, then $60.50, with downside objectives at $59.32 and $58.17.
Where can I track the silver price daily?
Natural Resource Stocks publishes daily spot updates across gold, silver, platinum, palladium, copper and nickel. See our live Metal Charts and daily price coverage.
Bottom Line
The silver price Aug 07 2026 current reading of $64.53 per ounce (+$2.08) reflects a market that has broken out of a multi-week $61–$63 range on safe-haven flow and a compressing gold-silver ratio, and has done so while yields and the dollar were rising — a genuinely constructive combination. The immediate risk is the 8:30 AM payrolls print, which will either validate the easing narrative that supports non-yielding metals or trigger a fast unwind from overbought territory. Structurally, the supply deficit and inelastic industrial demand argue that dips toward the $60.94 SMA 200 remain the higher-probability entry zone.
Related Reading on Natural Resource Stocks
- Silver Price Today – Aug 06 2026
- Gold Price Today – Aug 06 2026
- Why Platinum and Palladium Prices Are Moving Today – Key Market Drivers, August 7, 2026
- Why Copper and Nickel Prices Are Moving Today – Key Market Drivers, August 7, 2026
- Daily Mining Update: Gold, Copper & Nickel News
- Uranium Mining Opportunities: Where New Projects Are Rising