























Gold has moved from $2,063 per ounce in January 2026 to over $2,400 by August. Understanding this gold price trajectory matters for anyone holding natural resource stocks.
At Natural Resource Stocks, we track the forces reshaping gold markets. Interest rates, central bank buying, and geopolitical tensions all push prices higher or lower. This guide shows you what’s driving gold now and where prices may head through 2027.
How Gold Prices Responded to Past Crises and Market Shocks
The 2008 Financial Crisis and the Path to $1,825
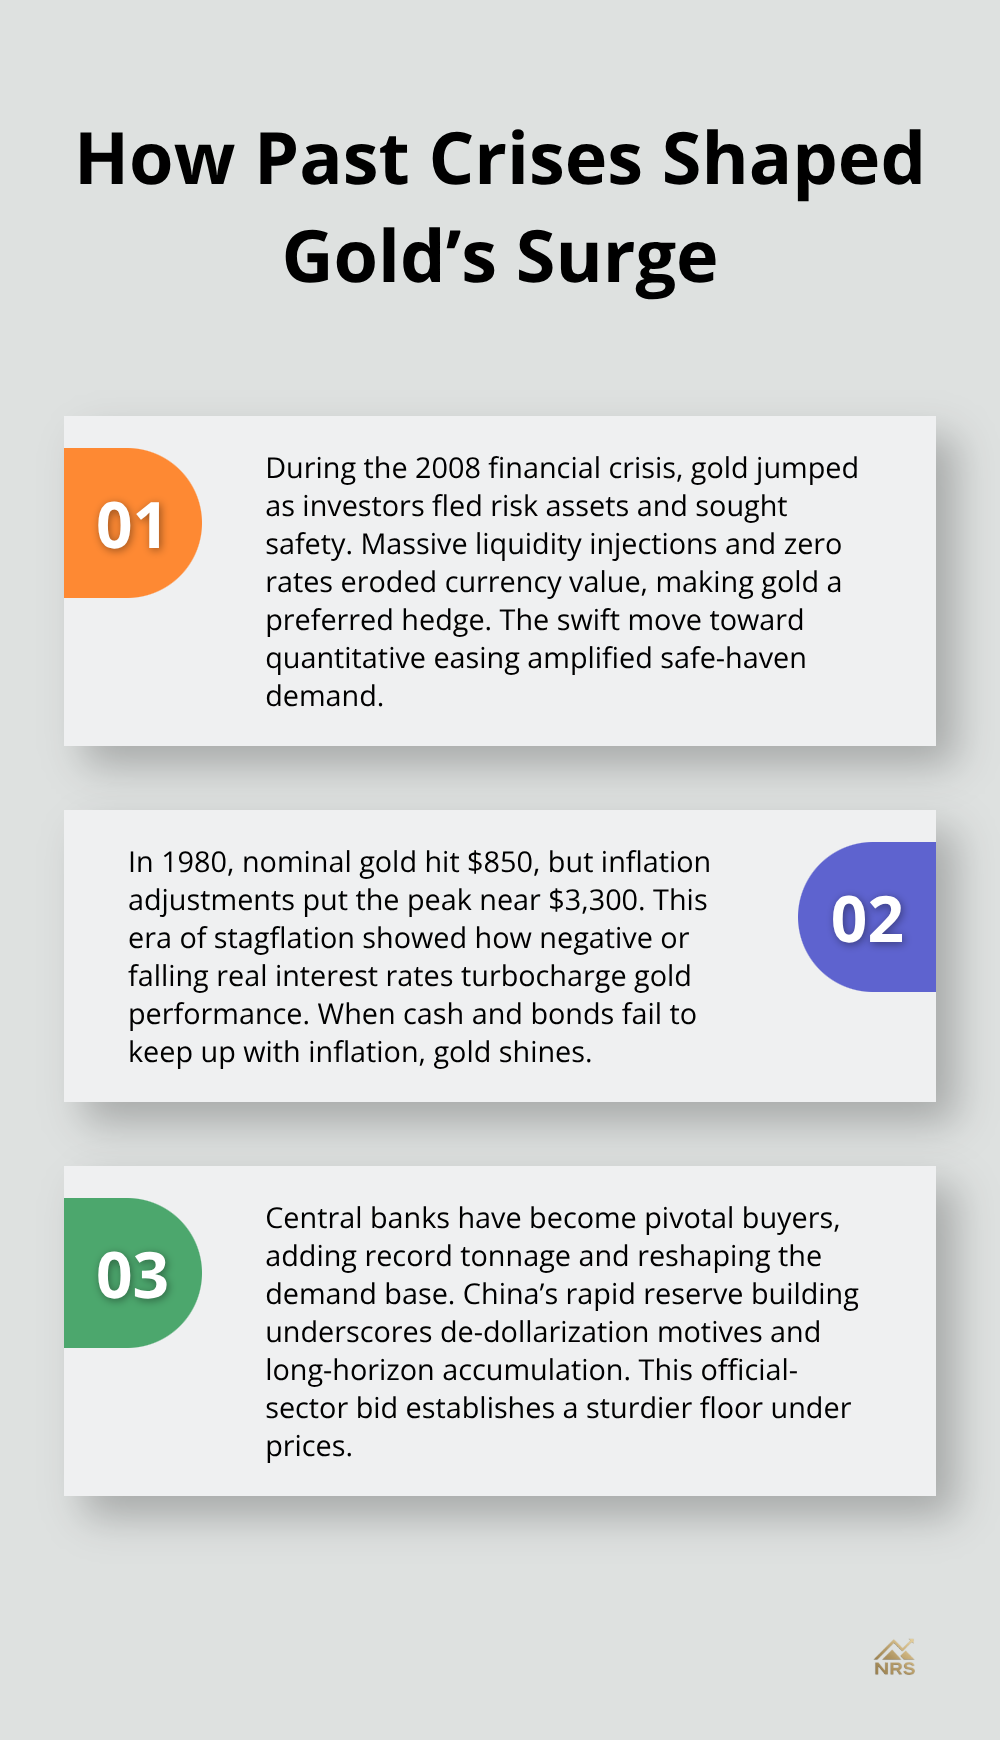
Gold traded around $730 per ounce as the financial crisis unfolded in 2008. Within three years, it climbed to $1,825-a 150% gain as investors fled equities and bonds. Central banks flooded markets with liquidity, eroding currency value and pushing investors toward hard assets. The Federal Reserve cut rates to near zero and launched quantitative easing, making gold the obvious hedge against currency debasement.
Stagflation and the Inflation-Adjusted Peak
January 1980 marked an inflation-adjusted peak of roughly $3,300 per ounce during stagflation, when both inflation and unemployment spiked simultaneously. Nominal prices reached $850 that year, but adjusted for inflation the figure was far higher. The pattern is clear: gold performs best when real interest rates fall or turn negative, meaning the return from bonds or savings accounts fails to match inflation. Today’s environment mirrors aspects of both periods.
Central Bank Demand Reshapes the Market
The World Gold Council reports that central bank gold purchases added 1,037 tonnes in 2023, the second highest annual total in history. This buying accelerated in 2026, with China’s net imports hitting 317 tonnes in Q1 alone-nearly triple the prior quarter. China’s strategy is explicit: build gold reserves to support the renminbi as a credible reserve currency and reduce reliance on dollar-denominated assets. This de-dollarization trend matters because it underpins a structural floor for gold prices over the next several years, not just a cyclical bounce.
Geopolitical Tension and Supply Constraints
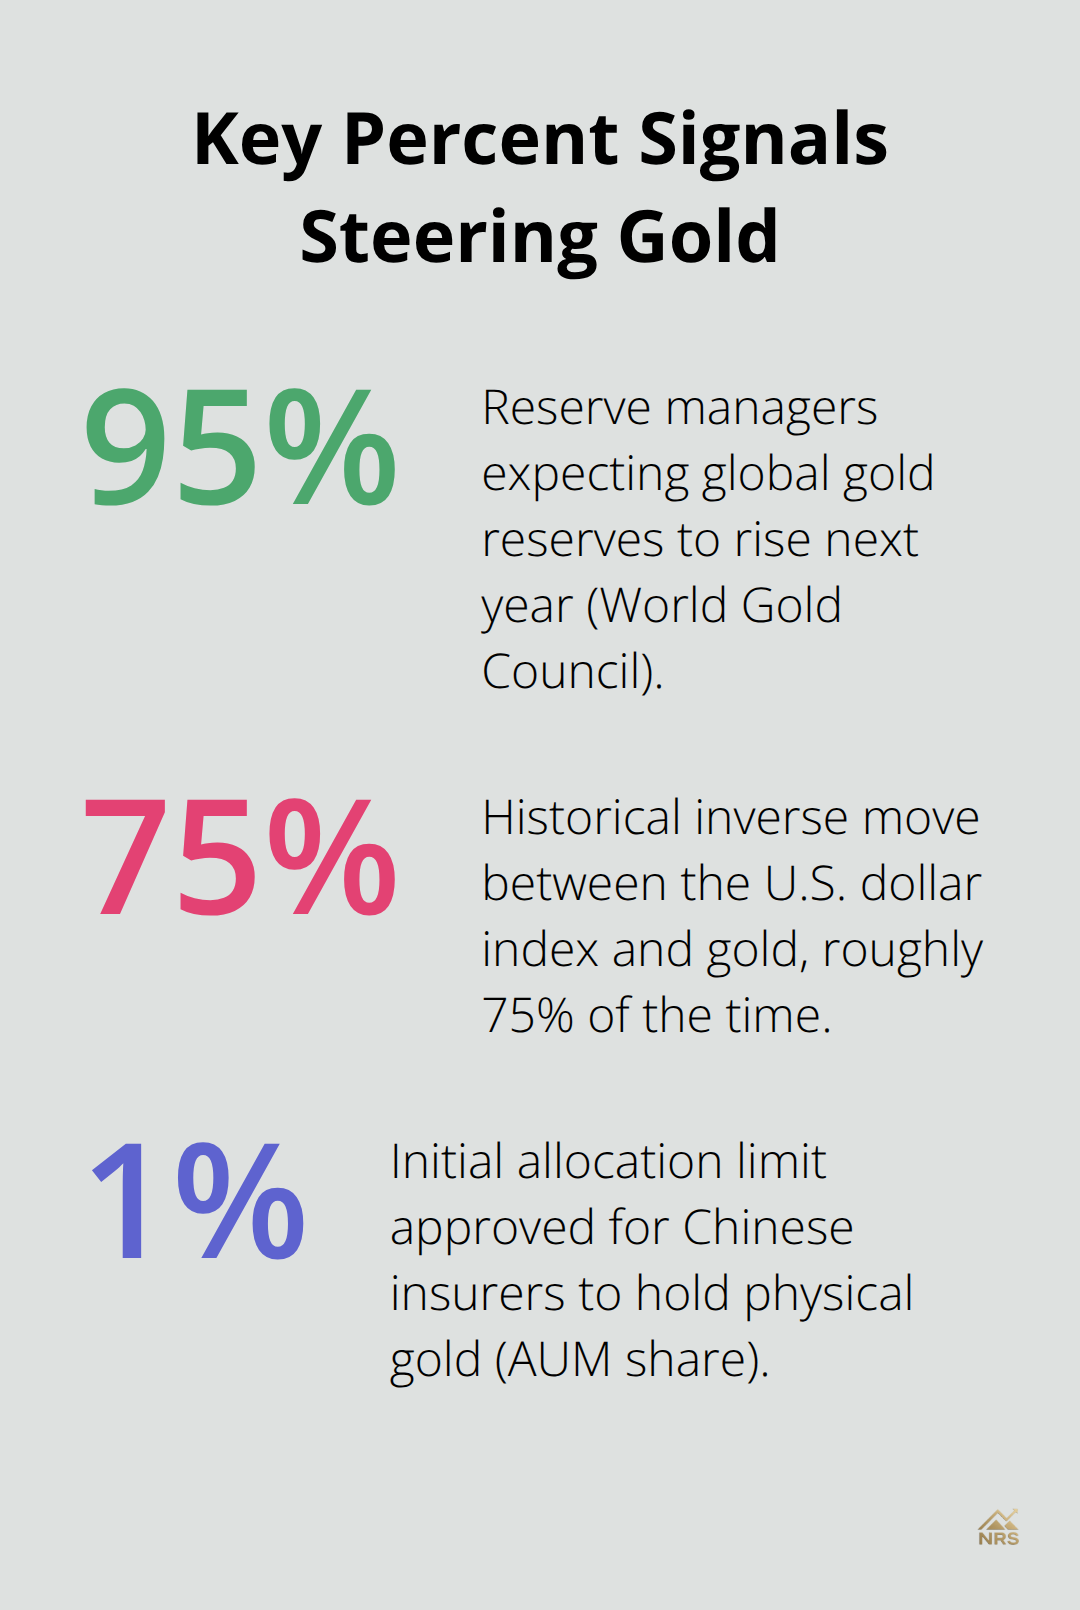
Geopolitical tension consistently triggers gold demand spikes. During the 1973 oil embargo, gold prices surged as investors sought safety from economic disruption. More recently, tensions between Iran and Israel, combined with sanctions risks, have kept gold bid. Conflict raises uncertainty about energy supplies, inflation expectations rise, and investors rotate into gold. Central bank reserve diversification amplifies this effect-95% of reserve managers surveyed by the World Gold Council expect global gold reserves to rise next year, signaling sustained official-sector demand regardless of short-term price moves.
Supply constraints tighten the market further. Global mine production grows only 2–3% annually, and higher costs plus stricter environmental regulations slow supply growth even more. This mismatch between slowing supply and accelerating central bank demand creates upward price pressure. For natural resource stock investors, this dynamic directly benefits gold mining companies, as higher gold prices expand profit margins without requiring new discoveries or production increases.
Structural Forces Shape the Path Ahead
Gold’s trajectory to 2027 won’t depend solely on interest rate cuts or Fed policy shifts. Structural forces-reserve diversification, persistent fiscal deficits, and constrained supply-reshape the market fundamentally. These forces take years to play out, but they create a rising floor beneath prices even during temporary pullbacks. With these long-term drivers in place, the question shifts from whether gold will rise to how quickly central banks and other official-sector buyers will accumulate reserves in the months ahead.
What Drives Gold Prices Right Now
The Federal Reserve’s Rate Policy Sets the Tone
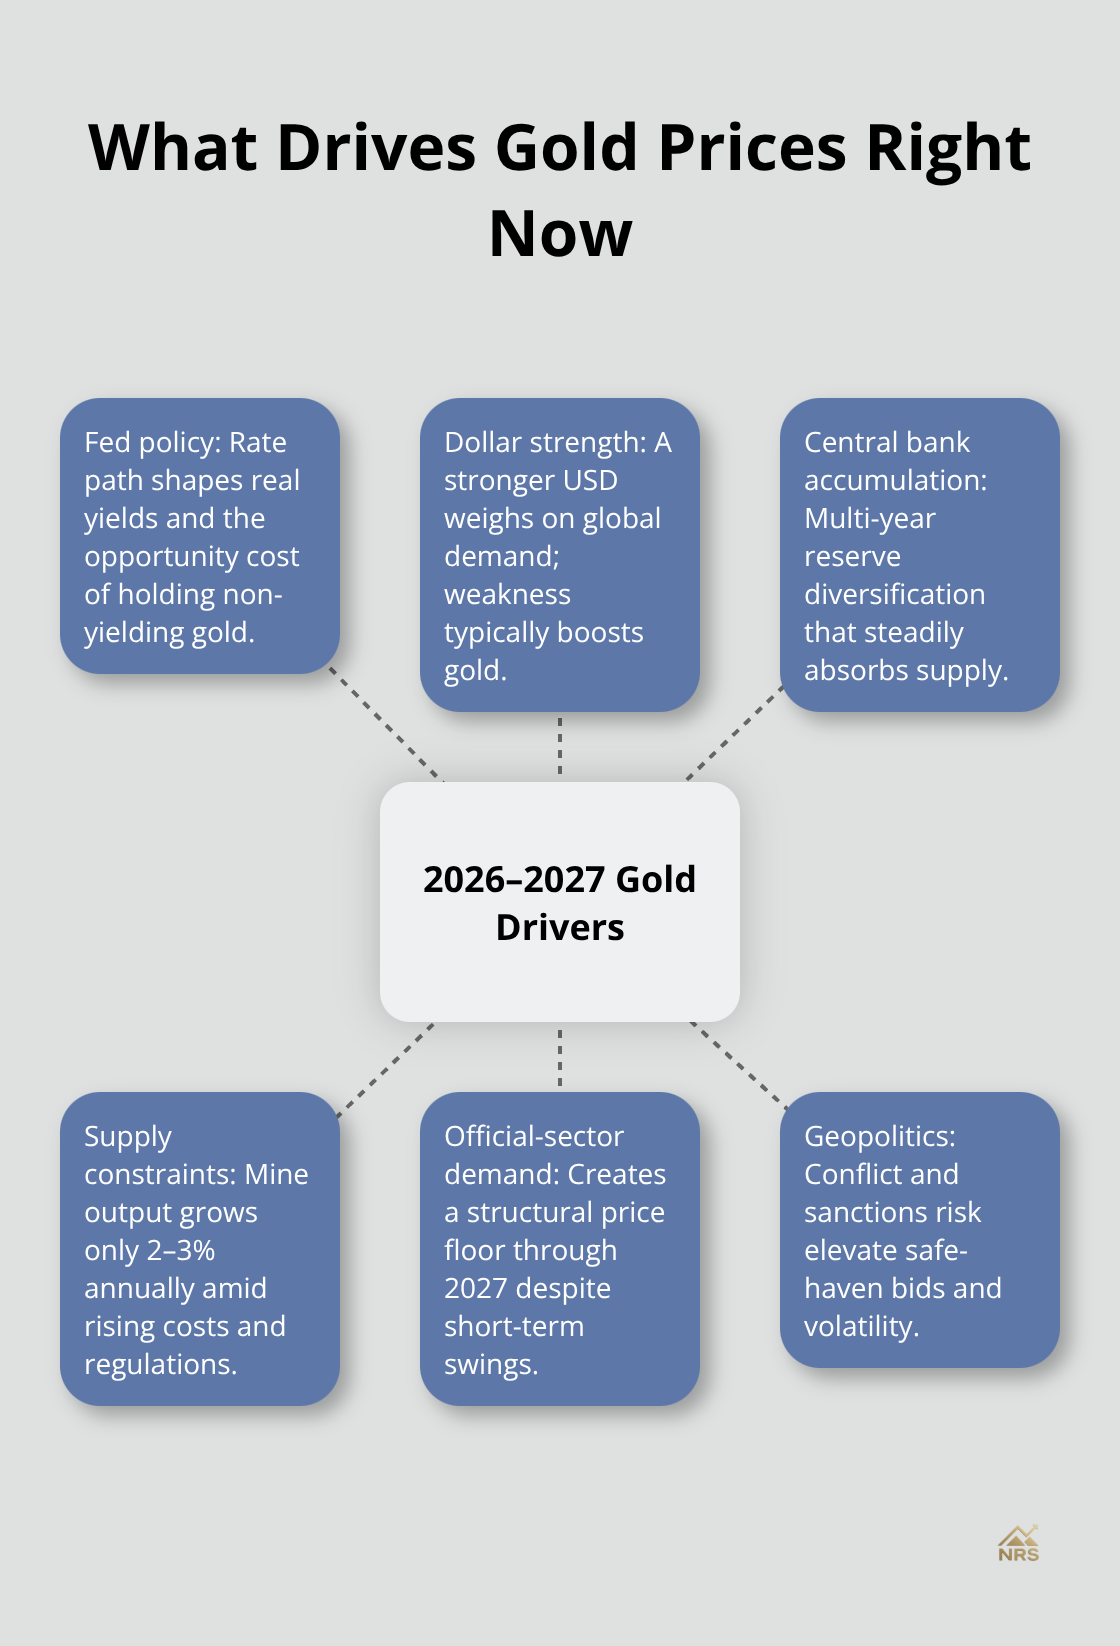
The Federal Reserve’s policy stance in 2026 remains the primary lever controlling gold’s near-term direction. The Fed has held rates steady while inflation persists, creating an environment where real interest rates hover near zero or slightly negative. This matters enormously: gold is seen as a hedge against inflation, and higher rates increase the opportunity cost of holding the non-yielding metal. JP Morgan Global Research projects gold averaging around $6,000 per ounce by Q4 2026, contingent on the Fed maintaining accommodative policy. If the Fed tightens unexpectedly, real yields could spike, triggering ETF outflows and pulling prices lower. Watch the Fed’s inflation commentary closely-any shift toward “higher for longer” rates would pressure gold despite geopolitical tailwinds.
Currency Strength Works Against Gold
A stronger U.S. dollar makes gold more expensive for foreign buyers and dampens demand. Conversely, a weaker dollar turbocharges gold as international investors pile in. The dollar index and gold move inversely roughly 75% of the time, so monitoring dollar weakness becomes actionable intelligence for timing entries into gold positions or mining stocks. This inverse relationship holds across most market cycles, making currency movements one of the most reliable signals for gold traders.
Central Banks Reshape the Structural Equation
Central bank accumulation has shifted the entire structural equation for gold in 2026. China imported 317 tonnes of gold in Q1 alone-nearly triple the prior quarter-as the People’s Bank of China explicitly builds reserves to support the renminbi’s credibility and reduce dollar dependence. This isn’t cyclical buying; it’s a multi-year reserve diversification strategy. The World Gold Council reports that central banks purchased 863 tonnes in 2025, and 95% of reserve managers expect global gold reserves to rise further. Chinese insurers have received approval to allocate up to 1% of assets under management to physical gold, representing roughly 200 tonnes with potential to expand to 5% over time.
Official-Sector Demand Creates a Price Floor
This official-sector demand creates a structural price floor that persists regardless of short-term Fed moves or equity market rallies. Gold won’t crater even if inflation fears ease temporarily-reserve diversification will continue absorbing supply. The mismatch between slowing mine production growth (2–3% annually) and accelerating central bank demand tightens the market further, supporting prices through 2027 and beyond. These dynamics mean that investors holding natural resource stocks tied to gold production benefit from both price appreciation and the structural tailwinds that central bank buying provides.
With these forces in place, the question shifts from whether gold will rise to how quickly central banks and other official-sector buyers will accumulate reserves in the months ahead-and what specific price targets analysts project for 2027.
Where Gold Heads by End-2027
Institutional Forecasts Point to $6,000–$6,300 Range
J.P. Morgan Global Research analysts expect gold to push $6,000 per ounce by year end, with $6,300 a possibility for 2027, assuming the Federal Reserve maintains accommodative policy through the period. Bank of America’s extreme-demand scenario pushes even higher, while Goldman Sachs takes a more conservative stance with mid-$5,000s as their base case for 2027. These projections reflect how major institutional investors position portfolios, not theoretical guesses. The divergence matters because it shows the range of outcomes tied to Fed policy, geopolitical escalation, and central bank buying intensity. If real yields rise due to unexpected Fed tightening, gold could underperform these forecasts. If energy prices spike from Iran-Israel tensions or other conflicts, gold could exceed them.
The Structural Uptrend Continues
The most realistic path assumes gold continues the structural uptrend established in 2026, with central banks absorbing supply and institutional allocations normalizing higher. This $6,000–$6,300 range represents a meaningful tailwind for gold mining companies, expanding margins without requiring production growth. Supply constraints make this price trajectory increasingly likely because global mine production grows only 2–3% annually while central bank demand accelerates. China alone imported 317 tonnes in Q1 2026, and the People’s Bank of China continues adding to reserves at a pace that will absorb a substantial share of global production.
Central Bank Accumulation Outpaces Mine Supply
Central banks purchased 863 tonnes in 2025, and 95% of reserve managers expect further accumulation. This structural mismatch-slow supply growth paired with accelerating official-sector demand-creates an upward bias that persists even if Western ETF flows weaken. Chinese insurers received approval to allocate up to 1% of assets to physical gold, representing roughly 200 tonnes of incremental demand, with potential to expand to 5% in the future. These demand sources sit outside traditional price-discovery mechanisms, meaning they absorb supply regardless of price levels.
Mining Stocks Capture Dual Exposure
Mining companies benefit directly from this dynamic: higher prices expand profit margins, and constrained supply growth means production increases command premium valuations. Positions in gold mining stocks offer dual exposure to price appreciation and to the structural forces tightening the physical market through 2027. The practical implication is straightforward-investors tracking natural resource stocks gain from both the price trajectory toward $6,300 and from the supply-demand tightness that supports mining company profitability.
Final Thoughts
Gold’s price trajectory through 2027 rests on three concrete forces: Federal Reserve policy, central bank reserve diversification, and constrained mine supply. The $6,000–$6,300 range projected by major institutions reflects these structural drivers, not speculation. Real interest rates remain the immediate trigger-if the Fed maintains accommodative policy, gold continues higher, and if rates spike unexpectedly, prices face headwinds despite geopolitical tailwinds.
Monitor three specific indicators to track gold’s path forward: the Fed’s inflation commentary and real yield movements (any shift toward sustained higher rates pressures prices), central bank purchases through World Gold Council data and China’s People’s Bank disclosures, and the U.S. dollar index, which moves inversely to gold roughly 75% of the time. These three signals provide actionable intelligence for timing positions in both physical gold and mining stocks. Gold mining companies expand margins as prices rise toward $6,300 without requiring production increases, since global mine production grows only 2–3% annually while central bank demand accelerates.
The gold price trajectory reflects macro reserve diversification, persistent fiscal deficits, and under-allocated institutional demand. These forces reshape the market fundamentally over years and create a structural floor beneath prices through 2027. We at Natural Resource Stocks track these forces through expert analysis and macroeconomic insights to help you position portfolios effectively.