






















As of Aug 10, 2026 at 1:35 AM EDT, the live Gold spot price for 1 ounce of Gold in U.S. dollars (USD) is $4,328.82; 1 gram of Gold is $139.17, and 1 kilogram of Gold is $139,174.79. Gold spot price can fluctuate by the second, driven by investment supply and demand, and other factors.
Gold Spot Prices
Gold Price | Change |
Gold Price Per Ounce — $4,328.82 | -$13.36 |
Gold Price Per Gram — $139.17 | -$0.43 |
Gold Price Per Kilo — $139,174.79 | -$429.53 |
Live Metal Spot Prices (24 Hours) Last Updated: 08/10/2026 at 1:35 AM EDT
Track the intraday move in real time on the Natural Resource Stocks gold spot chart.
Gold Price Today at a Glance – Aug 10, 2026
The current gold spot price Aug 10 2026 sits at $4,328.82 per troy ounce, easing 0.31% in Asian-hours trade after a powerful run higher last week. Bullion is consolidating just beneath seven-week highs rather than reversing — the pullback amounts to roughly $13 an ounce against a weekly advance of more than 7%.
Metric | Level (Aug 10, 2026) |
Gold spot price per ounce | $4,328.82 |
Daily change | -$13.36 (-0.31%) |
Previous close | $4,342.18 |
Session open | $4,342.18 |
Day’s range | $4,313.25 – $4,351.88 |
52-week range | $3,311.46 – $5,595.46 |
1-year change | +27.24% |
U.S. Gold Futures (front month) | ~$4,395.40 (-0.1%) |
Silver spot | $63.89 (+0.5%) |
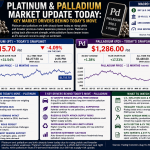
Platinum spot | $1,757.50 (+0.5%) |
Bid/Ask: $4,329.18 / $4,329.52
The key read for anyone checking the gold price Aug 10 2026 current level: this is a pause, not a peak. Gold has held the $4,300 handle through the entire Asian session, and the wider precious metals complex is trading with a firm bid — silver and platinum are both higher on the day even as gold ticks lower, which is classic consolidation behaviour rather than risk-off liquidation.
Gold Price Aug 10 2026 USD Per Ounce, Gram and Kilo
For buyers working in different weight units, here is how the gold spot price per ounce Aug 10 2026 converts across the standard measures:
Unit | Conversion | Price (USD) | Change |
1 troy ounce | 31.1035 g | $4,328.82 | -$13.36 |
1 gram | — | $139.17 | -$0.43 |
10 grams | — | $1,391.75 | -$4.30 |
1 tola (11.664 g) | — | $1,623.31 | -$5.01 |
1 kilogram | 32.1507 oz | $139,174.79 | -$429.53 |
1 troy pound (12 oz) | — | $51,945.84 | -$160.32 |
Note: Precious metals are quoted in troy ounces (31.1035 g), not standard avoirdupois ounces (28.35 g). Retail dealer prices will sit above these spot figures because of fabrication, assay and distribution premiums.
Gold Price Drivers Aug 10, 2026
Four forces are setting the tone for the gold price drivers Aug 10, 2026 session. Together they explain why bullion pushed to seven-week highs on Friday and why it is now holding rather than extending.
1. A Softer U.S. Labour Market Has Repriced the Fed
This is the dominant driver. Friday’s July employment report came in weaker than expected, with downward revisions to prior months compounding the miss. That reset rate-path expectations sharply.
Futures markets now price roughly a 44% probability of a Federal Reserve rate hike at the September 15–16 meeting, down from about 67% a week earlier. Put differently, the odds of a September hike have fallen from better-than-even to distinctly below even.
That matters enormously for gold. Bullion pays no coupon, so its relative attractiveness is a direct function of what competing yields offer. Every basis point shaved off the expected policy path lowers the opportunity cost of holding metal. The 10-year Treasury yield stabilising near 4.673% and a broadly softer U.S. dollar are the transmission mechanism — and both are currently working in gold’s favour.
2. Strait of Hormuz Uncertainty Keeps a Geopolitical Bid Under Bullion
Iran has signalled it is nearing a final pact with Oman to establish new shipping lanes through the Strait of Hormuz, but Tehran has also made clear the waterway stays restricted until outstanding conditions from Washington are met.
Markets are reading this as unresolved rather than resolved. That ambiguity is precisely the environment in which safe-haven allocations get built and held. Crude reflects the same anxiety: Brent crude added 0.9% to $84.32 a barrel and U.S. crude rose 0.7% to $78.74.
3. Higher Oil Is a Genuine Two-Way Risk
Here is the complication that is capping today’s upside. Rising energy prices feed directly into headline inflation. If crude keeps climbing on Gulf disruption, the inflation data the Fed is watching gets harder to read — and the case for holding policy tighter for longer strengthens.
So oil is doing two opposing things to gold simultaneously: adding a geopolitical risk premium (bullish) while complicating the Fed easing narrative (bearish). That tension is a large part of why the current gold price Aug 10 2026 is drifting sideways instead of breaking out.
4. This Week’s Inflation Prints Are the Next Catalyst
The calendar is front-loaded with data that will resolve the argument:
- Wednesday — July CPI. Consensus looks for +0.1% headline and +0.2% core.
- Thursday — July PPI.
JPMorgan’s chief economist has flagged that core goods prices falling for two consecutive months should limit inflation pressure — but also warned that back-to-back prints of 0.3% or higher could force the Fed’s hand.
A soft CPI on Wednesday would likely be the trigger that carries gold decisively through last week’s highs. A hot print is the clearest near-term downside risk to the gold spot price Aug 10 2026.
The Gold Price Rally 2026 Aug Precious Metals Market in Context
Zoom out and the gold price rally 2026 Aug precious metals market narrative is considerably more constructive than a single -0.31% session suggests.
- Weekly performance: gold gained more than 7% last week.
- Annual performance: the metal is up +27.24% year-on-year.
- Range context: at $4,328.82, gold sits well above the 52-week low of $3,311.46 but still roughly 22.6% below the 52-week high of $5,595.46 — meaning there is substantial technical room before the metal revisits its cycle peak.
- Breadth: silver at $63.89 and platinum at $1,757.50 are both green on the day. Rallies with participation across the complex tend to be more durable than gold-only moves.
Equity Markets Are Confirming the Move
Producer equities are the clearest confirmation signal, and they are firing. On the ASX, the gold sub-index rallied more than 3% to its highest level since mid-April, tracking bullion. Individual names followed through:
Producer | Move (Aug 10) |
St Barbara | +4.7% |
Evolution Mining | +1.3% |
BHP Group | +1%+ |
Rio Tinto | +1%+ |
Fortescue | +0.7% |
The broader Australian mining sector added 1.4% on strong metal prices — notable because it came against a 0.5% decline in the S&P/ASX 200 overall, dragged down by a 5.1% slide in Westpac after the bank halved its housing credit growth forecasts. When resources rally against a falling index, that is sector rotation into hard assets, not beta.
Investors tracking producer and developer names through this move can follow coverage of gold-focused issuers via NRS Company Spotlights and screen valuations through ResourceNAV.
Also on the Calendar
The Reserve Bank of Australia delivers its decision Tuesday. Markets broadly expect rates on hold, but the accompanying guidance matters for AUD-denominated gold and for the Australian producers listed above.
Technical Levels to Watch
Level | Price | Significance |
Resistance 2 | $4,432.10 | Recent futures session high |
Resistance 1 | $4,351.88 | Today’s high — must clear to resume the uptrend |
Pivot | $4,342.18 | Previous close/session open |
Spot | $4,328.82 | Current gold spot price Aug 10 2026 |
Support 1 | $4,313.25 | Today’s low |
Support 2 | $4,300.00 | Round-number psychological floor |
Support 3 | $4,288.00 | Recent futures session low |
The structural read: gold needs a close above $4,351.88 to re-engage the seven-week high. Losing $4,300 would signal that the post-jobs-report rally is being faded and open the door back toward $4,288.
Bookmark the live metal charts to watch these levels update through the North American session.
What This Means for Gold Investors
Physical buyers. The gold price Aug 10 2026 usd per ounce at $4,328.82 represents a modest discount to Friday’s close. For accumulators using a cost-averaging approach, minor intraday dips inside a strong weekly uptrend are historically unremarkable entry points — but always compare dealer premiums against the spot benchmark above.
Equity investors. Miners are showing operational leverage right now. A 3% move in the ASX gold sub-index against a roughly flat bullion tape is the market pricing in margin expansion at current gold prices. That leverage cuts both ways on a reversal.
Traders. The event risk is concentrated and dated: CPI on Wednesday, PPI on Thursday. Positioning ahead of those prints is a directional bet on the inflation path, not on gold itself.
Portfolio allocators. With the Hormuz issue unresolved, September Fed-hike odds falling, the dollar softening, and real yields drifting lower, a $13 pullback has not invalidated the structural case that drove gold up 27% over 12 months.
Stay current with daily market coverage through the Natural Resource Stocks industry news feeds and the full Natural Resource Stocks research hub.
Frequently Asked Questions
What is the current gold price on Aug 10, 2026?
The current gold price Aug 10 2026 is $4,328.82 per troy ounce as of 1:35 AM EDT, down $13.36 (-0.31%) from the previous close of $4,342.18. Per gram, gold is $139.17; per kilogram, $139,174.79.
What is the gold spot price per ounce on Aug 10 2026 versus gold futures?
Spot gold trades at $4,328.82 per ounce while front-month U.S. gold futures sit near $4,395.40, down about 0.1%. Futures trade at a premium to spot to account for storage, insurance and financing costs to the delivery date.
Why did the gold price fall today?
The dip is consolidation after a strong week, not a trend change. Gold rallied more than 7% last week to seven-week highs on the weak July jobs report. Today’s -0.31% move reflects profit-taking plus the offsetting effect of higher oil prices, which complicate the inflation outlook.
What are the main gold price drivers on Aug 10, 2026?
Four: (1) September Fed hike odds falling to ~44% from ~67% after soft July payrolls; (2) unresolved Strait of Hormuz shipping restrictions supporting safe-haven demand; (3) rising crude — Brent at $84.32 — muddying the inflation path; and (4) anticipation of Wednesday’s July CPI and Thursday’s PPI.
Is the gold price rally in 2026 still intact?
On the evidence, yes. Gold is up 27.24% year-on-year and gained over 7% last week. Silver ($63.89) and platinum ($1,757.50) are both higher today, and gold equities rallied over 3% on the ASX — breadth signals consistent with a live uptrend rather than an exhausted one.
How much is 1 gram and 1 kilogram of gold on Aug 10 2026?
At the current gold spot price Aug 10 2026 of $4,328.82 per troy ounce: 1 gram = $139.17 (-$0.43) and 1 kilogram = $139,174.79 (-$429.53).
What could push gold higher this week?
A softer-than-expected July CPI print on Wednesday would further reduce September Fed hike odds and is the most likely upside catalyst. An escalation or breakdown in the Iran–Oman Hormuz negotiations would add a geopolitical premium on top.