





















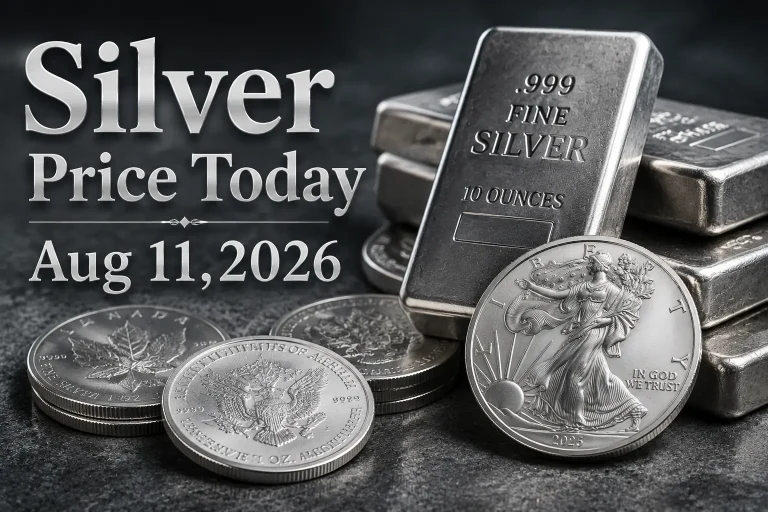
As of August 11, 2026, at 4:05 AM EDT, the current spot price of Silver per ounce is $66.29 USD. The price per gram is $2.13, while per kilogram, it is $2,131.21. Silver spot prices are constantly changing, affected by investment demand and various other factors.
Silver Spot Prices
|
Silver Price |
Price |
Change |
|
Silver Price Per Ounce |
$66.29 |
+$1.02 |
|
Silver Price Per Gram |
$2.13 |
+$0.03 |
|
Silver Price Per Kilo |
$2,131.21 |
+$32.63 |
Live Metal Spot Prices (24 Hours) Last Updated: 08/11/2026 at 4:05 AM EDT
The current silver spot price Aug 11 2026, is printing at $66.29 per troy ounce, a gain of 1.56% versus Monday’s close of $65.27. That extends one of the most powerful advances the precious metals complex has seen this cycle, with silver now up roughly 75.8% over the past twelve months.
Silver Price Aug 11 2026 USD Per Ounce: Session Snapshot
For traders tracking the silver spot price per ounce Aug 11 2026, here is the full session data set as reported on the silver quote page:
|
Metric |
Value |
|
Last Price (per troy ounce) |
$66.29 |
|
Daily Change |
+$1.02 (+1.56%) |
|
Previous Close |
$65.27 |
|
Open |
$65.88 |
|
Day’s Range |
$65.60 – $66.68 |
|
52-Week Range |
$36.96 – $121.79 |
|
Volume |
5,998 contracts |
|
Contract |
September 2026 (settles 09/28/2026) |
|
Contract Size |
5,000 troy ounces |
Silver-linked ETFs tracked the move closely, with SLV and SIVR both adding roughly 3.3% as the underlying metal broke out. Investing.com’s technical summary currently reads “Strong Buy” across the 30-minute, hourly, 5-hour and daily timeframes, while the weekly and monthly gauges remain neutral — a classic signature of a market with strong short-term momentum but stretched longer-term positioning.
If you want the running quote rather than a daily snapshot, our live silver price chart and the gold & silver commodities dashboard update continuously through the session.
Silver Price Drivers Aug 11 2026: What Is Moving the Metal
Four forces are doing the heavy lifting behind the silver price Aug 11 2026 current quote. Understanding them matters more than the headline number, because each one has a different shelf life.
1. A Shock U.S. Payrolls Print Reset Fed Expectations
The single biggest catalyst was Friday’s U.S. employment report. Nonfarm payrolls contracted by 23,000 in July — the first outright decline in months — against economist forecasts calling for roughly 80,000 in gains. A miss of that magnitude does not get absorbed quietly. The repricing was immediate: the market-implied probability of a Federal Reserve rate hike at the September meeting fell from around 67% to approximately 44%. Because silver pays no coupon, the opportunity cost of holding it declines whenever the expected path of policy rates falls. That single shift removed the most persistent headwind the metal has faced all year.
2. A Softer Dollar and Easing Treasury Yields
The U.S. dollar slid to multi-week lows in the wake of the payrolls data, and Treasury yields eased alongside it. Silver is priced in greenbacks, so a weaker dollar mechanically lifts the silver spot price Aug 11 2026 for holders of every other currency and improves affordability for physical buyers in India, China and the Gulf. Falling real yields compound the effect. When the return on cash and short-dated Treasuries drops, capital that had been parked in yield rotates toward hard assets — and silver, with its smaller market than gold, tends to move further and faster once that rotation begins.
3. Chinese Industrial Demand Is Accelerating
This is the leg of the story that separates the silver price rally 2026 Aug from a purely monetary trade. Chinese imports of silver-bearing ores surged year-over-year in June, driven by expanding solar panel manufacturing and electricity grid buildout — two sectors that depend directly on silver’s unmatched electrical conductivity.
Solar photovoltaic paste and grid-scale electrical contacts are not discretionary applications. They are engineered specifications with no cost-effective substitute at scale, which means this demand is comparatively price-inelastic. Investors weighing exposure to that structural theme may find our silver mining stocks analysis a useful companion read.
4. Safe-Haven Bid and a Firm Gold Complex
Gold rallied to fresh multi-week highs, lifting sentiment across the entire precious metals board. A mild risk-off tone in equities — the S&P 500 finished slightly lower and the Nasdaq declined — plus renewed geopolitical uncertainty around the Strait of Hormuz added an incremental safe-haven bid. Silver’s dual identity as both an industrial input and a monetary metal means it captured flows from both narratives simultaneously. For the parallel story in bullion, see our gold sector coverage.
Technical Picture: Momentum Versus Exhaustion
The current silver price Aug 11 2026 sits at the sharp end of a textbook technical setup. The rally originated from a V-bottom at $55.00, and the ascent since has been, in the words of one Investing.com technical note, “a turbocharged uptrend.”
Resistance Levels to Watch
|
Level |
Significance |
|
$65.50 |
Prior near-term resistance — now cleared |
|
$68.20 |
38.2% Fibonacci retracement — first real ceiling |
|
$72.00 |
Structural high |
|
$76.00 |
50% Fibonacci retracement |
Support Levels to Watch
|
Level |
Significance |
|
$63.15 |
23.6% Fib + SMA(20) confluence — first line of defence |
|
$62.13 |
SuperTrend (currently green) |
|
$62.00 |
Bull-case invalidation level |
|
$61.50 |
Support floor |
|
$60.73 |
SMA(200) — long-term trend arbiter |
Momentum Indicators
- RSI: 74 — firmly in overbought territory
- MACD: 1.40 vs. signal 1.24 — still bullish, but the histogram is narrowing
- Bollinger Bands: price is riding the upper band at $65.84
- SMA(20): price sits roughly 4.65% above the 20-day average, a short-term exhaustion signal
That combination — bullish structure, overbought oscillators, price pinned to the upper Bollinger Band — is best described as a momentum-versus-exhaustion standoff. Trend followers will note that nothing in the structure is broken as long as the price holds above $62.00. Mean-reversion traders will note that stretched conditions rarely resolve without at least a pause. Both can be right in sequence.
Analysts have outlined two working scenarios that share the same $68.20 / $72.00 / $76.00 target ladder but differ on entry: an aggressive approach engaging near $66.00, and a conservative approach waiting for a retracement to the $63.15 confluence zone. For a longer-horizon view, our silver price forecast for this year puts these levels in context within the broader cycle.
The 2026 Silver Price Rally and the Context of the Precious Metals Market in August
Zoom out and the silver price on Aug 11, 2026, USD per ounce looks less like a spike and more like a multi-quarter regime change. The 52-week range shows silver has traded between $36.96 and $121.79. The current $66.29 is above the low but far below the peak — meaning silver is neither a bargain nor an extreme. A 75.8% twelve-month rise makes silver one of 2026’s top commodities.
This rally differs from earlier ones due to its bid composition. Earlier advances relied on monetary speculation, but Aug 11 2026 silver drivers include real industrial growth from China’s solar and grid programs, providing a stronger market floor. Financial flows are unpredictable, but solar schedules are fixed. Compared to Monday’s baseline — silver around $2.10 per gram and about $2,098.58 per kilo — today’s move marks a significant single-session revaluation across all units.
Miners and Equities: The Leverage Trade
Rising bullion prices flow directly into producer margins, and the Q2 2026 reporting season is delivering evidence.
Heliostar Metals posted record quarterly output in its Q2 2026 results, including 79,710 ounces of silver — a company record — produced as a by-product alongside its primary gold operations at La Colorada and San Agustin. Full-year 2026 guidance calls for 290,000 to 320,000 ounces of silver, with the company reporting $43 million in cash and describing its growth plan as on track.
By-product silver is a useful barometer precisely because it is incidental. When a gold-focused producer books record silver ounces at a moment when the current silver spot price is up more than 75% year-over-year, that revenue lands almost entirely at the margin line. Investors tracking the equity side of the trade can follow our coverage of Aya Gold & Silver, Kootenay Silver, Defiance Silver, and Silver 47, as well as our gold mining stocks outlook and the latest company press releases.
What to Watch Next
Wednesday’s U.S. CPI report is the next major catalyst. A cooler-than-expected inflation print would reinforce the disinflation-plus-weak-labour narrative that drove Friday’s repricing, potentially clearing the path toward the $68.20 Fibonacci resistance. A hot print does the opposite — it revives September hike odds, firms the dollar, and hands mean-reversion traders the excuse they need to press toward the $63.15 confluence.
Beyond CPI, three variables deserve monitoring:
- Dollar index behaviour — a bounce off multi-week lows would cap the metal quickly
- Chinese ore import data — the industrial leg of the thesis needs continued confirmation
- Strait of Hormuz headlines — geopolitical premium can evaporate as fast as it appears
Compare today’s print with our previous update, Silver Price Today – Aug 06, 2026, to see how quickly this week’s data flow reshaped the tape.
Frequently Asked Questions
What is the current silver price on Aug 11 2026?
The current silver spot price on Aug 11, 2026, at 4:05 AM EDT is $66.29 per troy ounce, up $1.02 (+1.56%) from the previous close of $65.27. Per gram, silver is $2.13; per kilogram, $2,131.21.
What is the silver spot price per ounce, Aug 11, 2026, in other units?
At $66.29 per troy ounce, silver equates to $2.13 per gram and $2,131.21 per kilogram. One troy ounce equals 31.1035 grams, and one kilogram equals 32.1507 troy ounces.
Why is silver rising today?
The primary silver price drivers Aug 11 2026 are a shock U.S. payrolls contraction of 23,000 jobs in July, a drop in September Fed rate-hike odds from ~67% to ~44%, a dollar at multi-week lows, and surging Chinese imports of silver-bearing ore for solar and grid manufacturing.
Is silver overbought at current levels?
Technically, yes, on short timeframes. RSI sits at 74, price is riding the upper Bollinger Band at $65.84, and the metal trades roughly 4.65% above its 20-day moving average. The broader trend remains intact above the $62.00 invalidation level and the $60.73 SMA(200).
What are the key silver price levels to watch?
Resistance sits at $68.20 (38.2% Fib), then $72.00 and $76.00. Support runs through $63.15 (23.6% Fib + SMA-20 confluence), $62.13 (SuperTrend), $62.00 (bull invalidation), and $61.50.
How much has silver gained over the past year?
Silver is up approximately 75.8% over the trailing twelve months, with a 52-week range of $36.96 to $121.79.
The Bottom Line
The silver price on Aug 11 2026, at a current reading of $66.29 per ounce, reflects a market where monetary tailwinds and industrial demand are pulling in the same direction at the same time — an unusual and powerful alignment. A weakening U.S. labour market has repriced Fed expectations, the dollar has softened, and Chinese solar and grid buildout continues to absorb physical metal. The caution is technical, not fundamental. RSI at 74 and a price stretched 4.65% above its 20-day average argue that the easy part of this move is behind it. Wednesday’s CPI print will likely decide whether $68.20 gets tested this week or whether the market first backs into the $63.15 support shelf to reload.
For continuously updated quotes, bookmark our live silver price page and the commodities dashboard.