
























Silver spot price moves tell you something important about market conditions and investor sentiment. At Natural Resource Stocks, we’ve found that understanding these price signals separates successful investors from those who react emotionally to short-term noise.
This guide walks you through what drives silver prices, how to read the signals, and which strategies work when prices shift.
What Really Moves Silver Prices
Real Yields Trump Inflation Reports
Inflation expectations move silver harder than actual inflation numbers. When the Federal Reserve signals rate hikes, real yields rise and silver sells off, even if price levels remain stable. This happened in July 2026 when markets priced a 35% chance of a September rate hike, pushing silver down despite strong industrial demand. The inverse relationship between real yields and silver prices operates mechanically and reliably. Watch the Fed funds futures market for rate expectations rather than waiting for inflation reports to arrive. US core producer prices in July rose less than expected, which immediately eased rate-hike concerns and allowed silver to stabilize around $64 per ounce.
Industrial Demand Now Dominates Price Action
Industrial demand from solar manufacturing and electric vehicles overwhelms monetary demand in driving near-term silver momentum. Chinese imports of silver-bearing ores jumped 62.5% year-over-year in June to 219,000 tonnes-a concrete signal that downstream fabricators pull metal harder. Solar panels consumed approximately 232 million troy ounces of silver in 2024, representing roughly 19% of total silver demand and 34% of all industrial silver consumption, and this number grows annually as grid investment accelerates globally. Electric vehicles use about one troy ounce of silver per unit versus 0.5 ounces in conventional vehicles, and EV sales hit 20% of new vehicle sales in 2024.

This structural shift adds incremental demand every quarter and creates a floor beneath prices that monetary factors alone cannot breach.
Geopolitical Risk Works Through Energy, Not Supply
Geopolitical tension in the Strait of Hormuz influences silver indirectly through energy prices and inflation expectations rather than through direct supply constraints. Major silver producers like Mexico, Peru, China, and Australia face no direct supply disruption from Middle East tensions. Oil price movements, however, feed into inflation expectations and shift Fed policy calculations-this indirect channel matters far more than any physical supply risk. The current price around $64 per ounce reflects this tug-of-war: rate-hike fears cap upside, while industrial demand floors keep prices from collapsing.
What Price Levels Signal Next
A move back above $65 per ounce would signal that industrial demand has overcome macro headwinds and momentum turns decisively higher. This level acts as a technical inflection point where investors can assess whether the structural demand story (solar, EVs, grid modernization) has shifted market psychology. Understanding these price signals prepares you to recognize when conditions favor accumulation versus caution-the next section shows you how to read those signals with precision.
Reading Silver Price Signals Correctly
Price Patterns Reveal Market Conviction
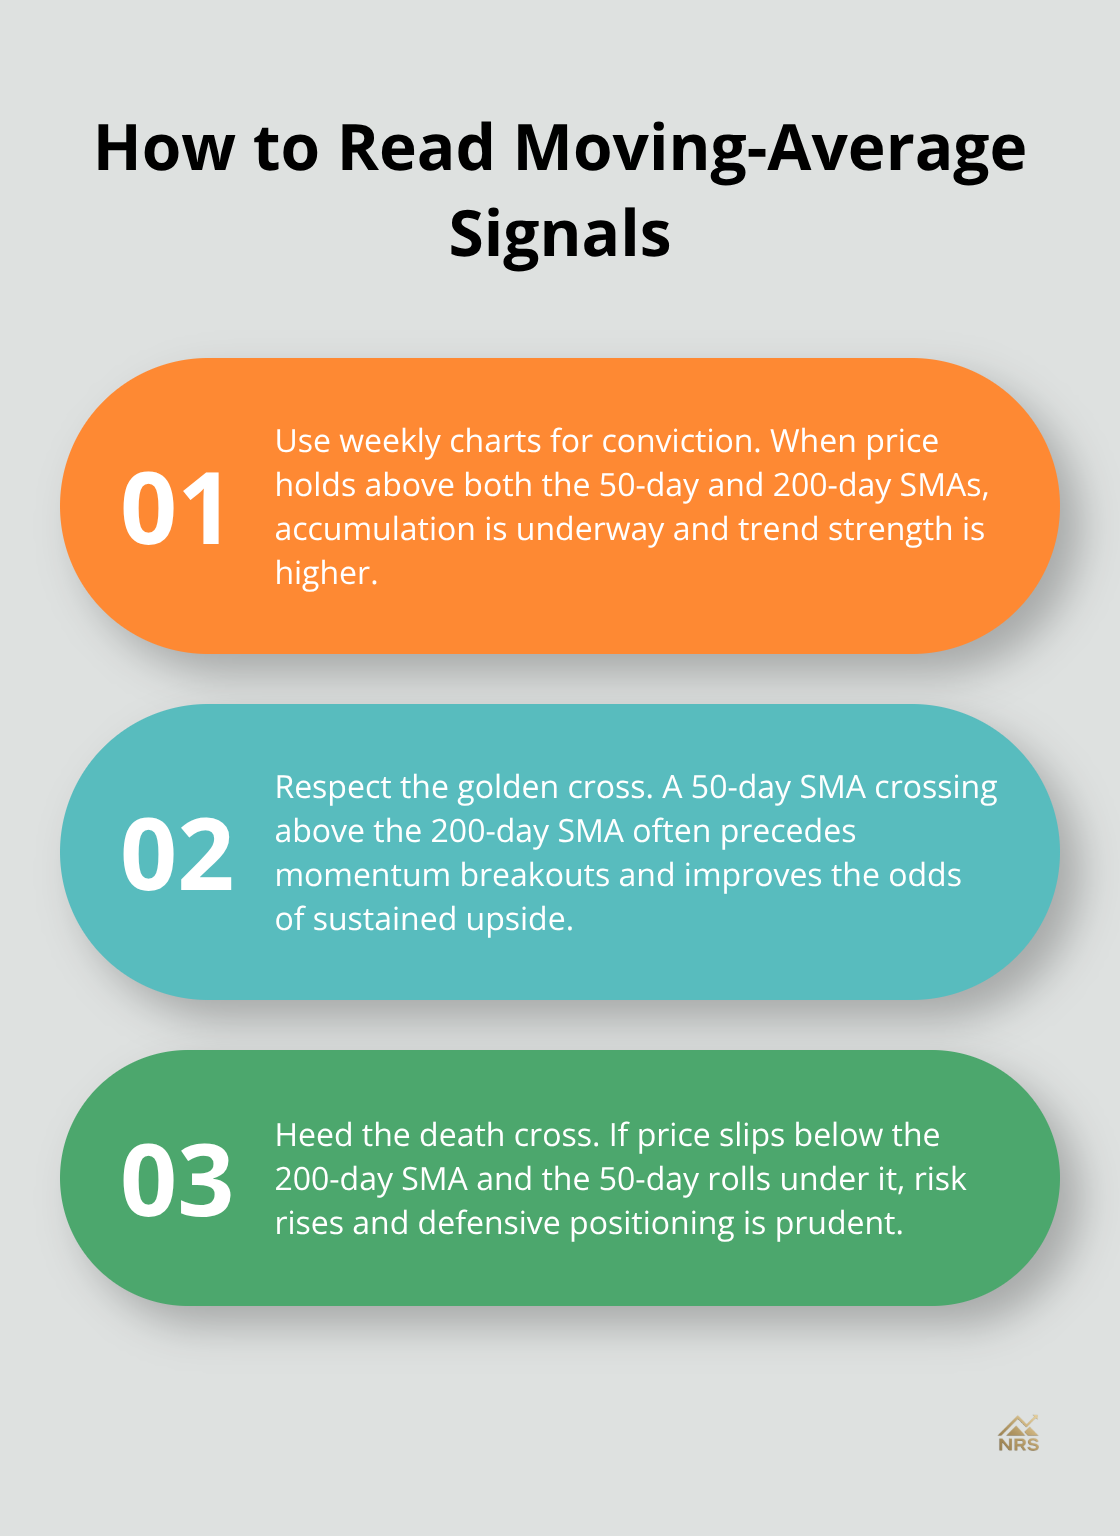
Silver currently trades around $64 per ounce after an 11.61% monthly gain and a 69.54% year-over-year surge, yet it remains 47 dollars below the January 2026 all-time high of $121.64 per ounce. This gap tells you the market has priced in rate-hike fears even as industrial demand accelerates. The 50-day simple moving average against the 200-day SMA on weekly charts shows you whether accumulation is underway-price above both averages signals strength, while price below the 200-day SMA indicates a genuine bearish turn. A golden cross (50-day SMA crossing above 200-day SMA) signals momentum breakouts worth acting on, while a death cross warns of serious downside risk.
Technical Levels and Support Zones
The $65 level acts as immediate resistance because traders recognize it as a technical inflection point where industrial demand either overcomes macro headwinds or retreats. Support sits around $57.22, and high-volume nodes on price charts act as future magnets-silver tends to revisit zones where heavy trading occurred previously. RSI readings above 70 suggest overbought conditions on daily charts, but due to silver’s volatility, some traders use 75 as the threshold instead; readings below 25 or 30 signal oversold setups where reversals often initiate. MACD crossovers work best on daily or weekly timeframes rather than intraday noise, and the histogram tells you whether momentum accelerates or fades at critical support and resistance zones.
Volume Confirms Breakout Reliability
Volume confirmation separates reliable breakouts from false signals. A move above $65 on high volume carries far more weight than the same move on thin trading, since silver markets clear lower daily volumes than gold, making liquidity-driven moves more common than fundamental ones. Bollinger Band squeezes precede sharp directional moves, and a breakout above the upper band combined with volume produces cleaner entry signals than breakouts on whisper volumes. Fibonacci retracements at 61.8%, 50%, and 38.2% mark probable pullback zones during corrections-the 61.8% level often holds within uptrends while deeper retracements suggest trend exhaustion.
Timeframe Strategy for Physical Holders
For physical holders, the weekly chart deserves your primary attention, the monthly chart provides directional context over quarters, and daily charts serve only for timing entries after weekly confirmation. The gold-to-silver ratio around 70:1 in July 2026 adds relative-value perspective-historically, ratios above 80 suggest silver trades cheaper relative to gold and offer rebalancing opportunities, while ratios below 50 suggest silver has become pricier. This ratio has trended downward from 127:1 in 2020, reflecting silver’s stronger performance driven by solar and EV demand. A falling ratio signals momentum rotating into silver, while a rising ratio suggests rotating into gold, providing multi-year context beyond daily price moves.
These technical signals form the foundation for timing decisions, but they work best when paired with concrete entry strategies that account for your risk tolerance and investment horizon.
Investment Strategies Based on Silver Price Movements
Timing Entries at Technical Inflection Points
The gap between silver’s January 2026 high of $121.64 and today’s $64 creates a psychological trap: investors chase rallies after they’ve already moved 10-15%, then panic-sell into weakness. Real money enters when price touches the 200-day SMA on weekly charts after a confirmed golden cross forms, not when RSI climbs above 70. The 200-day SMA acts as dynamic support because institutional accumulation clusters there, and silver has historically bounced from that level multiple times during bull runs. Try the 38.2% Fibonacci retracement during pullbacks within established uptrends rather than buying breakouts above $65 on thin volume. This approach works because Fibonacci levels mark zones where buyers historically step in again, reducing your risk of catching falling knives.
Reading the Gold-to-Silver Ratio for Tactical Opportunities
The gold-to-silver ratio near 70:1 signals that silver still offers relative value compared to gold, especially if the ratio climbs back above 80:1, which would indicate a genuine tactical opportunity to rotate money into silver. This ratio has trended downward from 127:1 in 2020, reflecting silver’s stronger performance driven by solar and EV demand. A falling ratio signals momentum rotating into silver, while a rising ratio suggests rotating into gold, providing multi-year context beyond daily price moves. Understanding silver price drivers helps contextualize these ratio shifts within broader market fundamentals.
Exit Strategies and Profit-Taking Discipline
Take profits at the 200-day SMA after the price extends 15-20% above it, since silver’s volatility makes holding through extended rallies emotionally exhausting and statistically unrewarding. Volume confirmation separates professional entry signals from noise, so ignore breakouts above $65 unless daily volume exceeds the 30-day average by at least 25%. The Strait of Hormuz tensions and Fed rate expectations will create intraday swings, but these represent timing noise rather than fundamental reversals, so anchor your decisions to weekly charts where industrial demand signals carry real weight.
Diversification Across Silver Exposure Types
Diversifying across silver mining stocks, physical bullion, and silver ETFs reduces single-point-of-failure risk that pure spot-price exposure creates. Mining stocks amplify silver price moves but carry company-specific operational risk, so limit mining positions to 30-40% of your precious metals allocation.
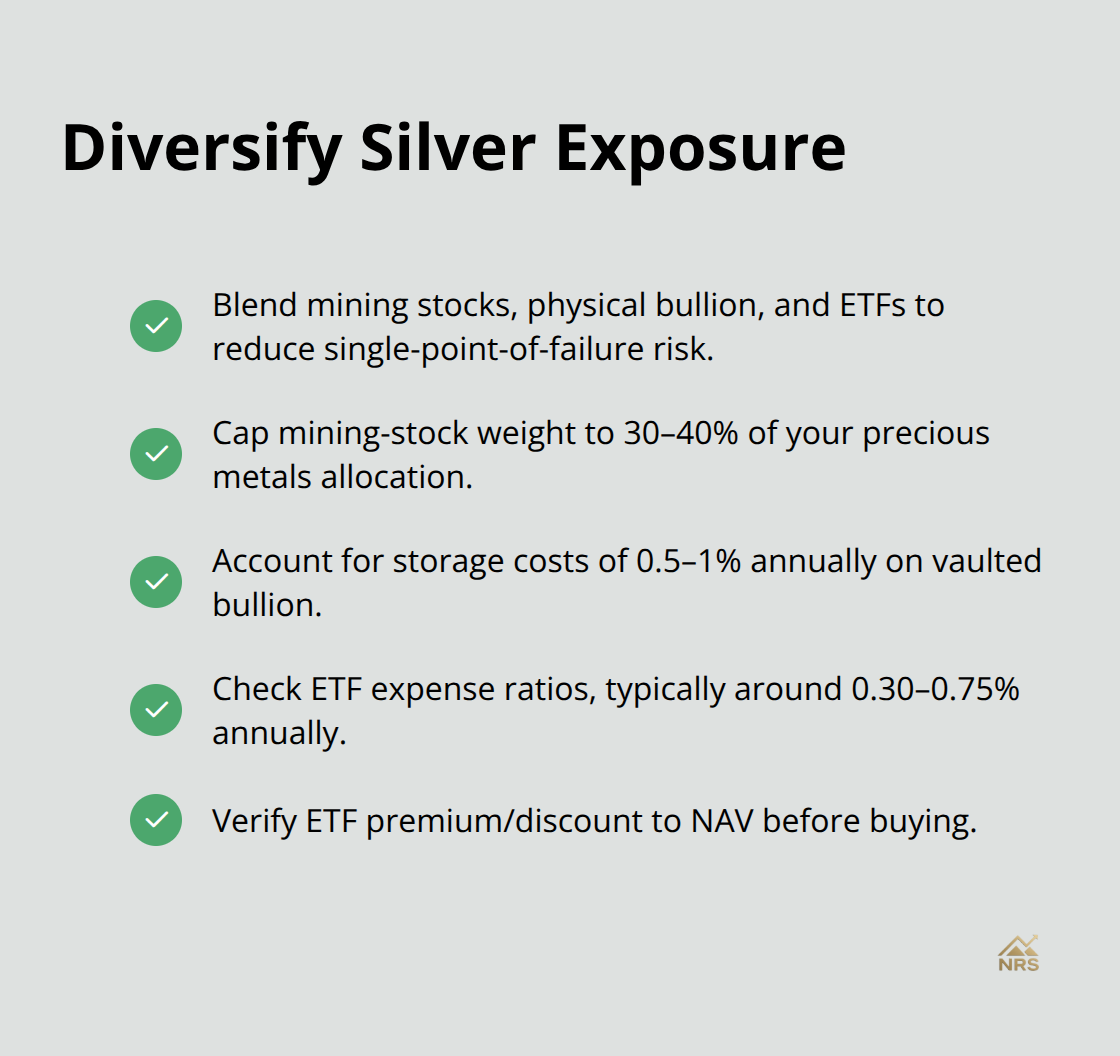
Physical silver bullion stored in insured vaults eliminates counterparty risk entirely, though storage costs around 0.5-1% annually reduce net returns slightly. Silver ETFs offer liquidity and tax efficiency within retirement accounts, but they charge management fees of 0.30-0.75% annually and may trade at premiums or discounts to their net asset value, so verify the spread before buying.
Structural Demand and Momentum Confirmation
The technical reality is that 232 million ounces of annual solar demand and growing EV adoption create a structural floor beneath silver prices, making physical accumulation sensible even during macro weakness. MACD crossovers on weekly charts confirm momentum shifts better than daily readings, so wait for weekly MACD bullish crossover plus price above the 200-day SMA before adding significant positions. Bollinger Band squeezes on monthly charts often precede 15-30% moves within 4-6 weeks, so tightening bands signal preparation time rather than action time. Chinese silver-bearing ore imports jumped 62.5% year-over-year in June, proving that downstream fabricators pull metal aggressively when prices stabilize, which validates the structural demand thesis and supports patient accumulation strategies over the next 12-24 months.
Final Thoughts
Silver spot price moves reflect a market caught between two competing forces: macro headwinds from Fed rate expectations and structural tailwinds from industrial demand. We at Natural Resource Stocks believe the industrial story wins over the next 12-24 months because 232 million ounces of annual solar demand and accelerating EV adoption create a floor that monetary policy alone cannot breach. The January 2026 high of $121.64 per ounce remains within reach if industrial demand continues accelerating while rate-hike fears fade.
Your success depends on anchoring decisions to weekly charts rather than daily noise, with the 200-day simple moving average acting as your primary reference point for accumulation zones. Volume confirmation separates real breakouts from false signals, so ignore moves above $65 per ounce unless daily volume exceeds the 30-day average by at least 25%. The gold-to-silver ratio near 70:1 signals that silver still offers relative value, and a ratio climb above 80:1 would represent a genuine tactical opportunity to rotate capital into the metal.
Diversify across physical bullion, mining stocks, and silver ETFs to reduce single-point-of-failure risk, with physical silver stored in insured vaults eliminating counterparty risk entirely while mining stocks amplify price moves but carry operational risk. Monitor Fed funds futures for rate expectations rather than waiting for inflation reports, since real yields move silver mechanically and reliably, and Chinese silver-bearing ore imports jumped 62.5% year-over-year in June, proving that downstream fabricators pull metal aggressively when prices stabilize. Explore expert market analysis and geopolitical insights at Natural Resource Stocks to refine your timing and build conviction around your silver allocation.