


Gold trading remains a popular investment strategy, but mastering it requires a deep understanding of market dynamics and expert techniques. At Natural Resource Stocks, we’ve compiled the best strategies for gold trading to help investors navigate this complex market.
Our comprehensive guide covers essential technical analysis tools, fundamental analysis strategies, and the key factors influencing gold prices. Whether you’re a seasoned trader or just starting out, these expert tips will sharpen your gold trading skills and potentially boost your returns.
What Drives Gold Prices?
Economic Indicators and Gold
Gold prices often move inversely to the strength of the U.S. dollar. When the dollar strengthens, gold typically weakens, and vice versa. This relationship is critical for traders to monitor.
Inflation rates also play a significant role. Gold often serves as a hedge against inflation, with prices tending to rise when inflation increases. The World Gold Council reports that gold has outperformed inflation by an average of 1.1% per year since 1971.
Interest rates set by central banks (particularly the Federal Reserve) have a substantial impact on gold prices. Lower interest rates generally support higher gold prices as they reduce the opportunity cost of holding non-yielding assets like gold.
Geopolitical Events and Gold Trading
Geopolitical tensions and uncertainties often drive investors towards gold as a safe-haven asset. During the 2008 financial crisis, gold prices rose by 25% while the S&P 500 fell by 38%.
Major global events can significantly impact gold prices. In 2020, gold prices reached an all-time high of $2,067.15 per ounce, driven by economic uncertainties and increased demand for safe-haven assets during the COVID-19 pandemic.
Supply and Demand Dynamics
Gold supply remains relatively inelastic, with annual mine production adding only about 1.5% to the total above-ground stock. This makes gold prices particularly sensitive to changes in demand.
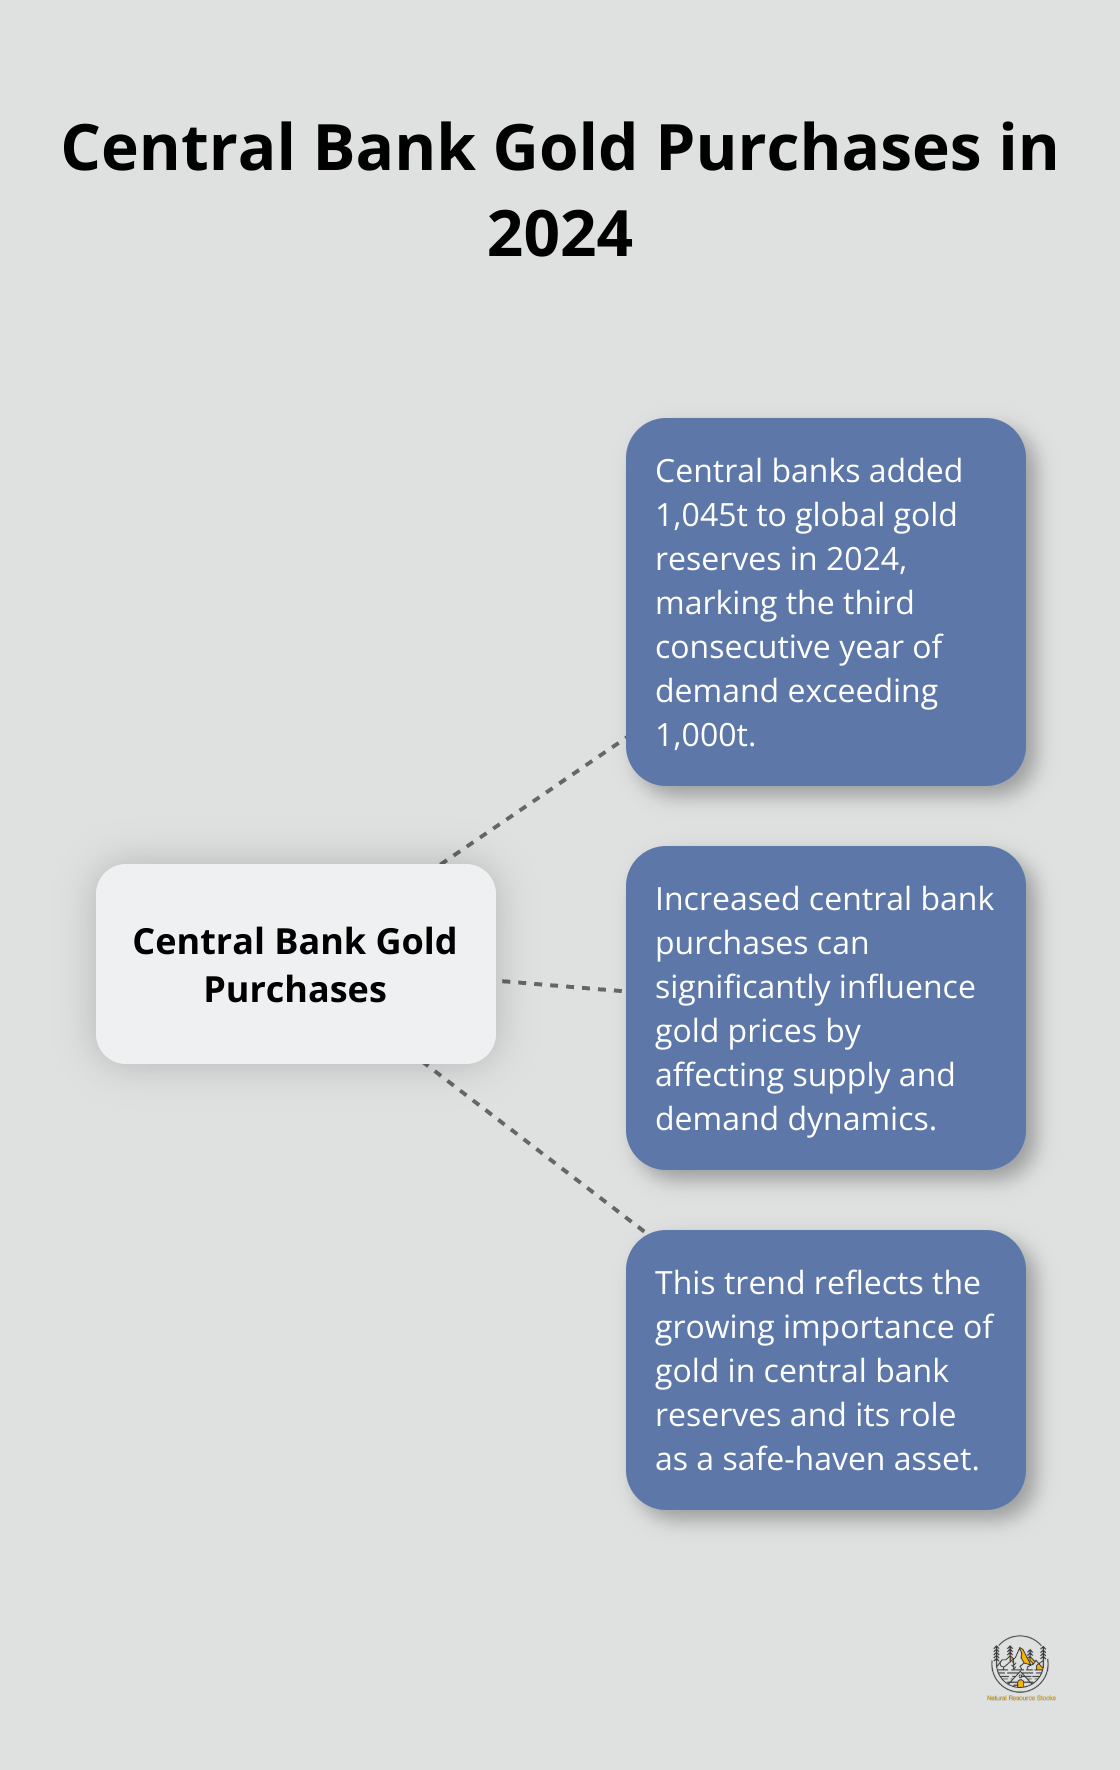
Central bank purchases have become a significant factor in recent years. According to the World Gold Council, central banks add 1,045t to global gold reserves in 2024, marking the third consecutive year of demand topping 1,000t.
Jewelry demand, particularly from countries like India and China, also influences gold prices. In 2022, jewelry consumption accounted for approximately 50% of gold demand, highlighting its importance in the market.
As we move forward to explore technical analysis tools for gold trading, it’s essential to keep these fundamental drivers in mind. Understanding the interplay between economic indicators, geopolitical events, and supply-demand dynamics provides a solid foundation for more advanced trading strategies.
How to Use Technical Analysis for Gold Trading
Technical analysis forms the backbone of many successful gold trading strategies. These tools can significantly enhance trading decisions when used correctly.
Moving Averages: The Trader’s Compass
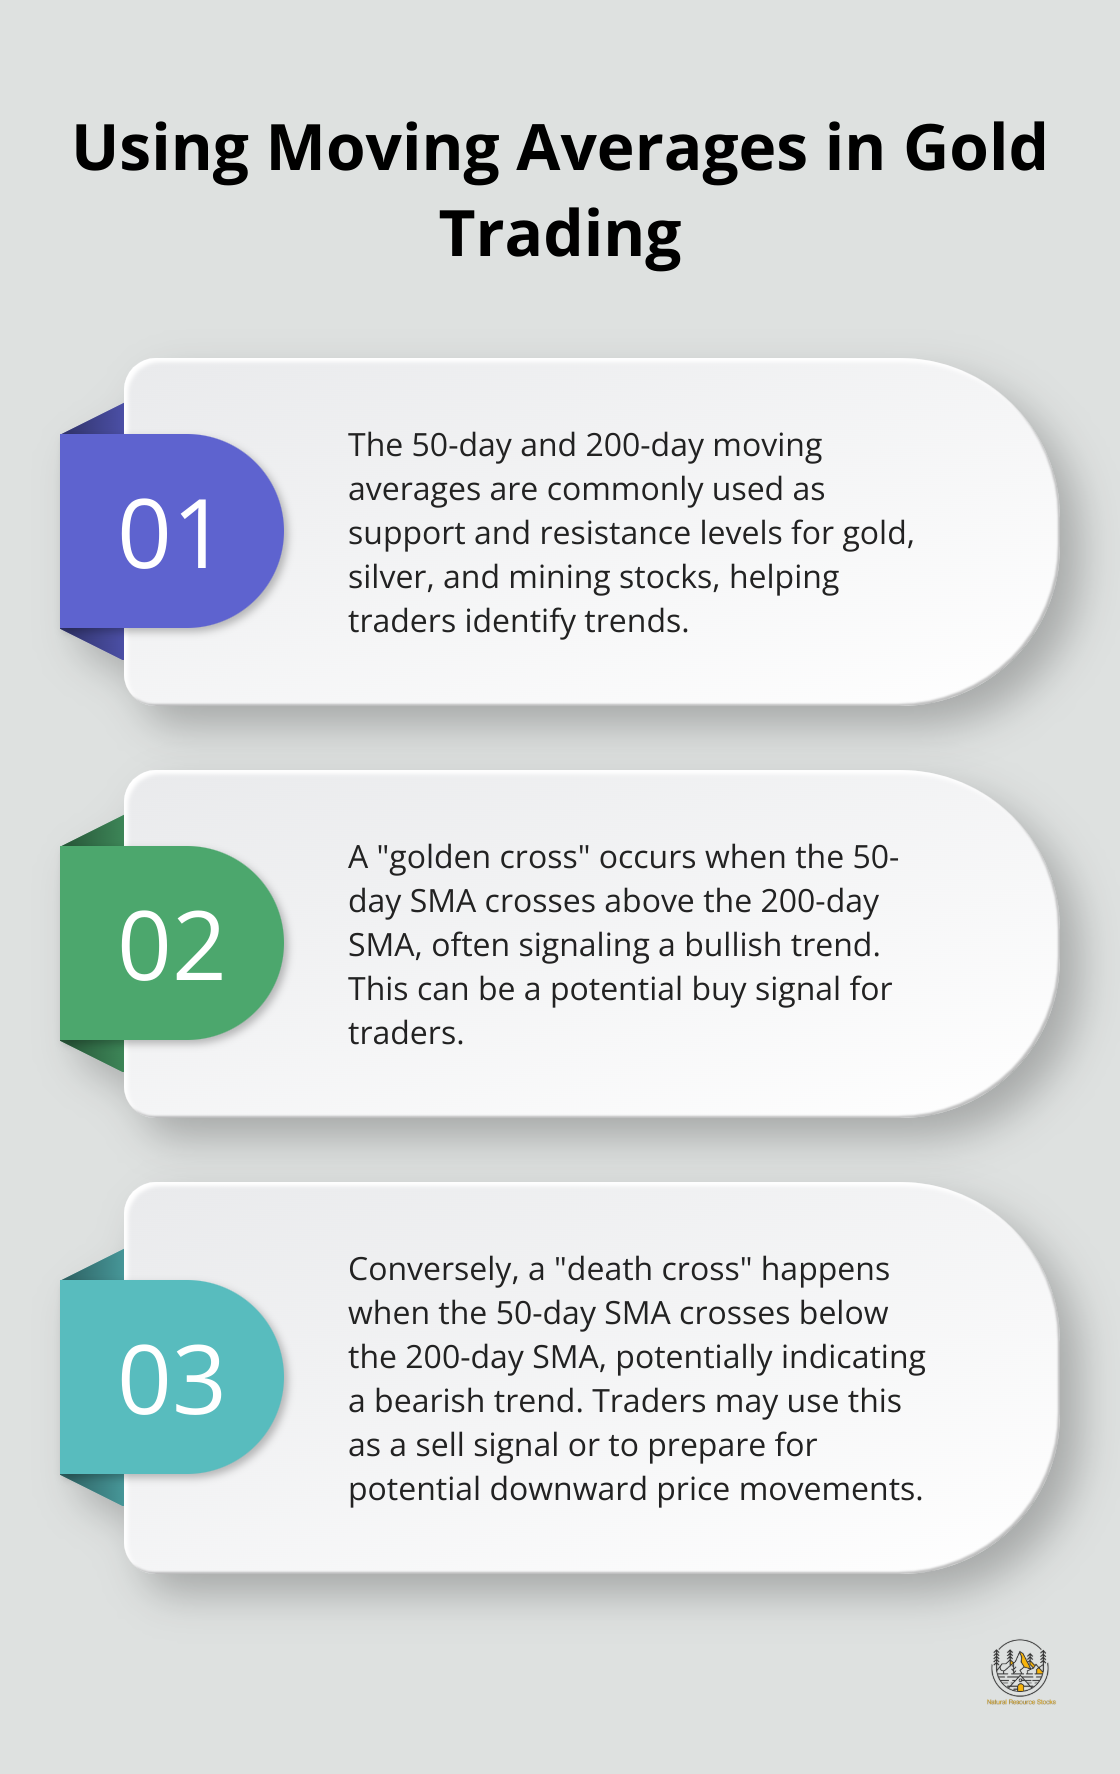
Moving averages are essential indicators for identifying trends in gold prices. The 50-day and 200-day moving averages are quite often used as support and resistance levels for gold, silver and mining stocks. A “golden cross” occurs when the 50-day SMA crosses above the 200-day SMA, often signaling a bullish trend. Conversely, a “death cross” happens when the 50-day SMA crosses below the 200-day SMA, potentially indicating a bearish trend.
For example, in August 2020, when gold prices hit their all-time high, the 50-day SMA was significantly above the 200-day SMA, confirming the strong uptrend. Traders who recognized this signal could have capitalized on the bullish momentum.
Fibonacci Retracements: Predicting Price Reversals
Fibonacci retracements are powerful tools for identifying potential support and resistance levels in gold prices. The 38.2%, 50%, and 61.8% levels are the most commonly watched zones for potential reversals. In an uptrend, traders look for price pullbacks as potential entry points.
During the gold price correction in 2013, the 61.8% Fibonacci retracement level (from the 2011 high to the 2008 low) acted as a strong support. Traders who identified this level could have anticipated the price bounce and positioned themselves accordingly.
RSI and Momentum Indicators: Timing Your Trades
The Relative Strength Index (RSI) measures the speed and change of price movements. For gold trading, an RSI reading above 70 typically indicates overbought conditions, while a reading below 30 suggests oversold conditions.
In March 2020, as gold prices plummeted due to the COVID-19 panic, the RSI dropped below 30, indicating oversold conditions. Traders who recognized this signal and bought gold at that point would have benefited from the subsequent price surge.
Another useful momentum indicator is the Moving Average Convergence Divergence (MACD). When the MACD line crosses above the signal line, it often indicates a bullish trend, while a crossover below the signal line may suggest a bearish trend.
Implementing these technical analysis tools in your gold trading strategy can significantly improve your decision-making process. However, it’s important to note that no single indicator is foolproof. Combining multiple indicators and considering fundamental factors will yield the most robust trading approach.
As we transition to the next chapter, we’ll explore how fundamental analysis complements these technical tools, providing a comprehensive approach to gold trading. Understanding both technical and fundamental aspects will equip traders with a well-rounded strategy for navigating the dynamic gold market.
How Fundamental Factors Shape Gold Trading
Central Bank Policies and Interest Rates
Central bank policies, especially those of the Federal Reserve, significantly influence gold price movements. Low interest rates decrease the opportunity cost of holding non-yielding assets like gold, often resulting in increased gold prices. Higher interest rates can make gold less attractive compared to interest-bearing assets.
In 2020, the Federal Reserve’s decision to maintain interest rates near zero (in response to the COVID-19 pandemic) contributed to gold’s rally to record highs. Traders who anticipated this policy move and its impact on gold prices positioned themselves to capitalize on the upward trend.
To stay ahead, monitor Federal Open Market Committee (FOMC) meetings and statements. The Fed’s dot plot (which shows policymakers’ projections for future interest rates) can provide valuable insights for gold traders. Additionally, pay attention to inflation data, as higher inflation expectations often lead to increased gold demand as a hedge.
Mining Company Reports and Production Data
Gold mining company reports offer important insights into supply dynamics. Key metrics to focus on include production volumes, all-in sustaining costs (AISC), and exploration results. If major gold producers report declining reserves or rising production costs, it could signal potential supply constraints, potentially supporting higher gold prices.
The World Gold Council’s quarterly Gold Demand Trends report is an essential resource for understanding global gold supply and demand dynamics. According to their data, annual mine production grew fractionally year-over-year in 2024. Traders who closely follow these trends can anticipate potential supply-driven price movements.
Global Demand Trends
Shifts in global gold demand are critical for predicting price movements. Key demand drivers include jewelry consumption, industrial use, and investment demand.
China and India (the world’s largest gold consumers) significantly influence global demand. Monitoring economic indicators and cultural factors in these countries can provide valuable insights into potential demand fluctuations.
Investment demand, particularly through gold-backed ETFs, has become increasingly important in recent years. Tracking these flows can offer early signals of changing market sentiment.
The integration of these fundamental analysis strategies with technical tools allows traders to develop a comprehensive approach to gold trading. Successful gold trading requires a holistic view of market dynamics, combining both technical and fundamental insights.
Final Thoughts
The best strategy for gold trading combines technical analysis with fundamental insights. Traders must understand market dynamics, economic indicators, and geopolitical factors that influence gold prices. Technical tools like moving averages and momentum indicators help identify potential entry and exit points, while fundamental analysis provides context for interpreting these signals.
Success in gold trading requires the integration of various analytical approaches. Traders should monitor central bank policies, interest rates, and global demand trends to develop a comprehensive understanding of market conditions. This holistic approach allows for better-informed decision-making and potentially more profitable trades.
Natural Resource Stocks provides investors with expert insights and in-depth market analysis to enhance their trading strategies. Our platform offers valuable resources on natural resource stocks, including gold, silver, and other precious metals. Continuous learning and market monitoring will help traders stay ahead in the dynamic gold market and potentially improve their trading outcomes.