


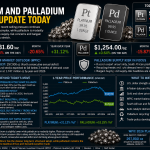

Platinum has experienced dramatic price swings over the past decade, from peaks above $1,700 per ounce to lows near $600. Understanding these movements requires analyzing both supply disruptions and shifting industrial demand patterns.
We at Natural Resource Stocks have tracked how automotive sector changes and South African mining challenges continue to shape platinum markets. This platinum price chart analysis reveals the key drivers behind these volatile trends.
What Drove Platinum’s Wild Price Swings Since 2014?
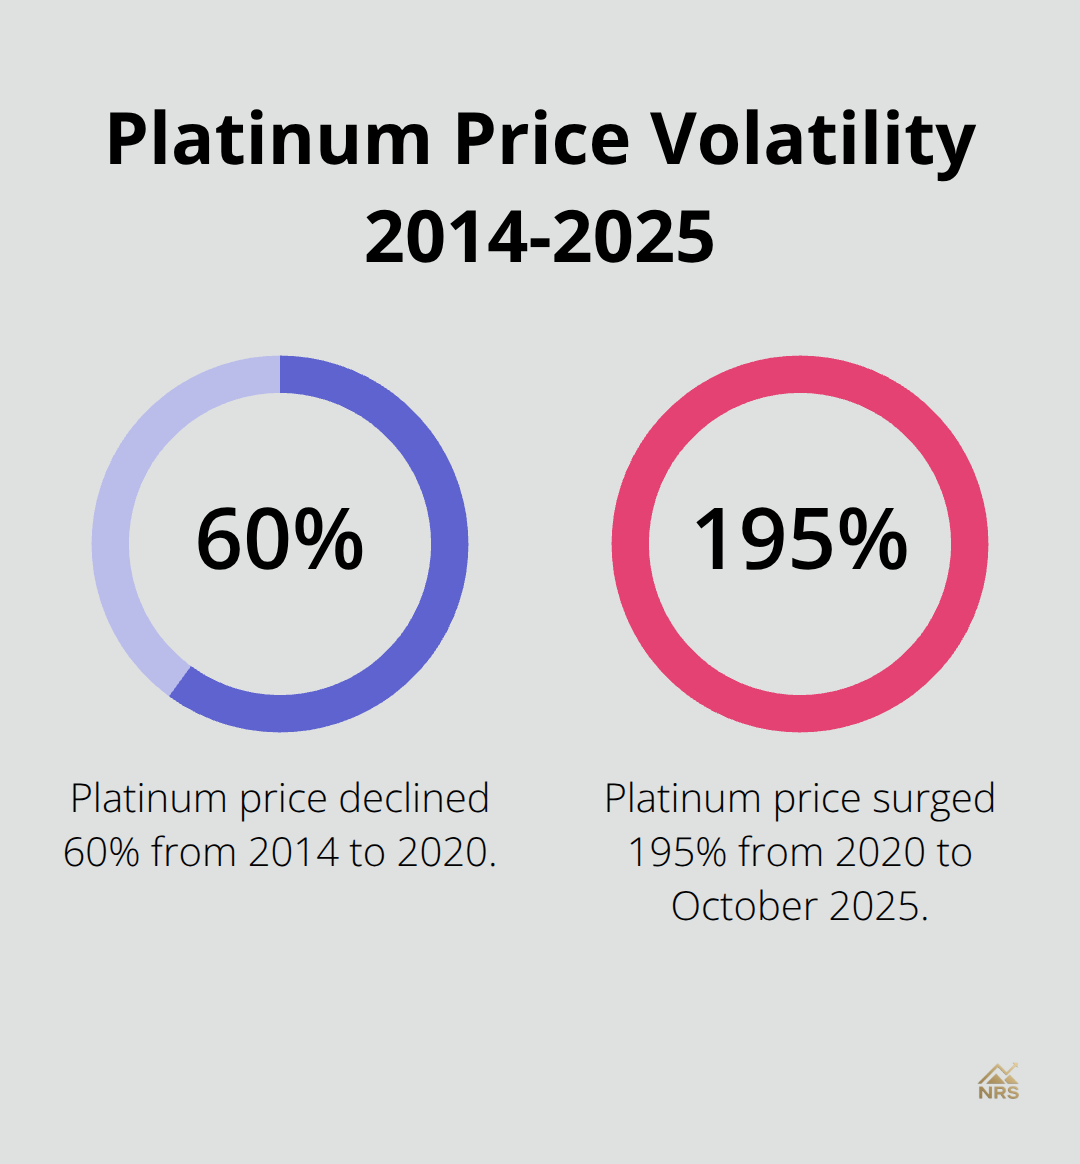
Platinum crashed from $1,400 per ounce in 2014 to devastating lows of $563 in March 2020, a 60% decline that shocked investors. The metal then surged 195% to reach $1,662 by October 2025, which created one of the most volatile decades in precious metals history.
The 2014-2016 collapse stemmed from diesel emissions scandals that destroyed automotive demand, while South African strikes reduced supply by 24% during the same period. The 2020 pandemic crash wiped out industrial demand overnight, but subsequent recovery proved explosive as supply deficits emerged.
South African Production Collapse Triggered Supply Crisis
South African platinum production fell consistently from 2018 through 2024 due to infrastructure problems and labor disputes. Anglo American Platinum reported production drops of 15% in 2023 alone, while Sibanye-Stillwater faced operational shutdowns that lasted months. These supply constraints coincided with China’s platinum jewelry demand increase of 26% in early 2025, which created the tightest market conditions since 2008. The World Platinum Investment Council documented supply deficits that are heading for a third consecutive annual deficit in 2025, with projections of an 850,000 ounce deficit, which forced above-ground inventories to four-month supply levels.
Platinum Crushed Gold and Silver Performance
While gold gained 45% from 2020-2025, platinum’s 195% surge left both precious metals far behind. Silver managed 78% gains during the same period, but platinum’s industrial applications drove superior performance as automotive catalyst demand recovered. Investment flows into platinum ETFs jumped 300% in Q1 2025 compared to previous years, as investors recognized the supply-demand imbalance. This performance divergence proves platinum’s dual nature as both precious metal and industrial commodity creates unique profit opportunities during supply shortages.
These dramatic price movements reflect deeper structural changes in platinum markets. Industrial demand patterns and supply chain vulnerabilities now shape price action more than traditional precious metal factors.
What Really Drives Platinum Price Swings
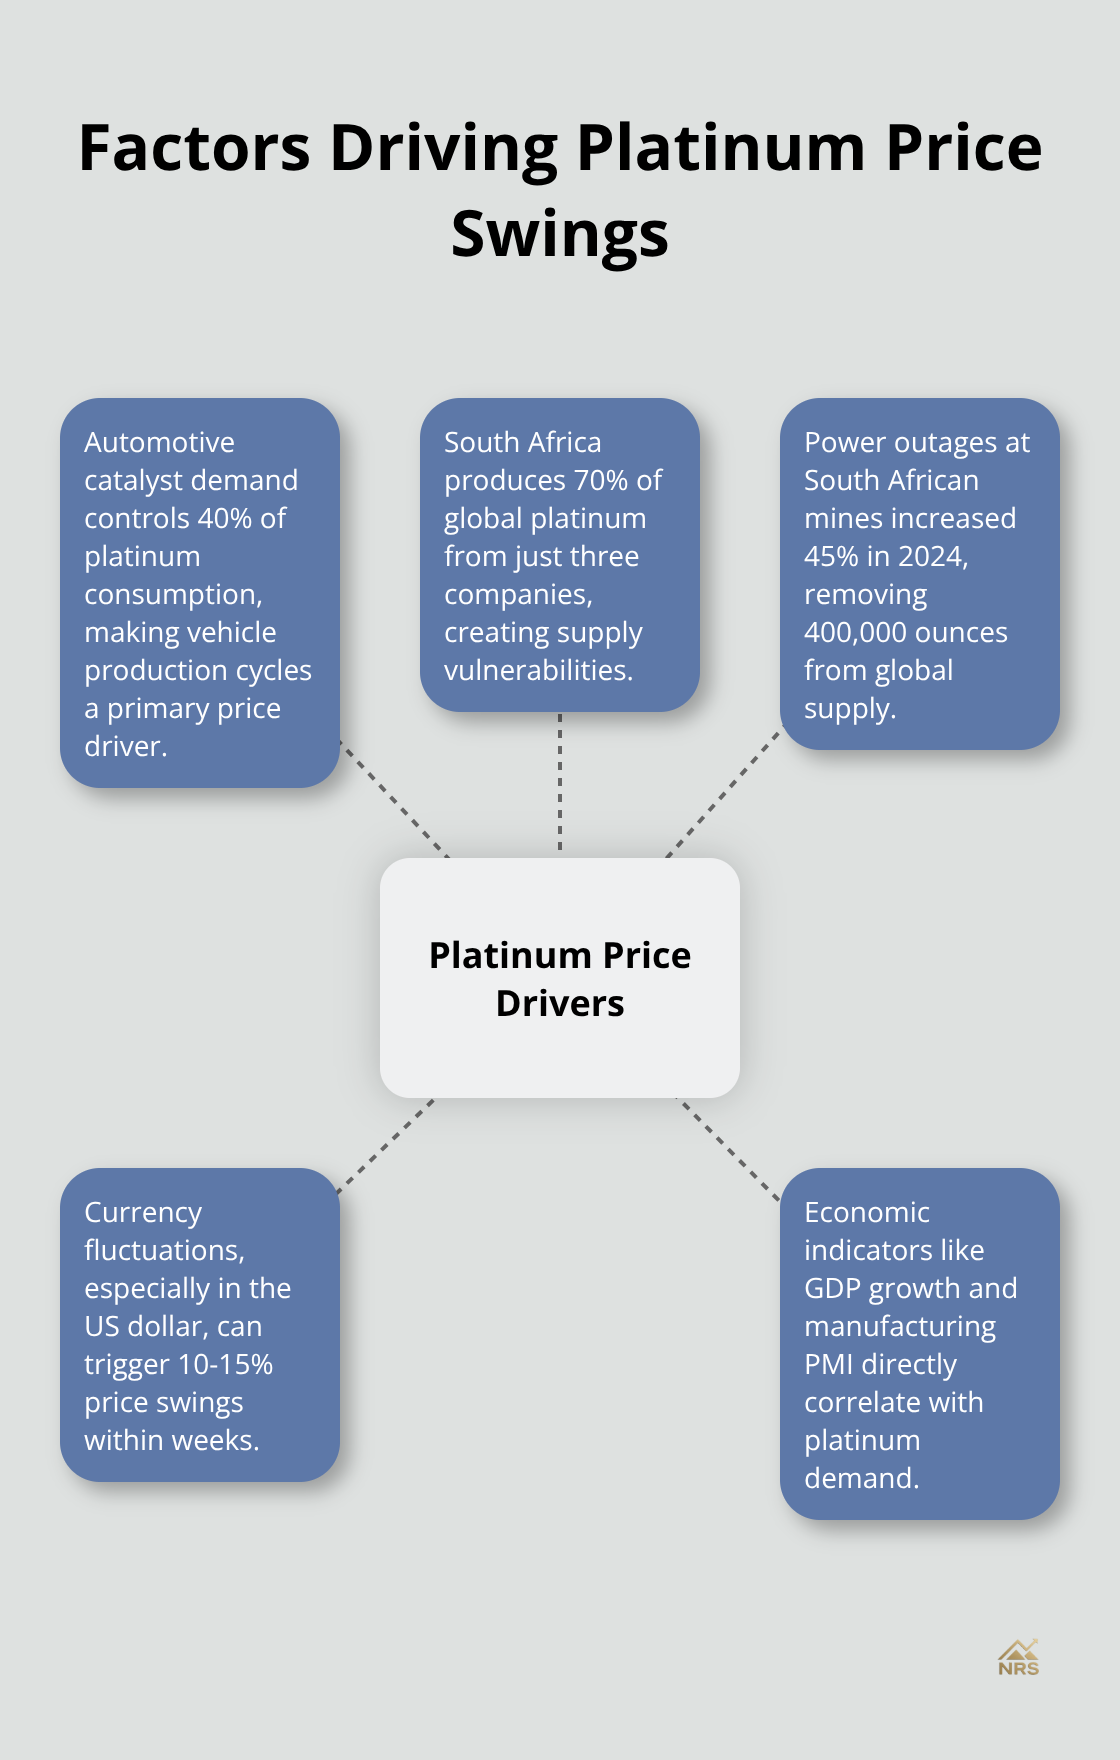
Automotive catalyst demand controls 40% of platinum consumption and makes vehicle production cycles the primary price driver. Gasoline engines require 3-7 grams of platinum per vehicle for catalytic converters, while diesel engines need 7-15 grams (according to Johnson Matthey data). Chinese auto production increased 12% in 2024 and directly boosted platinum demand by 180,000 ounces. Ford and General Motors implemented catalyst programs that reduced platinum content by 20% per vehicle since 2020, but total vehicle volume growth offset these efficiency gains.
South African Mining Crisis Threatens Global Supply
South Africa produces 70% of global platinum from just three companies: Anglo American Platinum, Impala Platinum, and Sibanye-Stillwater. Power outages at South African mines increased 45% in 2024 and forced production cuts that removed 400,000 ounces from global supply. Anglo American Platinum reported costs jumped 18% year-over-year due to electricity shortages and infrastructure failures. Russian platinum exports dropped 25% after sanctions, which removed another 200,000 ounces from markets and pushed total supply down 8% in 2024.
Currency Movements Amplify Price Volatility
Platinum trades in US dollars and makes currency fluctuations critical for international demand. The South African rand weakened 15% against the dollar in 2024, which reduced local costs but increased export competitiveness. Chinese yuan strength boosted platinum jewelry demand and made imports 12% cheaper for local consumers. Dollar strength historically reduces platinum prices by 3-5% for every 1% currency move, according to World Platinum Investment Council analysis. Industrial buyers hedge currency exposure through futures contracts, but investment demand remains vulnerable to dollar volatility that can trigger 10-15% price swings within weeks.
Economic Indicators Shape Market Sentiment
Global GDP growth directly correlates with platinum demand since industrial applications drive 60% of consumption. Manufacturing PMI readings below 50 typically signal platinum price weakness as factory output declines. Interest rate changes affect platinum investment flows, with rate cuts often spurring precious metals demand as investors seek alternatives to bonds. Inflation expectations also influence platinum prices, as the metal serves as a hedge against currency debasement during periods of monetary expansion.
These fundamental drivers create the foundation for platinum’s price movements, but current market conditions reveal how these forces interact in today’s economy.
How Platinum Trades in Today’s Market
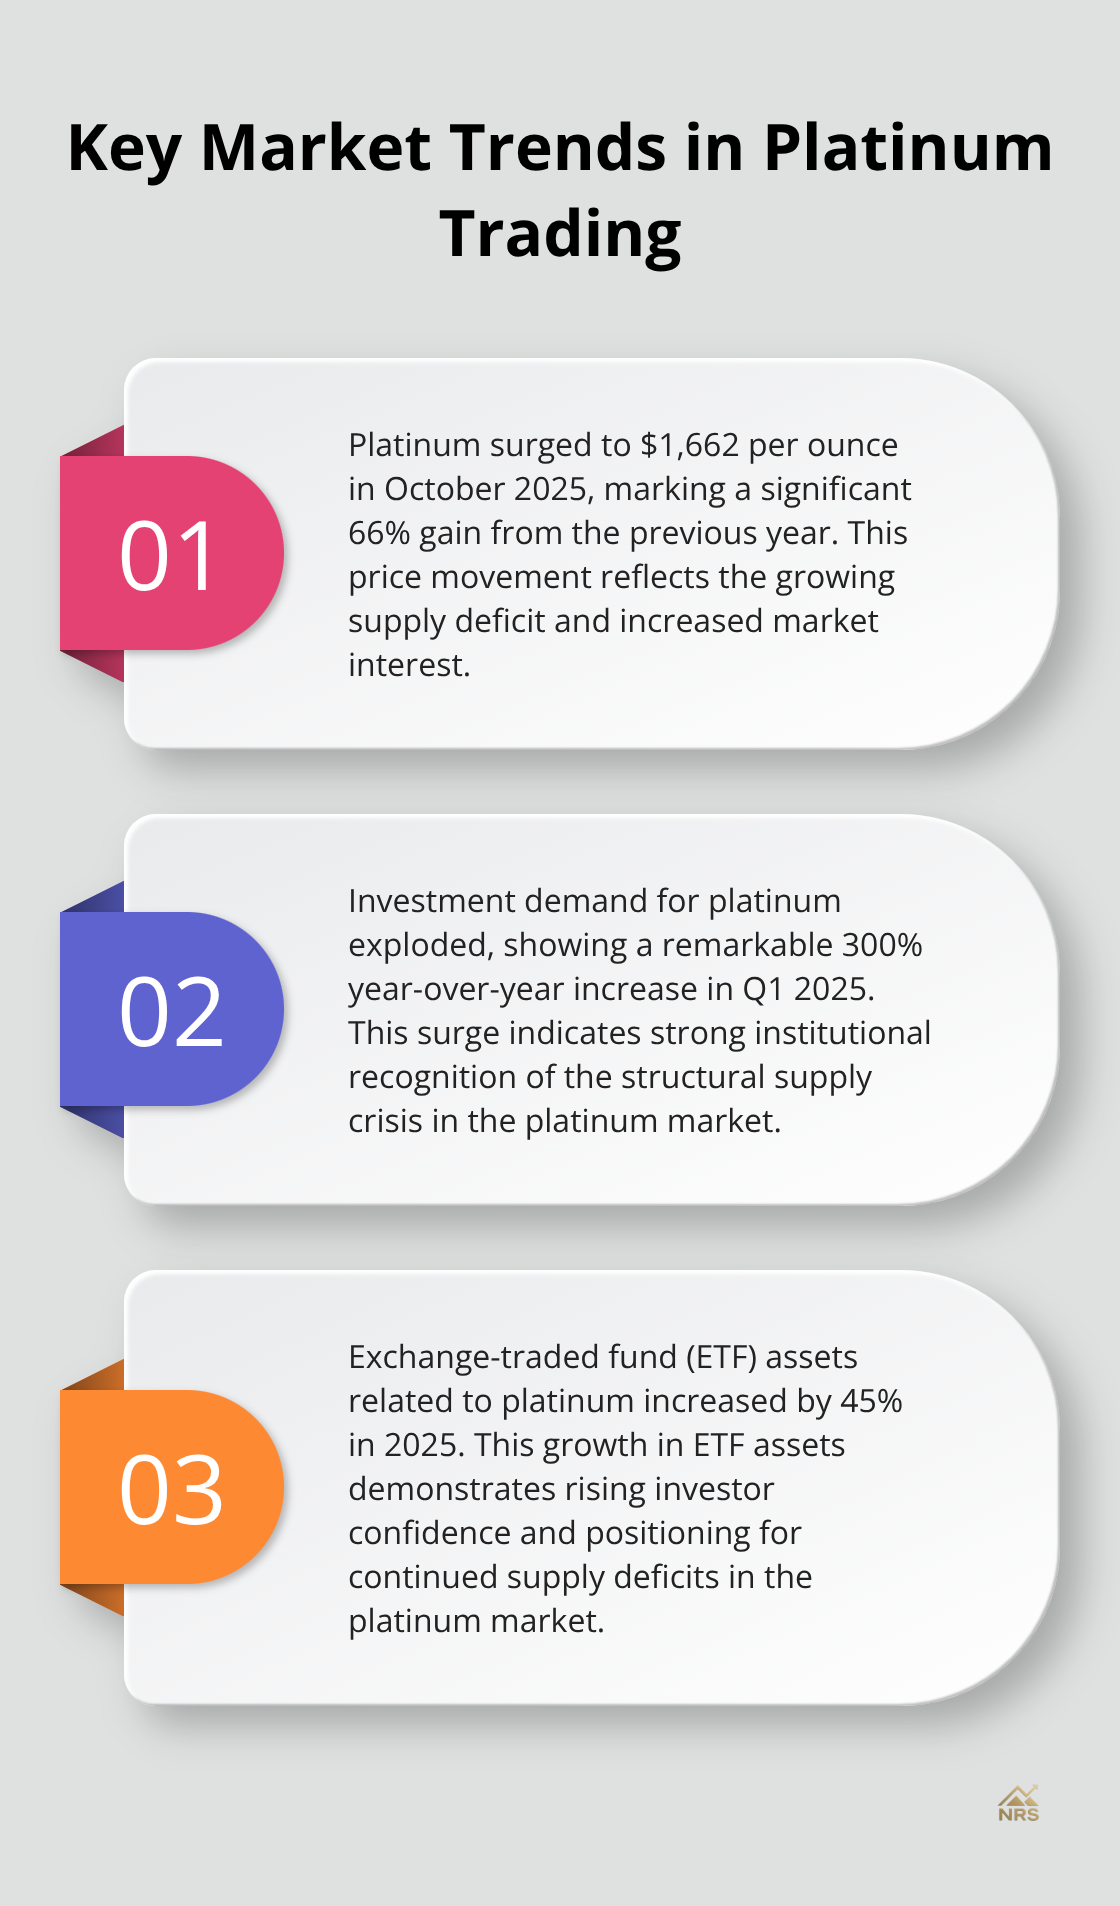
Platinum surged to $1,662 per ounce in October 2025, which marks a 66% gain from the previous year as supply deficits reached critical levels. The World Platinum Investment Council reported a supply shortage with a third consecutive annual deficit. This shortage pushed above-ground inventories to dangerously low four-month coverage levels.
Investment demand exploded 300% year-over-year in Q1 2025 as institutional buyers recognized the structural supply crisis. China became the world’s largest platinum consumer with imports that rose dramatically throughout the year.
Electric Vehicles Create Mixed Demand Signals
Electric vehicle adoption threatens platinum’s automotive catalyst market, but hybrid vehicle sales actually boost platinum demand in the short term. Toyota and Honda hybrid models require 2-4 grams of platinum per vehicle for gasoline engines. Pure electric vehicles need zero platinum for propulsion.
Global EV sales reached 14 million units in 2024, but hybrid sales grew 28% to 4.5 million units (according to BloombergNEF data). The transition timeline matters more than final outcomes since hybrid vehicles bridge the gap for another decade. Hydrogen fuel cell vehicles could create massive new platinum demand of 30-60 grams per vehicle.
Johnson Matthey projects automotive catalyst demand will remain stable through 2030 before it declines. This projection gives platinum investors a clear timeframe for industrial demand shifts.
Investment Flows Dominate Price Action
Institutional money now drives platinum prices more than industrial demand as supply shortages attract hedge fund attention. The platinum-to-gold ratio signals platinum’s relative undervaluation compared to gold’s record highs. This ratio indicates platinum’s positioning against gold’s elevated price levels.
Exchange-traded fund assets increased 45% in 2025 as investors positioned for supply deficit continuation. Futures data shows record net-long positions from managed money accounts.
Chinese Demand Shifts Market Dynamics
Chinese jewelry demand jumped 26% in Q1 2025 as consumers shifted from expensive gold to relatively cheaper platinum. This shift created unexpected physical demand that caught markets off-guard. The price acceleration exceeded technical projections as physical buyers competed with investment flows for limited supply.
Chinese industrial demand also strengthened as manufacturing activity recovered from previous slowdowns. Chemical and petroleum refinery applications consumed additional platinum volumes throughout 2025.
Final Thoughts
Platinum’s price chart shows a decade of extreme volatility that supply disruptions and industrial demand shifts drove. The metal crashed 60% from 2014 to 2020, then surged 195% through 2025 as South African production collapsed and investment flows accelerated. These dramatic swings reflect platinum’s unique position as both precious metal and industrial commodity.
We at Natural Resource Stocks see that platinum’s current supply deficit creates compelling investment opportunities. The World Platinum Investment Council projects continued shortages through 2029, while above-ground inventories sit at critically low four-month coverage levels (equivalent to just 120 days of global consumption). Chinese demand growth and hybrid vehicle adoption provide additional support despite long-term electric vehicle threats.
Smart investors monitor South African production data, automotive catalyst demand trends, and currency movements that amplify price volatility. The platinum-to-gold ratio signals potential undervaluation compared to gold’s record highs. For comprehensive analysis of natural resource markets and expert insights into commodity investments, explore Natural Resource Stocks for detailed market coverage across metals and energy sectors.