


Gold prices surged 27% in 2024, driven by central bank purchases and inflation concerns. Mining stocks followed this momentum with mixed results across different regions.
We at Natural Resource Stocks see significant opportunities ahead as market conditions shift. This gold stocks outlook examines the key factors shaping 2025 investment decisions.
What Drives Gold Performance Right Now
Gold hit record highs above $2,900 per ounce in February 2025, which marks its fourth strongest annual return since 1971. The World Gold Council reports investment flows into gold ETFs totaled $77 billion in 2025, and these flows added over 700 tons to holdings. Central bank purchases exceeded 1,000 tons for the third consecutive year, as emerging market banks diversify away from dollar reserves. J.P. Morgan projects gold will average $3,675 per ounce by Q4 2025, with potential to reach $4,000 by mid-2026.
Federal Reserve Policy Creates Volatility
Interest rate cuts enhance gold’s appeal as a non-yield asset. Lower rates reduce opportunity costs of gold ownership and drive institutional demand higher. The Federal Reserve’s dovish stance amid inflation concerns supports precious metals prices. Rate sensitivity will continue as monetary policy shifts impact dollar strength and real yields.
Geopolitical Tensions Fuel Safe Haven Demand
Trade uncertainty and geopolitical risks contributed to gold’s remarkable year-to-date return, with gold achieving over 50 all-time highs and returning over 60%. Dollar weakness added another 10 percentage points to performance. Poland, Turkey, India, China, and Iraq led central bank purchases in 2024. Non-commercial futures positions on COMEX reached record highs, which indicates strong investor expectations.
Investment Demand Reaches New Heights
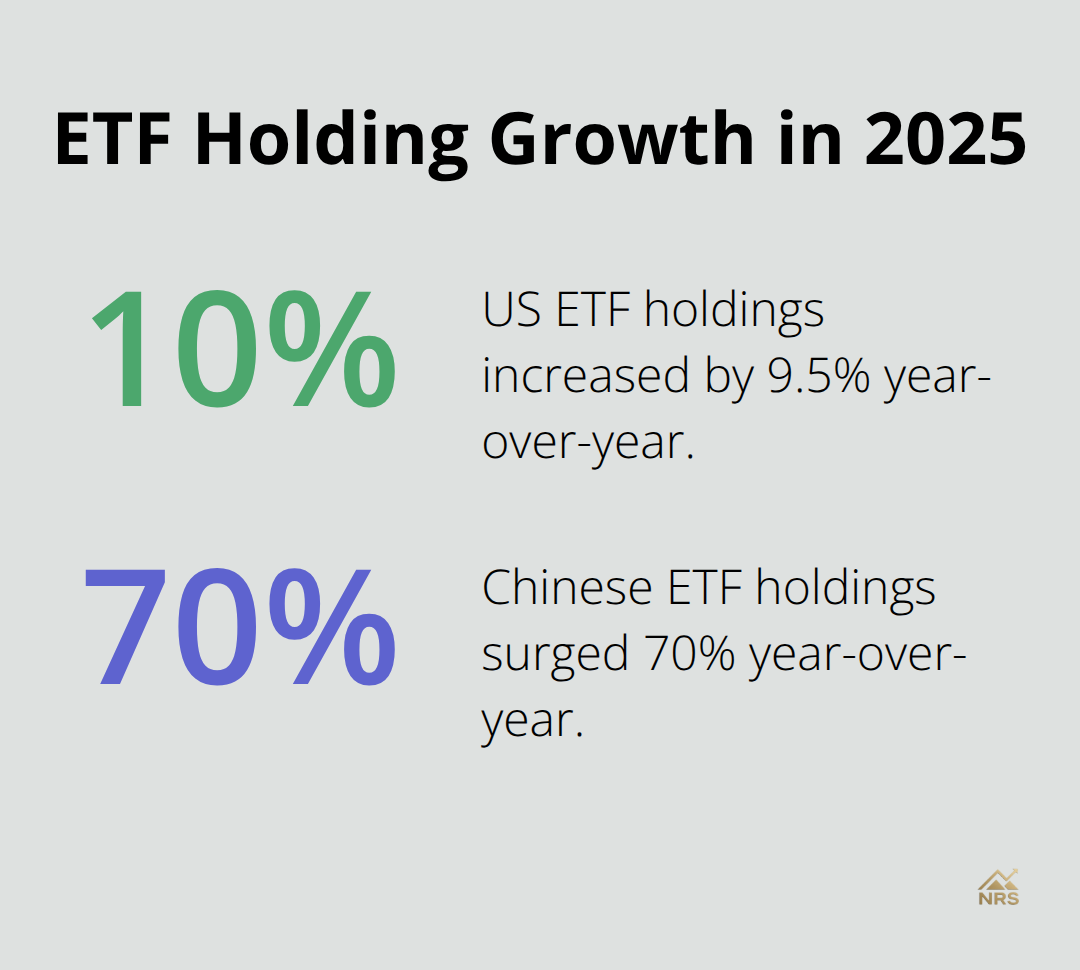
Bar and coin holdings increased to 49,400 tons with notional value that rose to $4.2 trillion. Quarterly demand hit record volumes in Q3 2025 amid dollar weakness and political uncertainty. US ETF holdings increased by 9.5% while Chinese holdings surged 70% year-over-year. These investment patterns reveal how institutional and retail investors position themselves for continued market volatility.
The performance drivers that fuel gold’s current rally also shape the outlook for individual mining companies and their stock valuations.
Which Gold Stocks Lead the Market
Gold stocks delivered exceptional returns in 2025, with the gold sector posting nearly 90% year-to-date gains while most other sectors in the S&P 500 are struggling. The $554.59 billion gold sector employs 159,658 people across companies that range from established giants to emerging producers. Newmont Corporation dominates with a 55.63% market weight and $98.60 billion market cap, while analysts set a $104.78 target price above its current $89.76.
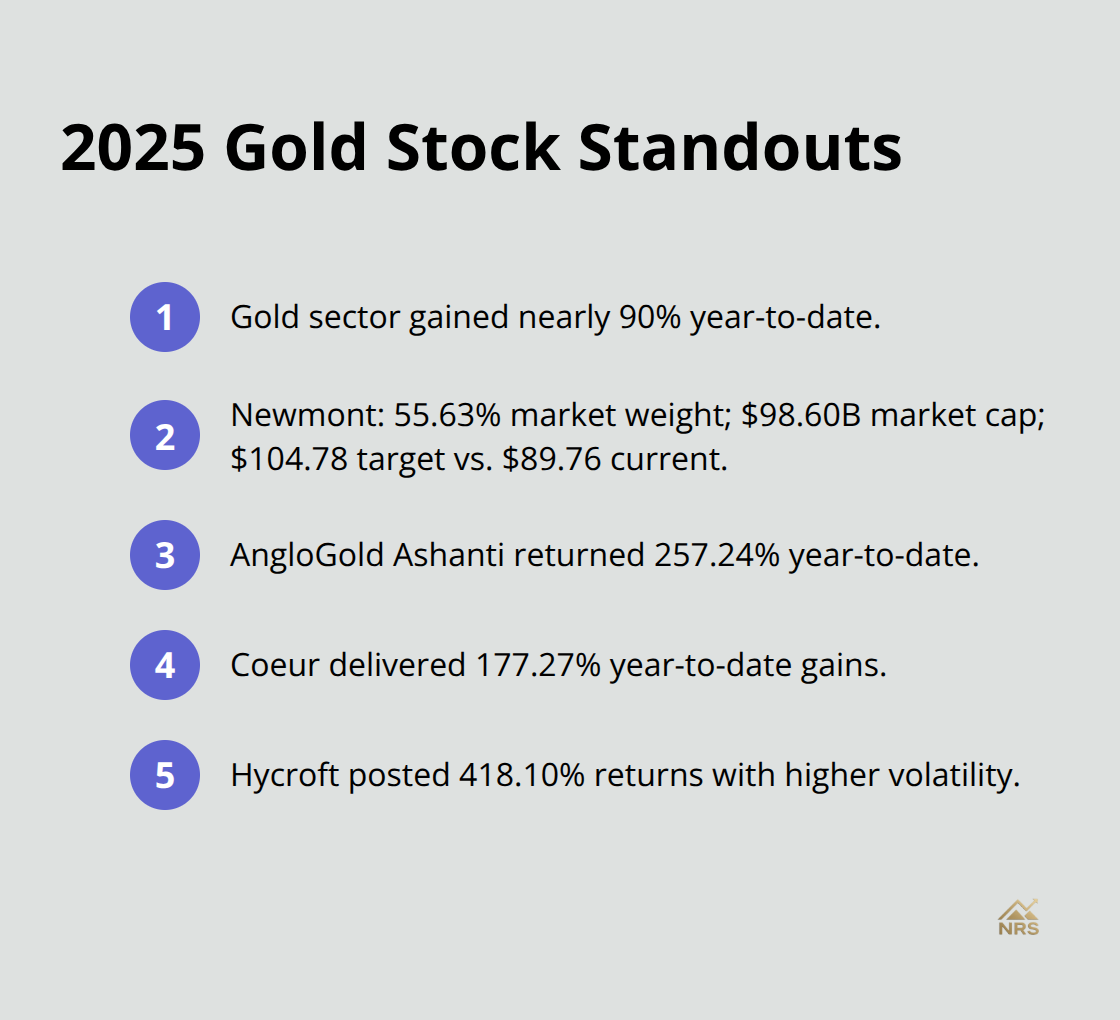
AngloGold Ashanti achieved remarkable 257.24% year-to-date returns, and Coeur delivered 177.27% gains. Hycroft stands out with 418.10% returns, though higher volatility accompanies these dramatic gains.
Geographic Diversification Drives Performance
Operations across different regions offer varied risk-return profiles that smart investors leverage. Australia and Canada provide stable regulatory environments with established infrastructure, while African operations in Ghana and South Africa offer higher production potential despite political risks. Wheaton Precious Metals received a Morningstar target price increase to $119.00, which reflects strong performance across multiple geographic regions. Eldorado Gold’s target price rose to $34.00 from Argus analysts, supported by operations in Turkey, Greece, and Canada. Agnico Eagle Mines earned a $187.00 target price upgrade based on Canadian and Finnish mine performance. Production costs vary significantly by region (North American operations average $1,200-$1,400 per ounce while some African mines operate below $900 per ounce).
Emerging Producers Target Growth Markets
Smaller companies focus on high-grade deposits and cost-efficient extraction methods that larger producers often overlook. These companies benefit from technological advances in extraction while they maintain lower overhead costs than industry giants. Geographic expansion into underexplored regions like Central Asia and parts of Africa creates opportunities for resource discovery and production growth. Production efficiency improvements through automation and data analytics help emerging miners compete effectively against established players while they maintain attractive profit margins.
Technology Transforms Operations
Advanced extraction technologies may boost gold extraction efficiency by up to 30% compared to traditional methods. Automation systems optimize ore processing and reduce labor expenses (particularly important as skilled worker shortages affect the industry). Data analytics platforms help companies identify optimal extraction zones and predict equipment maintenance needs. These technological improvements position both large and small producers to maintain competitiveness as gold prices fluctuate and operational challenges evolve into 2026.
What Drives Gold Stock Predictions for 2025
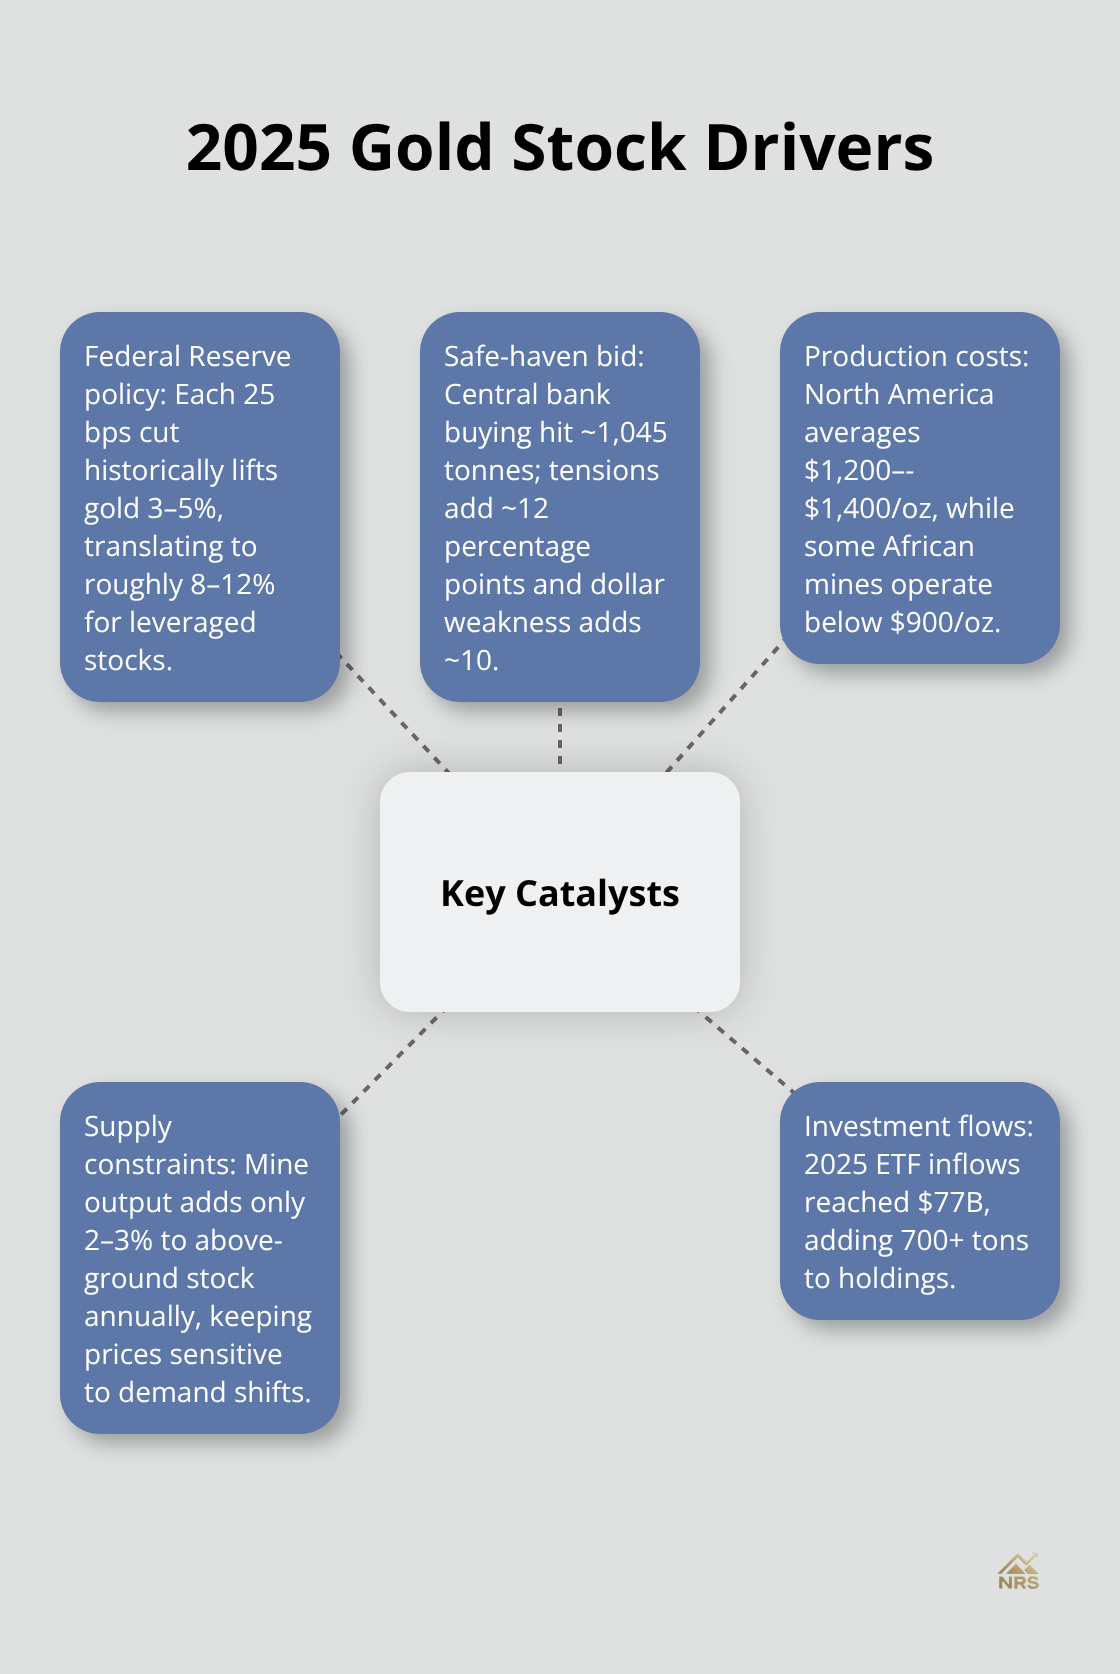
The Federal Reserve’s monetary policy trajectory creates the most significant catalyst for gold stock performance in 2025. J.P. Morgan Research projects gold prices will average $3,675 per ounce by Q4 2025, with potential increases toward $4,000 by mid-2026. Interest rate cuts amplify gold’s appeal as central banks maintain dovish stances amid persistent inflation concerns. Each 25 basis point rate reduction historically correlates with 3-5% gold price increases, which translates to 8-12% gains for leveraged stocks. The World Gold Council data shows investment flows into gold ETFs reached $77 billion in 2025, which added over 700 tons to holdings as institutional demand accelerates.
Production Costs Pressure Margins
Energy expenses and labor shortages push all-in costs higher across the industry. North American operations average $1,200-$1,400 per ounce while African mines operate below $900 per ounce (this creates geographic arbitrage opportunities for smart investors).
Supply chain disruptions increase equipment delivery times by 6-8 months, which forces miners to maintain higher inventory levels and capital requirements. Companies with established supplier relationships and regional diversification outperform single-geography operators by 15-20% during disruption periods.
Safe Haven Demand Accelerates
Central bank purchases reached an estimated 1045 tonnes in 2024, following 2022’s record 1136 tonnes. Poland, Turkey, India, China, and Iraq continue aggressive accumulation programs that support price floors. Tensions contribute approximately 12 percentage points to gold’s year-to-date return, while dollar weakness adds another 10 percentage points. Gold stocks with exposure to multiple jurisdictions and established government relationships position themselves advantageously as institutional demand grows through economic uncertainty periods.
Supply Constraints Support Prices
Global gold production contributes only 2-3% annually to above-ground stock, which makes prices sensitive to demand changes. Environmental regulations and extraction costs challenge future supply growth across major producers. Companies that control high-grade deposits and efficient extraction methods maintain competitive advantages as supply tightens. Production efficiency improvements through automation help miners compete effectively while they maintain attractive profit margins despite cost pressures.
Final Thoughts
The gold stocks outlook for 2025 presents compelling opportunities as multiple catalysts align. Gold prices reached $3,500 per ounce with J.P. Morgan projecting $4,000 by mid-2026, while the sector delivered 135% year-to-date returns compared to the S&P 500’s 16%. Central bank purchases exceed 1,000 tons annually and $77 billion in ETF inflows demonstrate sustained institutional demand.
Federal Reserve rate cuts reduce opportunity costs for non-yield assets, while geopolitical tensions maintain safe-haven appeal. Production constraints and higher extraction costs support price floors as global output adds only 2-3% to existing supply annually (making prices sensitive to demand changes). Risk factors include potential policy reversals that could strengthen the dollar and reduce inflation concerns.
Portfolio allocation should balance established producers like Newmont with smaller companies that offer higher growth potential. Geographic spread across stable jurisdictions reduces political risk while maintaining exposure to cost-efficient operations. We at Natural Resource Stocks provide comprehensive analysis across metals and energy sectors through expert video content, market insights, and macroeconomic commentary.