


Silver prices swing wildly based on industrial demand, investment flows, and global economic shifts. At Natural Resource Stocks, we’ve found that successful investors combine technical analysis with macroeconomic insights to anticipate silver spot price movements.
This guide walks you through the key drivers and forecasting methods that separate informed traders from reactive ones. You’ll learn which tools actually work and how to apply them to your own analysis.
What Actually Drives Silver Prices
Industrial demand has become the dominant force behind silver prices, and the numbers prove it. According to the Silver Institute, industrial use now represents over 50% of total silver consumption for the second consecutive year, making it the primary price driver rather than investment flows. Solar panels alone consumed over 25% of global silver supply in 2024, with demand rising again in 2025.
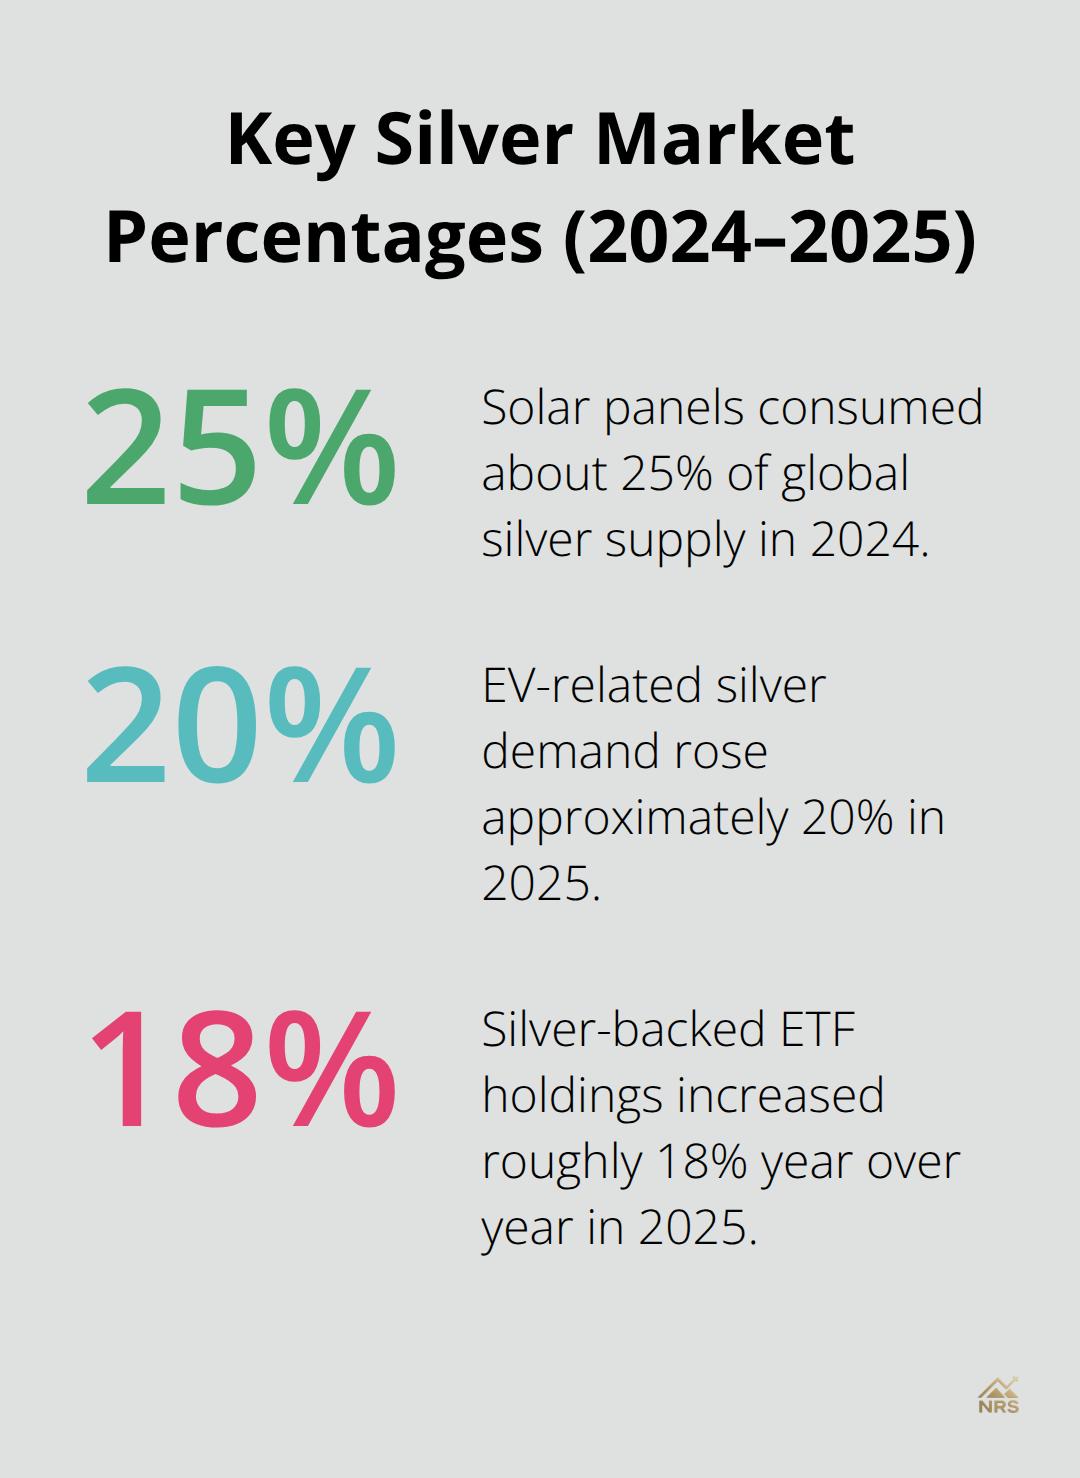
Each solar panel requires roughly 20 grams of silver, and as solar installations accelerate globally, this structural demand floor strengthens continuously. The Silver Institute projects that solar demand will nearly double its silver offtake between 2020 and 2030, while electric vehicles will consume 725 million ounces annually by 2030. Beyond renewables, AI data centers and advanced electronics added substantial demand in 2025, with EV-related silver demand up approximately 20% and data-center components driving additional consumption.
US data centers will drive electricity demand growth of about 22% over the next decade, with AI-driven electricity demand rising roughly 31% over the same period. This means silver demand from cleantech infrastructure is essentially locked in for years regardless of economic cycles. The US government reinforced this reality when it added silver to its critical minerals list in 2025, signaling stronger policy support for silver’s role in technology and energy transitions.
Supply Cannot Keep Pace with Demand
The supply side reveals why silver prices have room to run much higher. Metal Focus projects a 63.4 million ounce supply deficit in 2025, narrowing only slightly to about 30.5 million ounces in 2026, marking the fifth straight year of deficits. Here’s the critical constraint: roughly 75% of silver comes from by-product mining of other metals like copper and zinc, which means miners have minimal incentive to boost pure-silver output even when prices spike.
Bringing a new silver deposit from discovery to production takes 10 to 15 years, so higher prices cannot quickly translate into increased supply. Mexico’s production has declined due to strike impacts and lower-grade ore, further tightening global supplies. Above-ground silver stocks continue shrinking, and Shanghai Futures Exchange inventories recently hit their lowest level since 2015, indicating physical scarcity is real. This structural supply-demand imbalance is the core reason forecasters from Citigroup to independent analysts project silver reaching 70 dollars per ounce or higher in 2026.
Investment Demand Signals Shift Direction
Investment flows matter far less than industrial demand, but they amplify price moves when they turn positive. Silver-backed ETFs attracted roughly 130 million ounces of inflows in 2025, with total holdings rising to approximately 844 million ounces-a roughly 18% year-over-year increase. This reversal from earlier investor indifference suggests institutional capital is returning to silver as both a monetary hedge and an industrial play.
Safe-haven demand accelerated as expectations for multiple rate cuts in 2026 took hold, combined with a softer US dollar outlook and lower real yields. When investors recognize that silver is simultaneously a scarce industrial input and a defensive asset, price momentum tends to accelerate sharply. This dual identity positions silver uniquely to outperform when both industrial demand and inflation or monetary conditions align favorably.
What This Means for Your Forecasting
These three forces-industrial demand locked in by cleantech infrastructure, constrained supply that cannot respond quickly to price spikes, and returning investment capital-create the foundation for your price forecasts. Understanding which force dominates in any given period helps you anticipate whether silver will move on macro sentiment shifts or on structural demand strength. The next section shows you which technical tools help you identify when these forces are actually shifting the market.
Which Technical Signals Actually Predict Silver Price Moves
Moving Averages Confirm Structural Trends
Moving averages work best when combined with the supply-demand reality we covered earlier rather than used in isolation. The 50-day and 200-day moving averages filter out daily noise and reveal whether the underlying structural deficit pushes prices higher or whether a temporary macro shock distorts the trend. When silver’s price sits above both the 50-day and 200-day moving averages, the uptrend reflects real supply tightness, not speculative fervor. If silver breaks below the 200-day moving average, it signals that macro headwinds have temporarily overcome the structural deficit, and you should wait for confirmation that industrial demand remains intact before assuming the bull market has ended.
Trend lines drawn from the December 2024 lows through subsequent price highs show that silver established a clear uptrend channel. Every time silver tested the lower boundary of that channel in 2025, buyers stepped in immediately. This behavior confirms that large institutions recognize the supply deficit and treat significant pullbacks as buying opportunities rather than trend reversals.
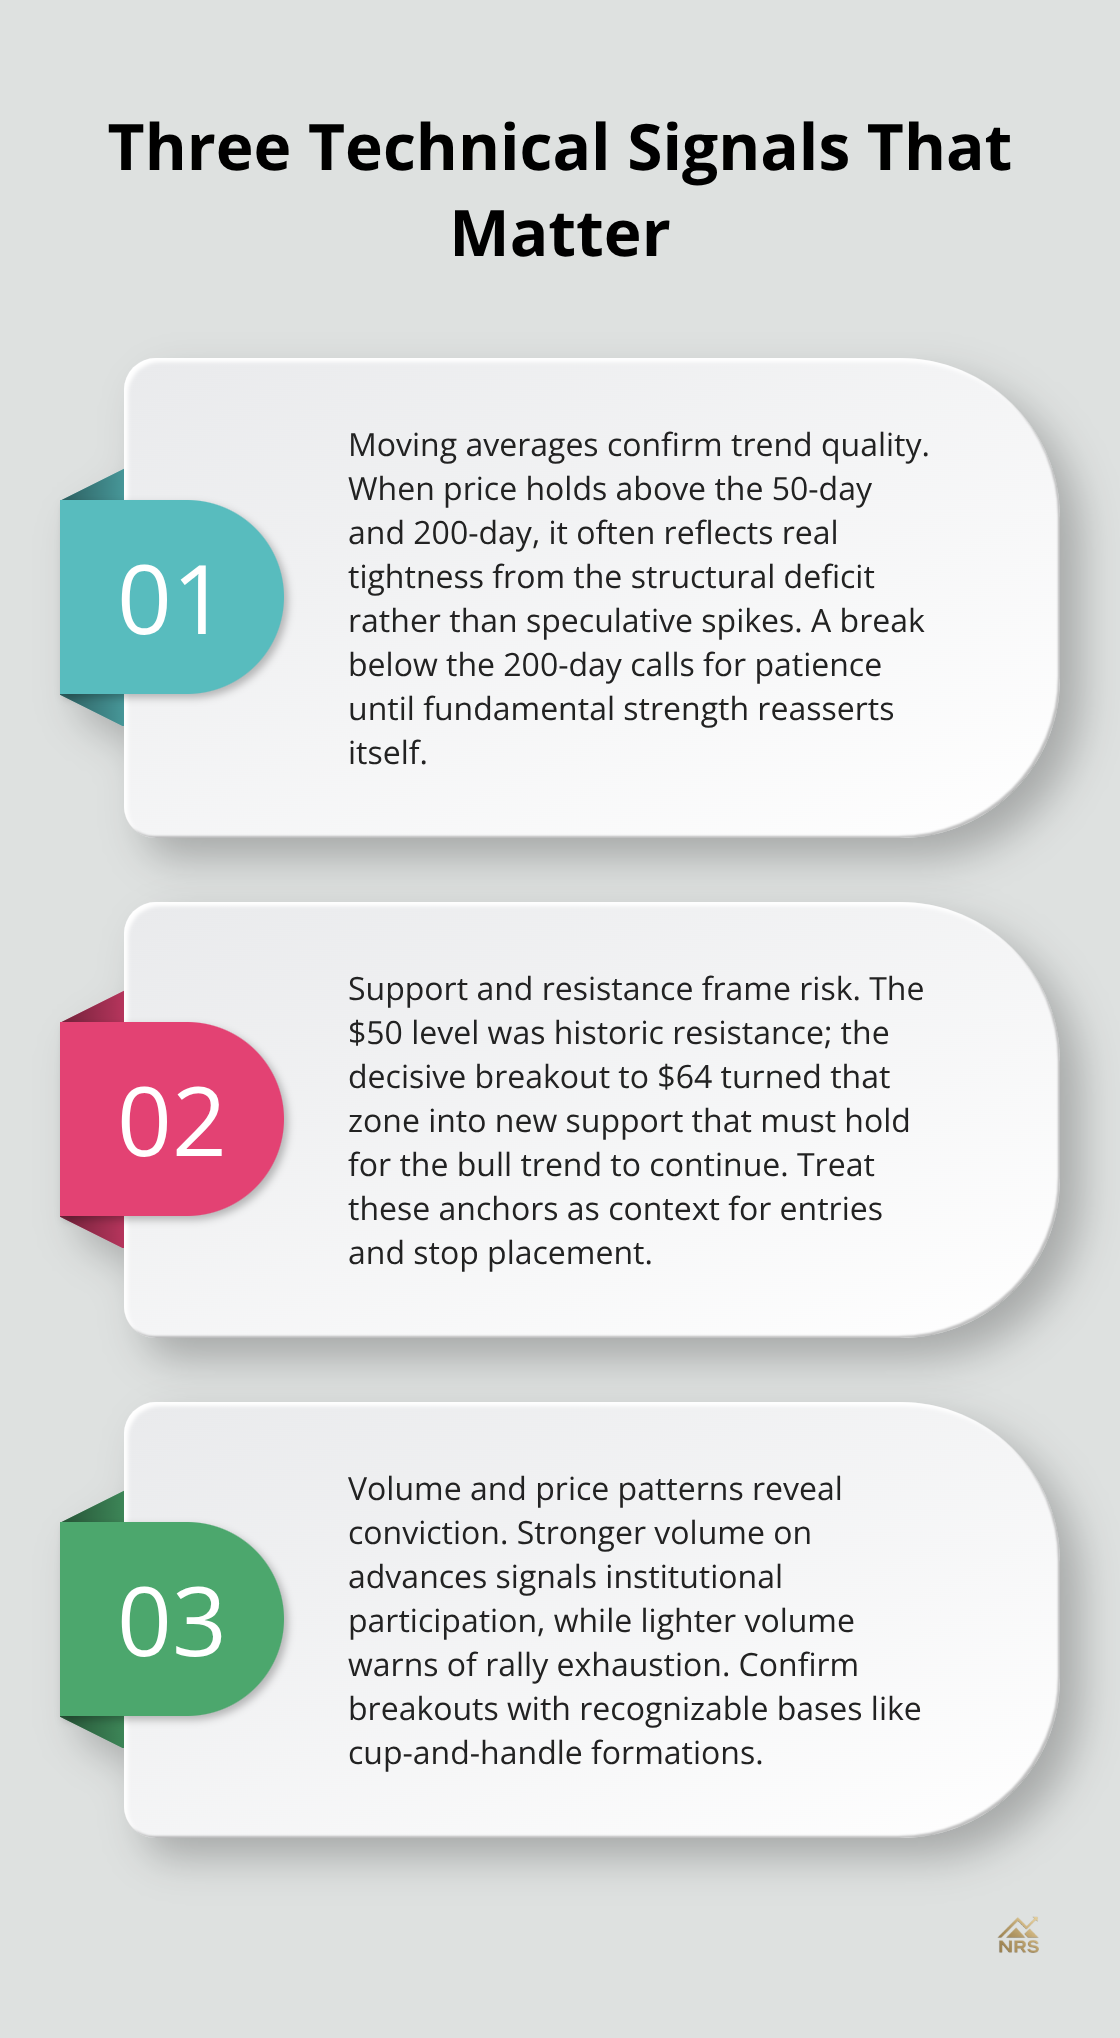
Support and Resistance Levels Anchor Price Expectations
Support and resistance levels matter far more for silver than for most commodities because the metal repeatedly encounters psychological price anchors tied to its history. The $50 per ounce level represents genuine resistance because it marks both the 2011 all-time high and the 1980 peak at $49.95, making it a level where profit-taking has historically occurred. Silver’s surge to $64 in mid-December 2025 proves that resistance eventually gave way, and now $64 itself becomes a support level that must hold if the bull market continues.
Volume and Price Patterns Reveal Institutional Conviction
Volume analysis reveals that silver’s December 2025 rally to $64 occurred on significantly higher trading volumes than the 2024 advance, indicating institutional participation rather than retail speculation alone. When volume expands during price advances, the move carries conviction; when volume contracts during rallies, you should view it as potentially exhausted. Price patterns like the cup-and-handle formation that technicians identified in silver’s 2024–2025 advance have historically preceded substantial breakouts, and the December breakout above $50 confirmed that pattern was legitimate.
Aligning Technical Signals with Structural Reality
Use these technical tools to confirm what the supply deficit already tells you, not to contradict it. If technical indicators suggest a reversal but the structural supply situation has worsened, the technical signal is likely false and industrial demand will reassert itself within weeks. This alignment between technical confirmation and fundamental supply dynamics separates traders who profit from those who chase false signals. The next section examines the macroeconomic forces that either amplify or temporarily suppress these technical patterns.
How Macro Forces Amplify or Suppress Silver Price Moves
The technical patterns and supply fundamentals we covered earlier operate within a macroeconomic environment that either accelerates or temporarily dampens price momentum. The US dollar index, real interest rates, and geopolitical risk act as multipliers on the structural silver deficit. Understanding how these forces interact prevents you from misinterpreting short-term price reversals as trend breaks when macro headwinds create temporary friction.
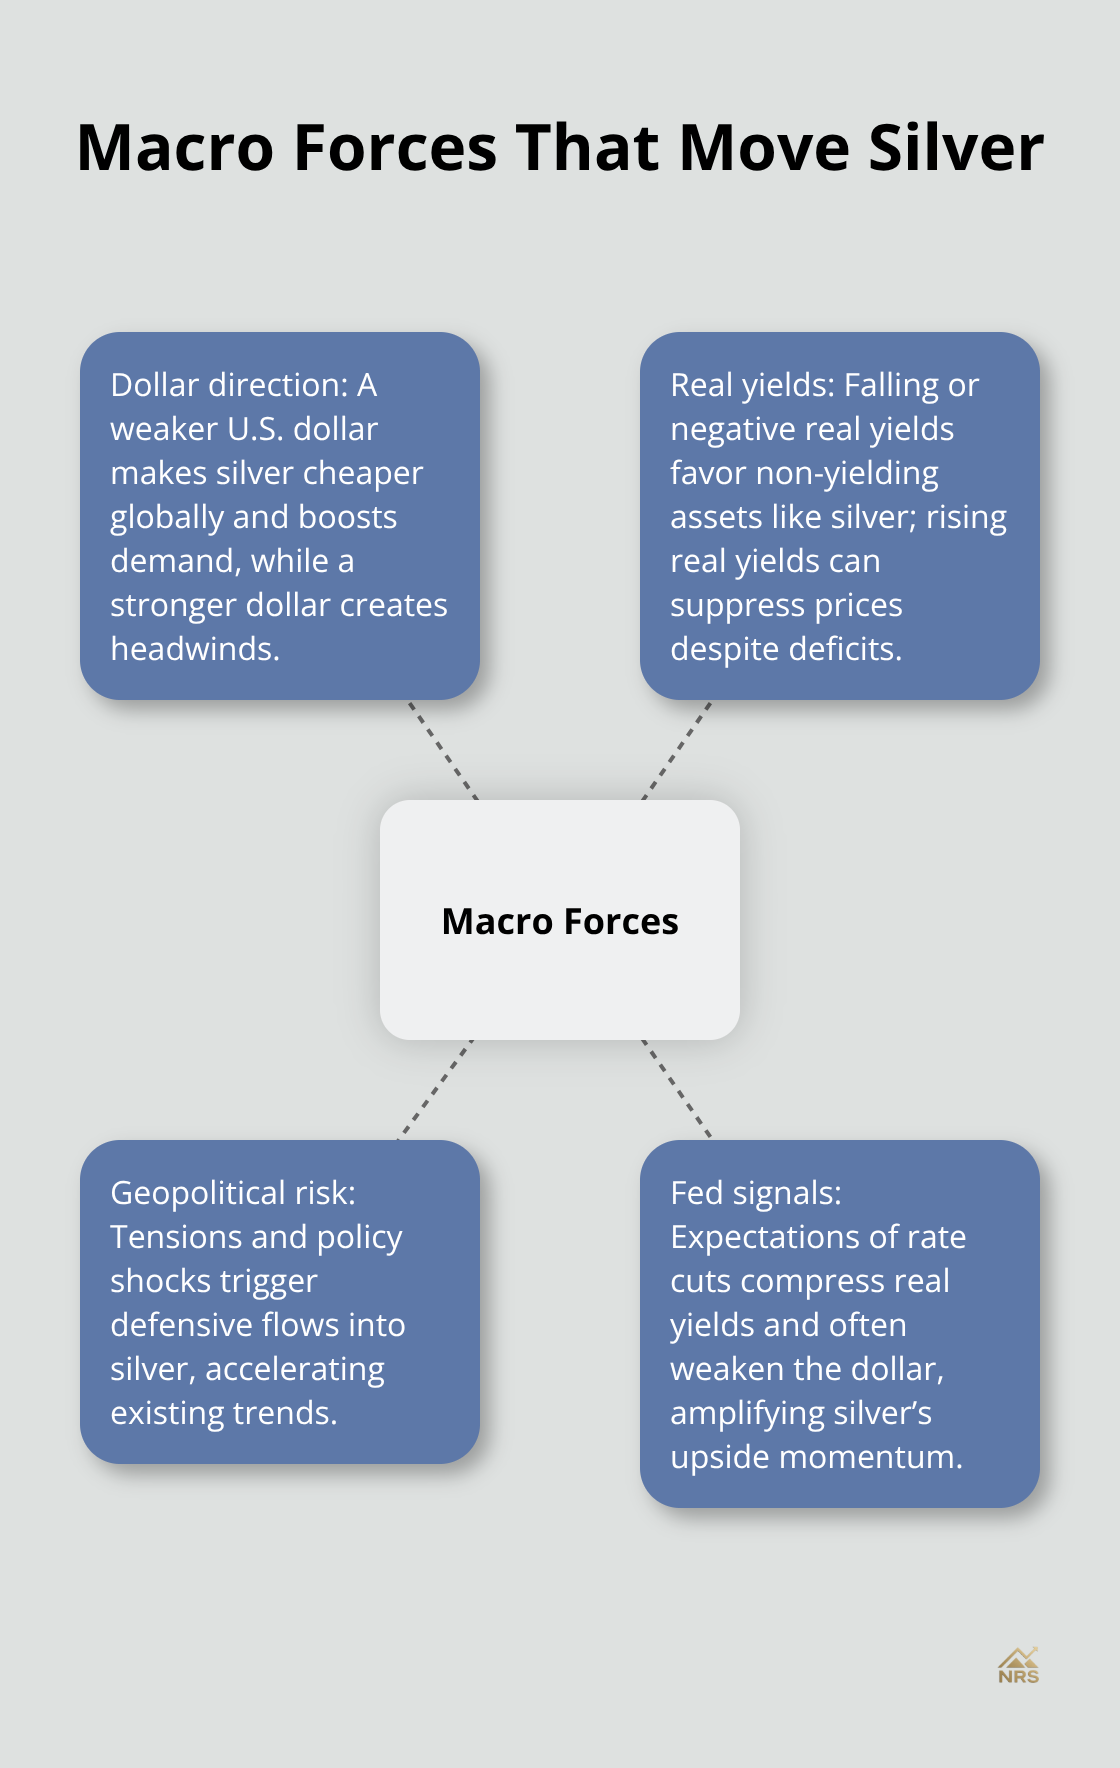
Dollar Weakness Strengthens Silver Prices
Silver priced in US dollars becomes cheaper for international buyers when US dollar weakness occurs, boosting demand across Asia and Europe where most silver consumption occurs. In 2025, expectations for multiple Federal Reserve rate cuts in 2026 combined with a softer dollar outlook to create powerful tailwinds for silver. When the Fed signals lower rates ahead, real yields compression makes non-yielding assets like silver more attractive relative to bonds.
This dynamic matters far more than nominal interest rates alone. A 2% nominal rate environment with 3% inflation creates negative real yields that actively punish cash holders, driving capital toward commodities. Citigroup projects silver reaching approximately 70 dollars per ounce in 2026 partly because their rate-cut assumptions support continued dollar weakness. If the Fed unexpectedly holds rates steady or signals rate increases, the dollar typically strengthens and silver faces headwind regardless of supply deficits. Monitor Fed communications and economic data that influence rate expectations as closely as you track industrial demand figures.
Geopolitical Risk Triggers Defensive Demand
Russia’s plan to accumulate roughly 535 million dollars in silver reserves signals official interest in silver as a diversification tool beyond gold, reflecting broader geopolitical fragmentation. Tariff threats, energy shocks, and mining risk in Mexico and Russia continue supporting safe-haven demand for precious metals. When geopolitical tensions escalate suddenly, investment demand can surge within days, pushing silver higher even if industrial demand remains flat.
This happened repeatedly throughout 2025 as macro stress triggered ETF inflows and futures volume spikes. Monitor geopolitical risk as a potential price accelerant that amplifies whatever direction the structural deficit already pushes. Rising tariff risks or mining disruptions in major producing regions like Mexico typically trigger immediate price spikes as investors hedge uncertainty. These moves often reverse quickly once the geopolitical event passes, so distinguish between structural price gains from supply deficits and temporary defensive rallies from political shocks.
Real Yields and Dollar Strength Shape the Price Envelope
Real yields, dollar strength, and geopolitical stability create the macro envelope within which industrial demand and technical patterns play out. When real yields fall and the dollar weakens simultaneously, silver experiences maximum upside acceleration. Conversely, rising real yields or dollar strength can suppress silver prices even when supply deficits persist. The interaction between these three macro forces determines whether the structural supply shortage translates into steady price appreciation or volatile sideways trading.
Final Thoughts
Forecasting silver spot price trends requires you to combine three analytical layers rather than relying on any single tool. The structural supply deficit provides your foundation, technical patterns confirm when momentum accelerates, and macroeconomic conditions determine the speed of price appreciation. Metal Focus projects continued deficits through 2026, and the 10 to 15 year timeline for bringing new deposits online means this tightness persists regardless of short-term price swings, so anchor your analysis to this supply-demand reality first.
Apply technical tools to identify when the structural trend accelerates or when temporary consolidation occurs. Moving averages, support and resistance levels, and volume patterns confirm whether institutional capital participates in the move or whether retail speculation drives isolated spikes. Dollar weakness, falling real yields, and geopolitical risk act as accelerants that amplify the deficit’s impact, so monitor Fed communications for rate signals and track ETF flows from sources like Saxo Bank alongside industrial demand trends from the Silver Institute.
Your silver spot price forecast improves dramatically when you combine micro signals with macro indicators and adapt as conditions shift. Visit Natural Resource Stocks for expert commentary on how geopolitical impacts and macroeconomic factors shape precious metals opportunities.