


Precious metal stocks offer real protection when markets turn volatile and inflation erodes purchasing power. We at Natural Resource Stocks believe these investments deserve a closer look in any diversified portfolio.
This guide walks you through evaluating mining companies, spotting market opportunities, and building a strategy that works for your goals.
Why Precious Metal Stocks Protect Your Wealth
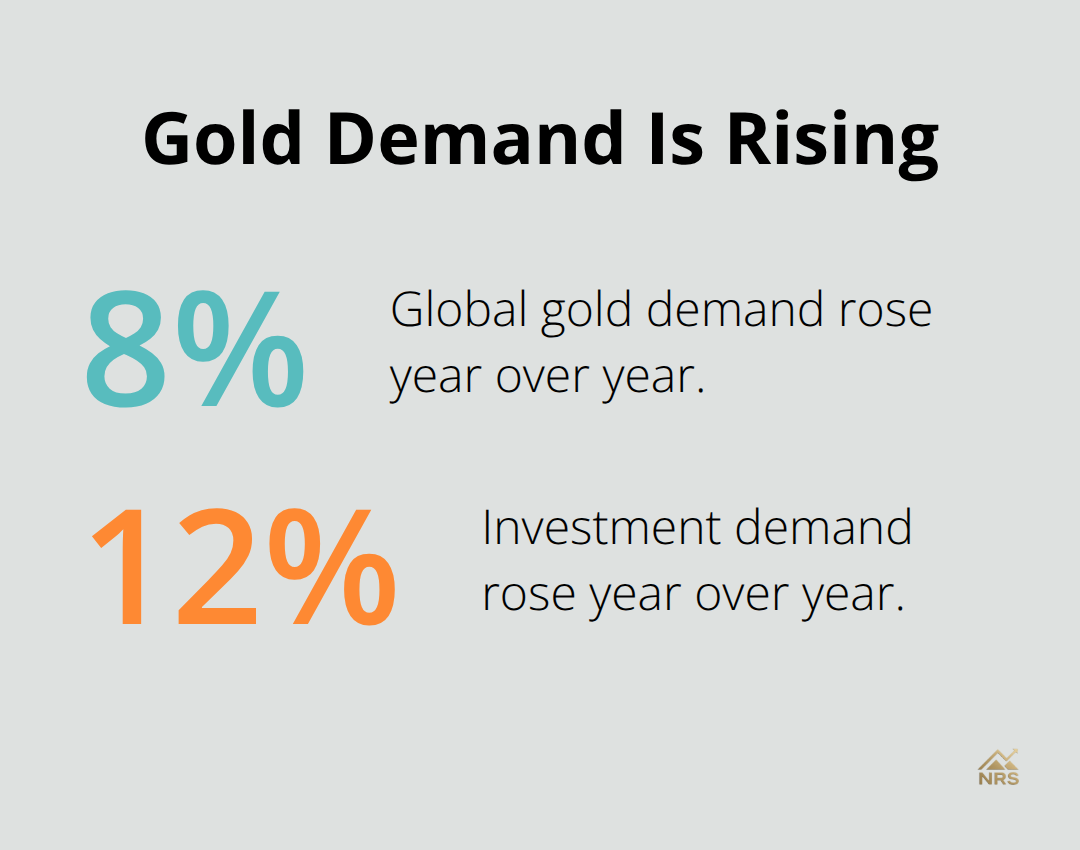
Precious metal stocks have historically outperformed when traditional markets stumble. During the 2008 financial crisis, gold stocks surged while equities collapsed, and the same pattern repeated in 2020 when pandemic fears hit markets. Central banks purchased over 1,000 tons of gold for the third year in a row, signaling institutional confidence in metals as a hedge against uncertainty. This isn’t theoretical-it’s how major financial institutions actually deploy capital when confidence erodes. The World Gold Council reports global gold demand rose 8% year over year, with investment demand specifically up 12%, showing real money flowing into these assets as inflation concerns persist.
Metals move when stocks stall
Gold and silver stocks behave differently than your typical equity holdings because they respond to currency weakness and inflation fears rather than corporate earnings growth. A rising dollar typically weakens gold prices, while a weakening dollar strengthens them-the opposite of how most stocks behave. This inverse relationship means precious metal stocks cushion portfolio losses during inflationary periods when bond values decline and stock multiples compress. Morgan Stanley research confirms gold maintains low correlations to stocks and major asset classes, making it genuinely useful for reducing overall portfolio risk. Industrial metals like copper and nickel follow economic cycles more closely, but precious metals operate on a different frequency.
Production costs separate winners from losers
Evaluating precious metal stocks means understanding which companies maintain profitability when metal prices fluctuate. Wheaton Precious Metals maintains a 68.52% gross margin through its streaming model, where it purchases metal at fixed prices and profits when spot prices rise. Newmont Mining controls premier assets like Carlin and Yanacocha, giving it scale advantages over smaller producers. Sibanye Stillwater operates as one of the world’s largest primary platinum-group metals producers, diversifying beyond gold into metals with distinct industrial demand patterns. The companies with lowest production costs survive price downturns; those with high cash costs disappear during bear markets.
Cash costs reveal true competitive strength
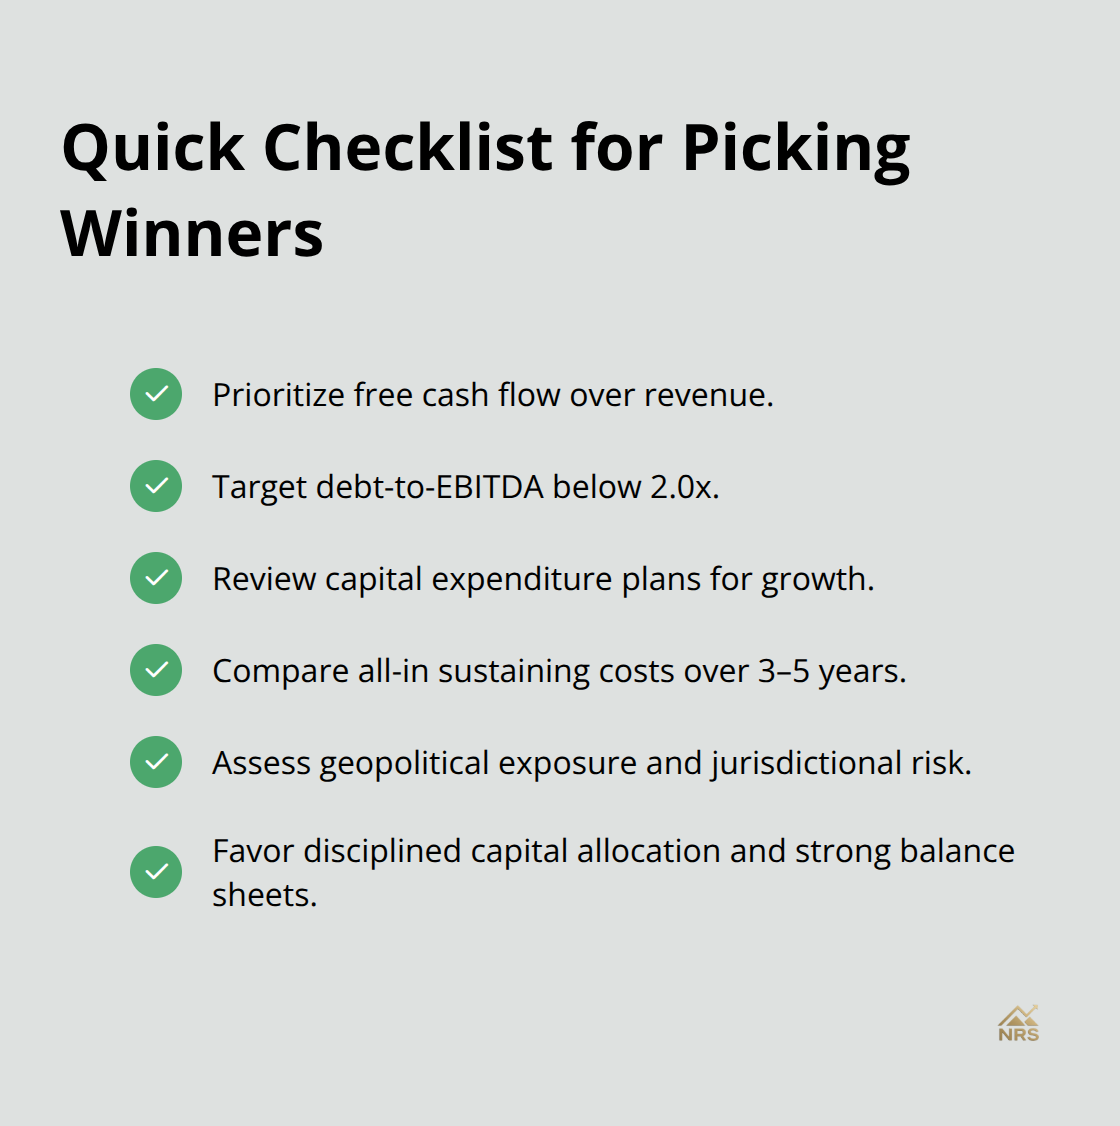
Focus on companies with competitive production costs, as these maintain dividends even when prices drop. A producer with lower per-ounce costs outearns a competitor with higher per-ounce costs when gold trades at $1,600-that margin difference compounds over years. Examine balance sheets for debt levels and free cash flow generation, not just production volume. Companies that reinvest profits into exploration and mine development (rather than returning all cash to shareholders) position themselves for long-term growth. The strongest precious metal stocks combine low costs with disciplined capital allocation and strong balance sheets.
Understanding these financial metrics prepares you to spot which companies thrive across different market cycles. The next section shows you how to assess the geopolitical and supply chain risks that can derail even well-managed operations.
Picking Winners Among Precious Metal Stocks
Evaluating precious metal stocks demands looking beyond production volume to the metrics that actually determine survival and profitability. Start with free cash flow generation, not just revenue. A company producing 1 million ounces of gold annually means nothing if it burns cash on inefficient operations or carries crushing debt loads. Newmont Mining generated over $7 billion in free cash flow in recent years, giving it the financial cushion to maintain dividends during price downturns and fund exploration for future mines. Compare this against smaller producers with thin margins, and the difference becomes obvious: Newmont can weather a 30% gold price decline; weaker competitors cannot.
Examine total debt relative to EBITDA, targeting companies with ratios below 2.0x, which indicates manageable leverage. Look at capital expenditure plans too. Companies that spend heavily on exploration and development position themselves for production growth when metal prices recover, while those that cut exploration budgets signal management has lost confidence in future returns. Wheaton Precious Metals operates a streaming model that avoids most capital intensity altogether, collecting fixed-price metal purchases and capturing upside as prices rise, which explains its 68.52% gross margin and consistent profitability across price cycles.
Production costs separate strong from weak
All-in sustaining costs (AISC) per ounce reveal which companies remain profitable at lower metal prices. When gold trades at $2,000 per ounce, a producer with $800 AISC generates far more cash than one with $1,200 AISC. Rio Tinto and BHP Group maintain low-cost operations through scale and operational efficiency, protecting margins when prices compress. Request the annual reports directly and calculate AISC yourself rather than relying on company summaries, as management presentations often bury unfavorable numbers in footnotes.
Compare AISC trends over three to five years; rising costs signal operational problems or declining ore grades that undermine long-term competitiveness. Sibanye Stillwater’s focus on platinum-group metals production gives it exposure to distinct industrial demand patterns beyond gold, but examine whether its PGM costs remain competitive against other primary producers. Production grades matter too. A mine that produces lower-grade ore requires more processing and higher costs per ounce extracted, limiting profitability when prices drop.
Geopolitical exposure demands careful scrutiny
Mining operations in politically unstable regions carry real risk that spreadsheets cannot capture. A $5 billion mine in Peru faces different risks than one in Canada. Examine where each company sources its production: operations in stable democracies with established rule of law carry lower expropriation and supply disruption risk than those in countries with histories of resource nationalism.
Check recent years of production for disruptions from labor strikes, permitting delays, or government interventions. Newmont’s Carlin mine in Nevada and Yanacocha in Peru operate in jurisdictions with different stability profiles, and understanding this shapes dividend sustainability. Supply chain concentration matters equally. If a company depends on a single country or region for critical processing equipment or services, disruptions cascade into production halts (a risk that concentrated operators cannot avoid). Diversified producers like BHP Group operate across multiple continents and jurisdictions, reducing single-point-of-failure risk.
Management transparency signals risk awareness
Review management commentary on geopolitical exposure in quarterly earnings calls and annual filings; transparent discussion of risks signals management takes these threats seriously, while silence suggests complacency. Strong operators acknowledge their exposure to specific countries and explain mitigation strategies. Weak operators ignore geopolitical questions or provide vague responses that obscure actual risk levels.
The financial strength and operational discipline you identify in these evaluations matter most when supply chain disruptions or price shocks test management’s resolve. Understanding how companies respond to external pressures reveals which ones maintain shareholder value through cycles. The next section examines the market trends and demand drivers that shape which metals and producers capture the most upside as global consumption patterns shift.
Where Precious Metal Demand Comes From
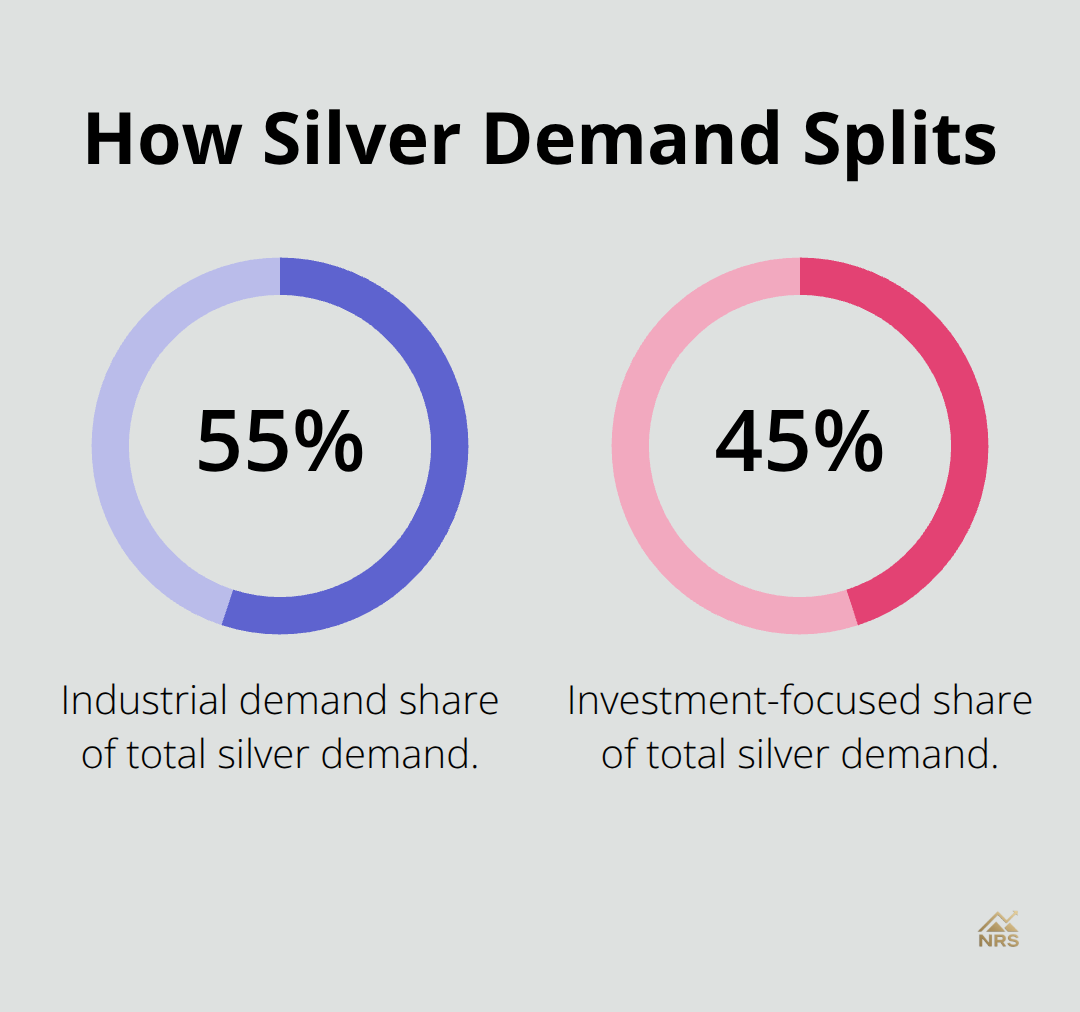
Industrial consumption and investment flows shape precious metal prices far more than mining supply does. Silver demand splits roughly 55% industrial and 45% investment-focused, meaning economic cycles drive half of silver’s price movements while safe-haven flows drive the other half. This dual role creates volatility two to three times that of gold on typical trading days, as BullionVault data shows, because industrial demand collapses during recessions while investment demand spikes.
Gold behaves differently: roughly 80% of demand comes from investment and jewelry, with only 20% tied to industrial uses like electronics and dentistry. This structural difference means gold prices often move inversely to economic strength, while silver prices follow economic cycles more closely.
How Industrial Demand Drives Silver Prices
Electronics, solar panels, and automotive systems consume massive silver volumes that most investors overlook. A single smartphone contains roughly 7 grams of silver in its circuitry, and global smartphone production exceeds 1.2 billion units annually, consuming thousands of tons of silver yearly. Solar panel installations across Europe, Asia, and North America add another massive consumption stream, with each megawatt of solar capacity requiring approximately 20 grams of silver. Electric vehicle production accelerates this demand further since EV electrical systems contain more silver than traditional vehicles. When manufacturing expands in emerging markets or EV adoption accelerates, silver prices respond faster than gold prices because industrial demand increases before investment demand catches up.
Why Gold Responds to Economic Slowdowns
Gold producers profit precisely when industrial production contracts because investment demand surges during downturns. Economic slowdowns, currency weakness, and geopolitical tensions boost investment demand for safe-haven assets. This inverse relationship to economic strength separates gold from silver fundamentally. Newmont Mining and Franco-Nevada benefit from the opposite scenario that hurts silver producers, positioning them to capture gains when markets turn uncertain.
Selecting Stocks Based on Demand Drivers
Understanding which metal responds to which demand driver matters when selecting stocks. A silver producer profits when global manufacturing expands and smartphone production accelerates, but struggles when factories idle. Watch EV sales data, smartphone shipment forecasts, and solar installation trends in China and India, then position accordingly in silver-focused producers like First Majestic Silver, which derives approximately 57% of its 2025 revenue from silver. Neither approach dominates; they simply respond to different macro environments, which is precisely why a balanced portfolio includes both precious metals stocks and industrial metals exposure.
Final Thoughts
Match your investment thesis to the right precious metal stocks and market conditions. If you expect inflation to persist and central banks to maintain accommodative policies, gold-focused producers like Newmont Mining and Franco-Nevada offer direct exposure to prices that typically rise during these periods. If you anticipate global manufacturing acceleration and EV adoption expansion, silver producers like First Majestic Silver capture industrial demand growth that gold cannot. The strongest portfolios combine both, since they respond to different economic scenarios and reduce concentration risk.
Pull annual reports and calculate all-in sustaining costs yourself rather than relying on management summaries. Compare debt levels, free cash flow generation, and geopolitical exposure across competitors in your target metals. Wheaton Precious Metals and BHP Group demonstrate how different business models deliver returns: Wheaton’s streaming approach minimizes capital intensity while BHP’s diversified operations across iron ore, copper, and nickel provide broader economic exposure. Research production trends and reserve replacement rates to identify which companies sustain dividends through price cycles.
Precious metal stocks remain volatile, but that volatility creates opportunity for disciplined investors who understand what drives each metal’s price and which companies survive downturns. Gold recently traded above $4,000 per ounce and silver above $50 per ounce in late 2025, reflecting genuine institutional demand for inflation protection. Natural Resource Stocks provides expert analysis and market insights that help you evaluate these metrics against macroeconomic factors shaping metal prices, so position yourself in companies with competitive costs, strong balance sheets, and clear growth catalysts.