


Gold and silver are moving in response to real market forces right now. Interest rates, dollar strength, and geopolitical risk are all shifting the precious metals landscape in 2026.
At Natural Resource Stocks, we’re tracking these changes closely. This guide breaks down the drivers, current conditions, and concrete strategies you can use to position yourself in precious metals.
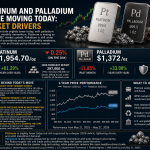
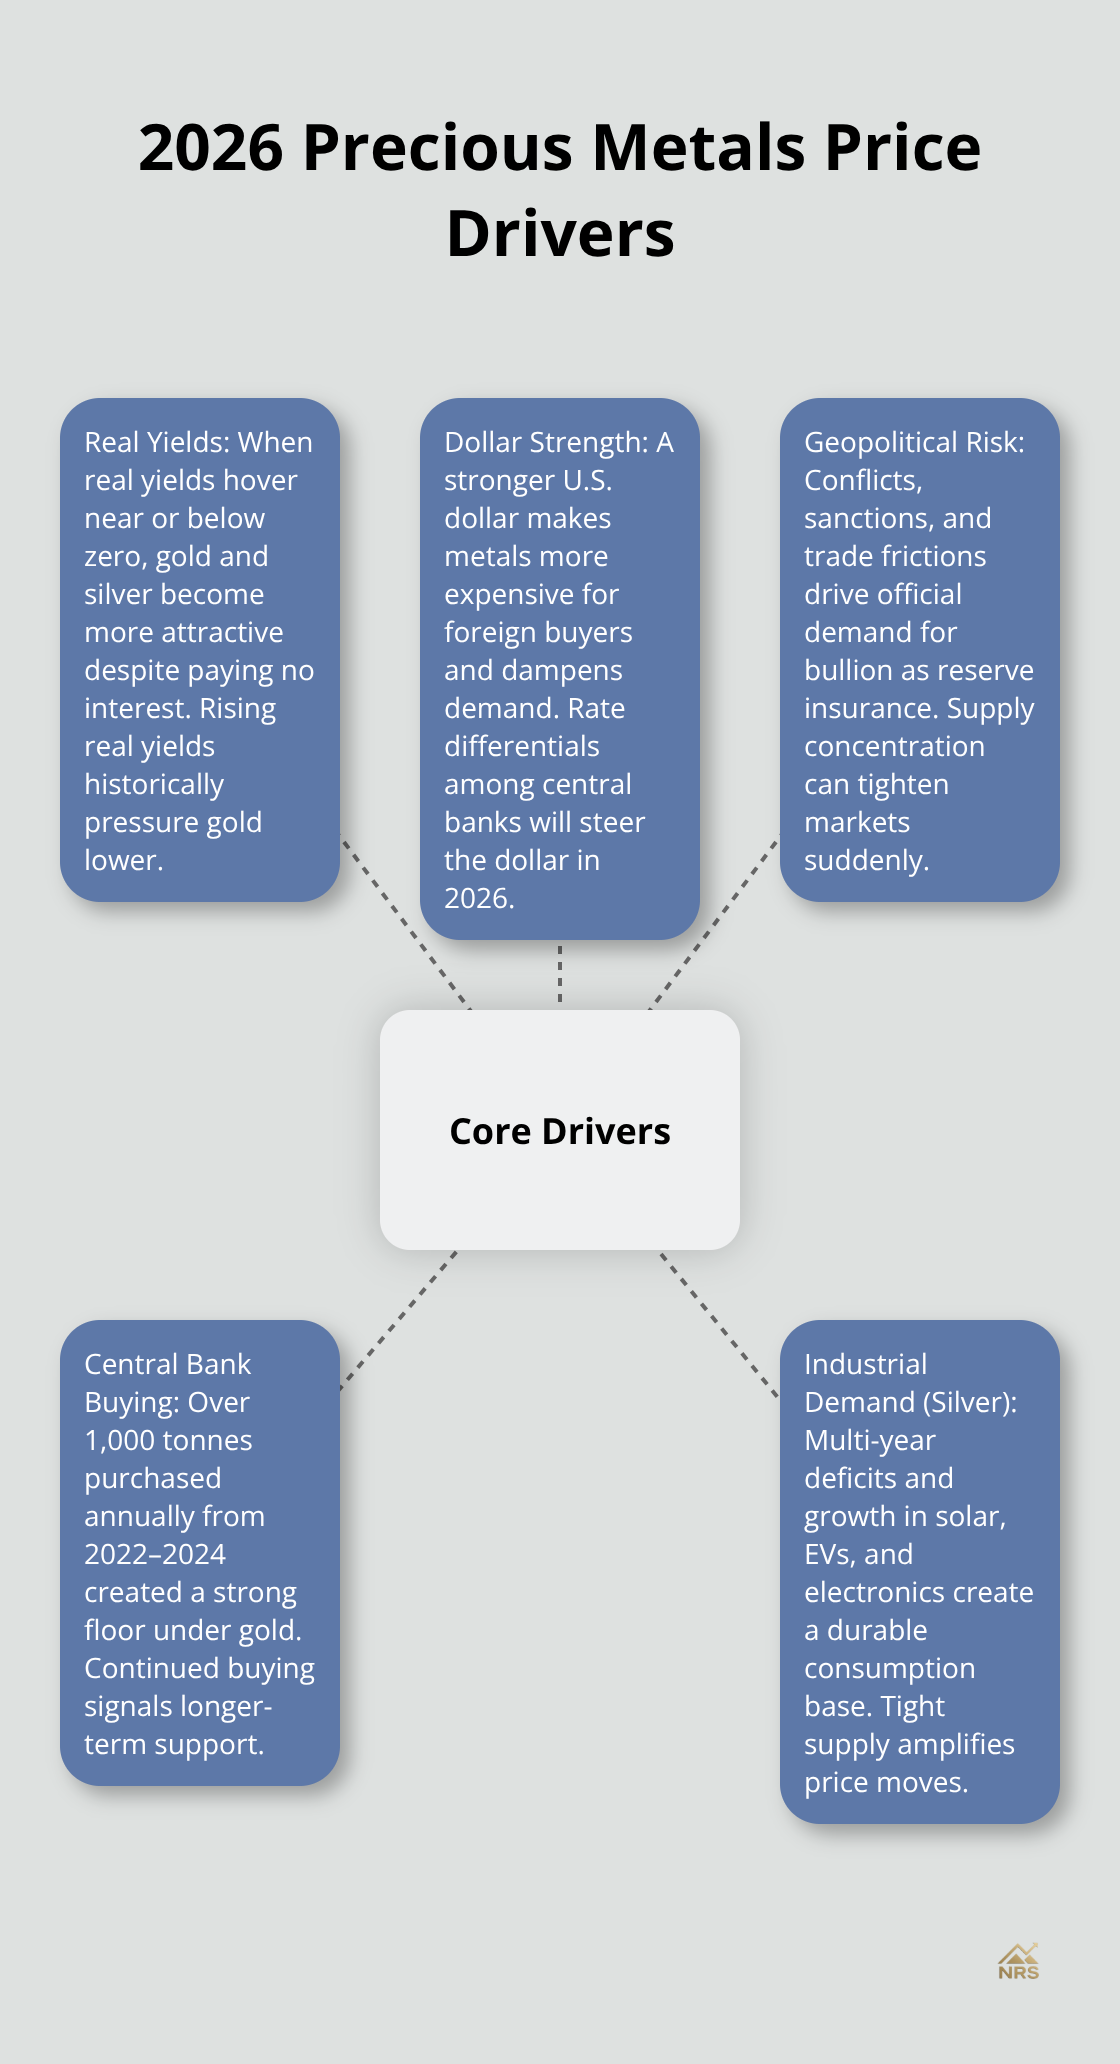
What Moves Gold and Silver Prices in 2026
Real Yields: The Silent Pressure on Metals
Real yields-inflation-adjusted returns on bonds-act as the primary pressure point for precious metals right now, and the Federal Reserve controls this lever. When real yields stay compressed near zero or below, gold and silver attract investors because they offer no interest payments but protect purchasing power. With the Fed expected to cut rates and inflation remaining sticky above the 2% target in 2026, real yields will likely stay suppressed. Every 1% rise in real yields historically pressures gold downward, while declines support prices. Watch the 10-year Treasury yield minus the inflation expectation embedded in TIPS (Treasury Inflation-Protected Securities). If that spread widens, metal prices will struggle. If it stays tight or negative, you have tailwind. The Fed’s messaging in early 2026 will signal what comes next-listen for officials’ comments on rate-cut timing and their inflation assessment, not just the fed funds rate itself.
Dollar Strength: The Overlooked Headwind
The US dollar matters equally and retail investors often miss this connection. A stronger dollar makes gold and silver more expensive for foreign buyers, dampening demand. The dollar index has been volatile, but what counts for metals is whether the Fed maintains higher rates relative to other central banks. If the Fed cuts aggressively while the European Central Bank or Bank of England hold steady, the dollar weakens and metals rally. Conversely, if the Fed signals hawkishness to fight inflation, the dollar strengthens and metals face headwinds. This dynamic will play out throughout 2026 as central banks adjust their policies in response to inflation data.
Geopolitical Risk: The Structural Catalyst
Geopolitical risk intensifies in 2026 and acts as your third major lever. Central banks purchased over 1,000 tonnes of gold annually from 2022 through 2024-the strongest three-year stretch since 1967-because they view precious metals as insurance against sanctions, currency debasement, and trade wars. Russia’s accumulation of roughly $535 million in silver signals that official demand is shifting beyond traditional gold-only strategies. Mining production concentration adds real teeth to this risk: Peru holds roughly 22% of the world’s known silver reserves, and any sanctions, political instability, or nationalization would tighten supply overnight.
These three forces-real yields, dollar momentum, and geopolitical shocks-move metals prices far more than sentiment or retail enthusiasm. Understanding how they interact will help you anticipate price movements before they happen. The current market conditions reflect these pressures in real time, and your next step is to assess where precious metals stand relative to historical levels and what industrial demand tells us about future price direction.
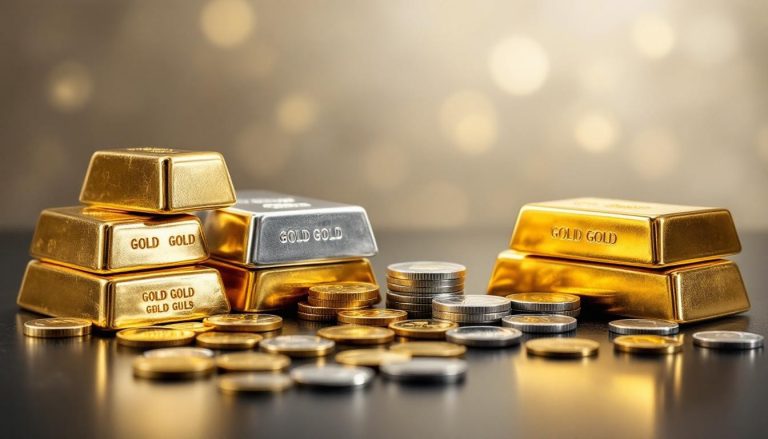
Where Gold and Silver Stand Right Now
Gold’s Structural Price Floor
Gold trades near $4,600 per ounce in early 2026, still well above the $2,700 level from early 2025. That 70% surge reflects real shifts in how central banks and investors view precious metals, not speculation. The World Gold Council reported that central banks accumulated over 1,000 tonnes annually from 2022 through 2024, the strongest pace since 1967. China extended its purchases to 18 consecutive months through mid-2024, signaling that major economies treat gold as reserve insurance rather than a trading vehicle. Central banks anchor a price floor that retail panic selling cannot penetrate when they accumulate gold at this pace. Historical averages matter far less than the structural demand supporting current levels.
Silver’s Industrial Demand Engine
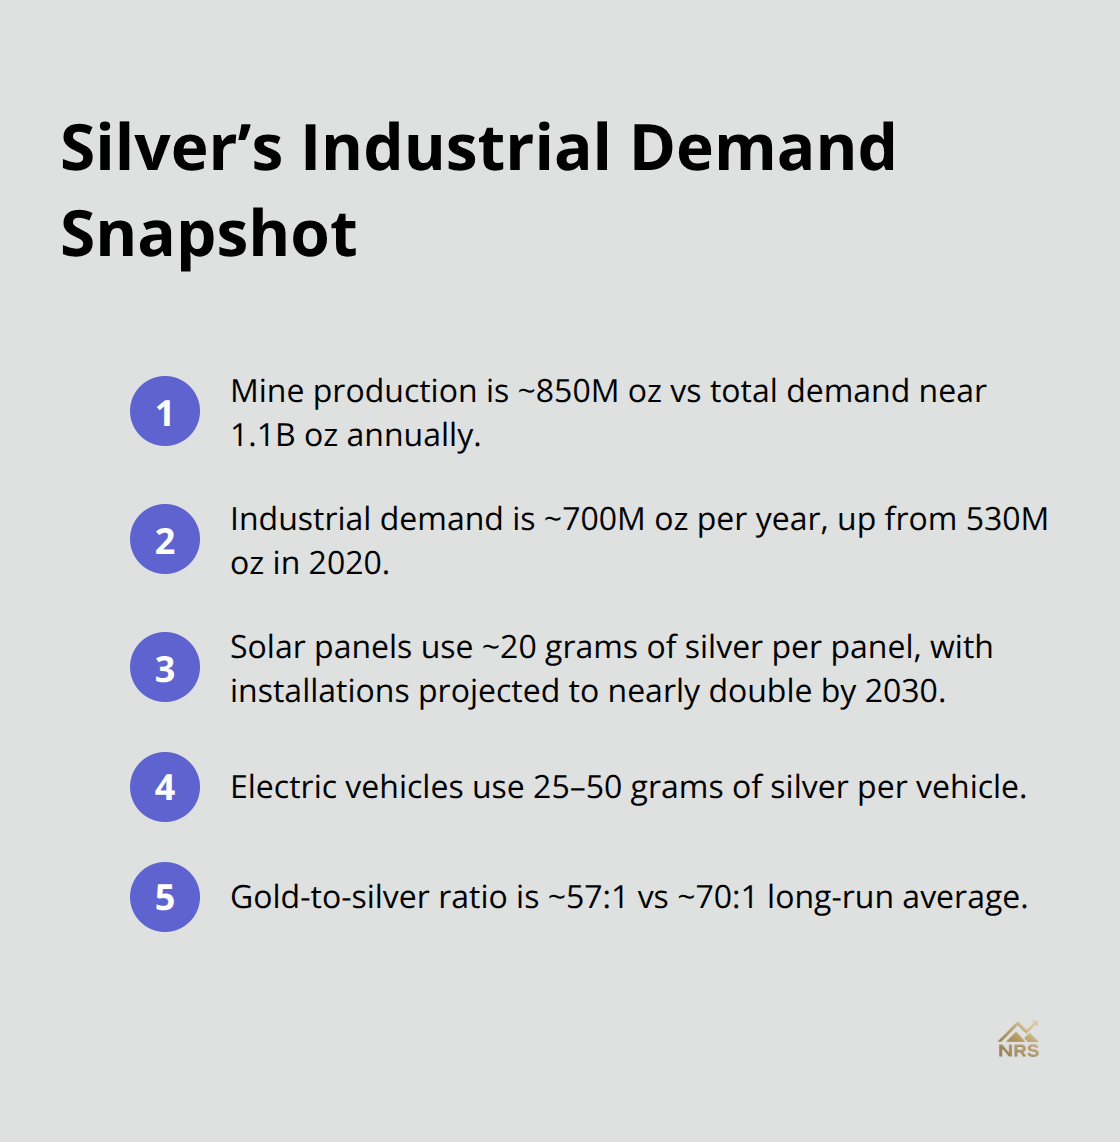
Silver jumped from roughly $28 per ounce at the start of 2025 to above $88 by early 2026, a 147% rally driven by something central banks and solar companies cannot ignore: a fifth consecutive year of global supply deficit. The Silver Institute tracks annual mine production at roughly 850 million ounces against total demand approaching 1.1 billion ounces. Industrial demand alone consumes about 700 million ounces yearly, up sharply from 530 million in 2020. Solar panels use approximately 20 grams of silver per panel, and solar installations are projected to nearly double through 2030, which will only widen that industrial floor. Electric vehicles add another layer, with 25 to 50 grams of silver per vehicle for electronics and charging systems. 5G networks, medical devices, and data centers further cement silver’s industrial necessity. This demand does not vanish in a downturn. When solar capacity expands, silver consumption follows automatically.
The Compression Signal and Official Sector Shift
The gold-to-silver ratio compressed to around 57:1 from above 100:1 earlier in 2025, approaching the long-run average near 70:1. This compression reflects silver catching up to its industrial fundamentals after years of undervaluation relative to gold. Institutional forecasters show wide conviction on direction: World Bank targets $41 per ounce for 2026, while JPMorgan, HSBC, and Citigroup cluster between $58 and $72. Russia’s recent announcement of roughly $535 million in silver accumulation confirms that official sector demand is shifting beyond gold-only reserve strategies. This dual identity as both industrial metal and monetary safe haven gives silver structural tailwinds that gold alone cannot match in 2026. Understanding these supply constraints and demand drivers sets the stage for evaluating which investment vehicles will capture this opportunity most effectively.
How to Position Yourself in Precious Metals
Physical Bullion, ETFs, and Mining Stocks: Three Paths Forward
Physical bullion, ETFs, and mining stocks each serve different purposes in a precious metals allocation, and the choice depends on your timeline and risk tolerance rather than which option is objectively superior. Physical ownership of gold and silver coins or bars gives you direct counterparty-free exposure and provides genuine crisis insurance if financial systems face stress, but it requires secure storage, insurance costs of roughly 0.5% to 1% annually, and liquidity friction when you convert back to cash. ETFs like GLD for gold or SLV for silver offer instant liquidity, lower storage costs, and fractional ownership, but they carry counterparty risk and do not provide the psychological security of holding tangible metal. Mining stocks amplify both upside and downside, responding not only to metal prices but also to operational costs, geopolitical disruptions at mines, and company-specific management decisions.
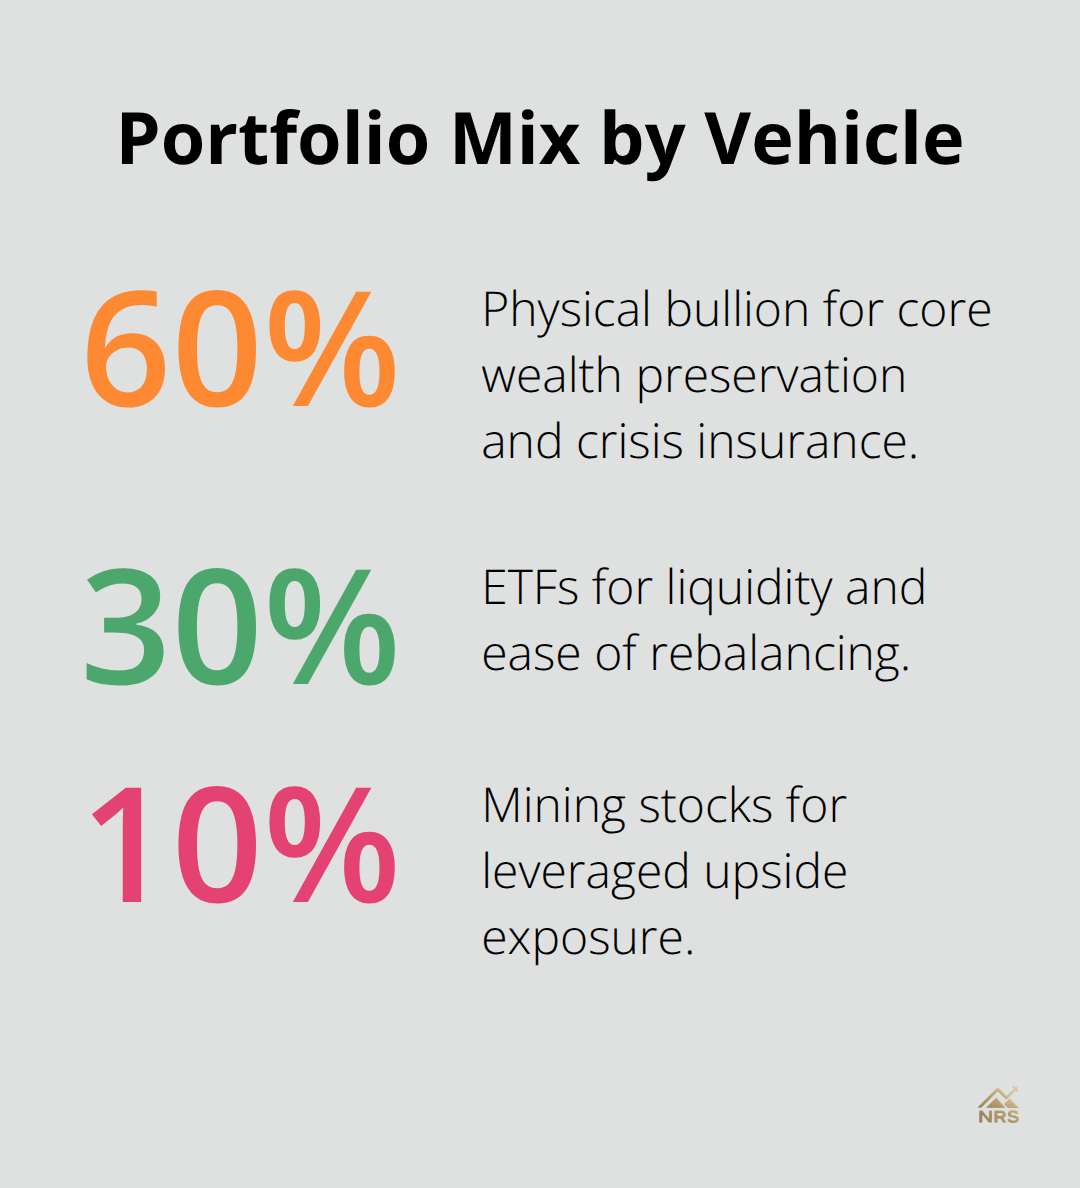
A tiered approach works best: allocate 60% to physical bullion for core wealth preservation, 30% to ETFs for liquidity and ease of rebalancing, and 10% to mining stocks for leveraged exposure to upside moves. This structure lets you capture metal price appreciation while maintaining the crisis-proof qualities of physical ownership.
Right-Sizing Your Precious Metals Allocation
Portfolio sizing for precious metals hinges on your overall financial goals and risk capacity, not arbitrary percentages floating across the internet. A conservative investor focused on wealth preservation should target 8% to 10% in gold and 2% to 3% in silver relative to total investable assets, prioritizing stability over returns. An investor with higher risk tolerance and a 10-year-plus horizon can shift toward 7% to 10% in silver and 3% to 5% in gold, leaning into silver’s industrial demand upside. Dollar-cost averaging over 6 to 12 months smooths volatility and removes the burden of timing a single entry point perfectly, which matters far more than finding the exact bottom price.
Entry Signals and Technical Discipline
Technical entry signals carry weight when combined with fundamentals: silver pulled back below $70 per ounce multiple times in late 2025 before rallying above $88, creating opportunities for disciplined buyers to add positions without chasing extended moves. Monitor the gold-to-silver ratio at 57:1 against its historical 70:1 average; if the ratio widens back toward 75:1, silver offers relative value compared to gold. Watch real yields on the 10-year Treasury daily through TIPS spreads; if real yields climb above zero, tighten stops on new positions because historical data shows gold struggles in that environment.
Tactical Opportunities in Volatile Markets
Geopolitical shocks around major mining regions like Peru, Mexico, or Russia present tactical windows to add exposure when risk premiums spike prices higher, but require the discipline to scale in gradually rather than deploying capital all at once into volatile moves.
Final Thoughts
Gold and silver’s 2026 trajectory rests on three structural forces: compressed real yields, dollar momentum, and geopolitical risk. Central banks accumulated over 1,000 tonnes of gold annually from 2022 through 2024-the strongest pace since 1967-which anchors prices far above historical averages. Silver’s 147% rally in 2025 reflects genuine supply constraints (mine production at 850 million ounces cannot meet total demand approaching 1.1 billion ounces) combined with industrial consumption that expands automatically as solar installations and electric vehicles proliferate.
Your positioning should reflect your timeline and risk tolerance rather than chase extended moves. A tiered approach works best: allocate 60% to physical bullion for crisis insurance, 30% to ETFs for liquidity, and 10% to mining stocks for leveraged upside. Conservative investors should target 8% to 10% in gold and 2% to 3% in silver, while higher-risk investors can shift toward 7% to 10% in silver and 3% to 5% in gold to lean into silver’s industrial demand tailwinds.
Monitor real yields on the 10-year Treasury through TIPS spreads throughout 2026, and tighten stops if real yields climb above zero because gold historically struggles in that environment. Watch the gold-to-silver ratio at 57:1 against its 70:1 historical average; widening ratios signal relative value in silver. Visit Natural Resource Stocks to track these drivers through expert analysis and macroeconomic insights that help you anticipate price movements before they happen.