


Gold remains one of the most reliable assets for protecting wealth during market turbulence and inflation spikes. At Natural Resource Stocks, we’ve seen investors struggle to move beyond simple bullion purchases and into strategic gold stock picks that actually build long-term wealth.
This guide walks you through the exact framework we use to evaluate gold mining companies, construct diversified portfolios, and manage risk effectively.
Why Gold Protects Your Wealth When It Matters Most
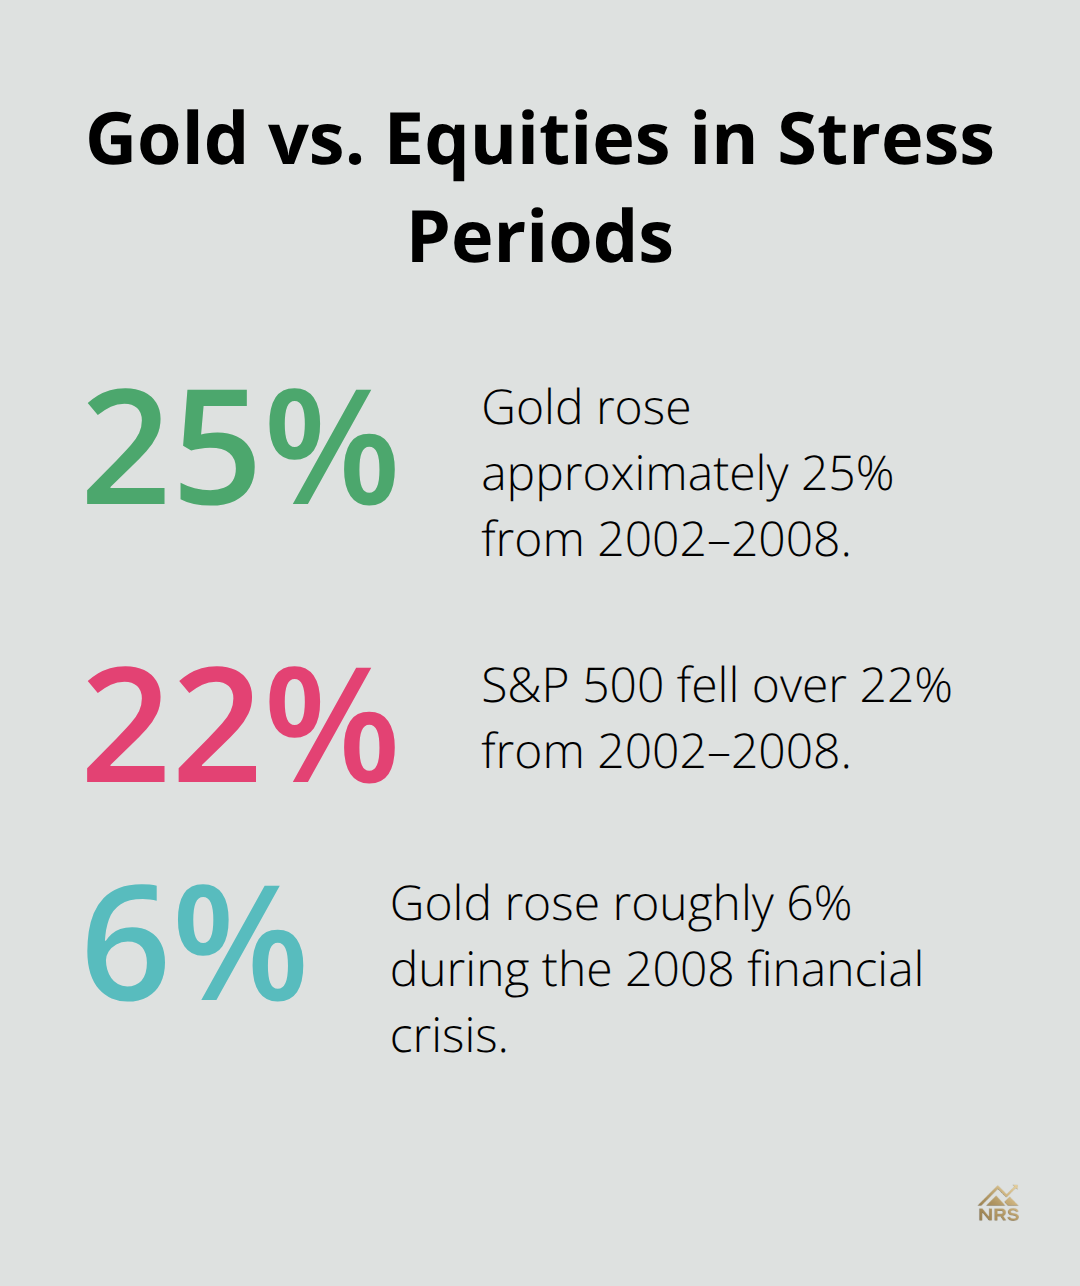
Gold’s inflation-hedging reputation rests on concrete historical data, not sentiment. From 2002 to 2008, when the S&P 500 dropped over 22%, gold climbed approximately 25%. During the 2008 financial crisis itself, gold rose roughly 6% while equities collapsed 37%.
These weren’t isolated events. Gold price exceeded $5,365 per ounce in early 2026 after a 60% rally in 2025, driven by persistent geopolitical tension and currency volatility. The mechanics are straightforward: when central banks maintain elevated interest rates to combat inflation, real yields (inflation-adjusted returns) compress, making non-yielding assets like gold more attractive. Conversely, when real yields rise or the U.S. dollar strengthens significantly, gold’s upside gets capped. This inverse relationship between the dollar and gold prices matters for your portfolio construction. When the dollar weakens-a realistic scenario given current macro uncertainty-gold prices typically rise, providing the portfolio stabilization you need when traditional equities and bonds underperform together.
Understanding Gold’s True Price Drivers
Gold doesn’t move based on corporate earnings or interest rate expectations alone. Demand dynamics, currency movements, and geopolitical risk drive prices far more than stock market fundamentals do. This separation from equity correlations is precisely why gold works as a diversifier. Nicky Shiels of MKS PAMP highlighted that strong demand for critical metals amid geopolitical turmoil continues pushing prices higher, a trend likely to persist as supply chains remain fragmented. The practical takeaway: gold allocations should reflect your view on currency stability and geopolitical risk, not earnings growth expectations. A 5% to 10% allocation works for risk-tolerant investors seeking genuine portfolio stabilization, while others benefit more from smaller positions. Physical gold carries a 5% to 10% premium over spot price plus storage costs, making paper gold via ETFs more practical for most investors. The choice between physical and paper gold depends on whether you prioritize counterparty risk reduction and tangible ownership versus liquidity and lower costs.
Historical Evidence of Gold’s Stabilizing Power
Gold’s performance during economic uncertainty reveals its role clearly. In 2025, gold delivered strong returns alongside favorable stock performance-a rare alignment that doesn’t always occur. This divergence matters. When stocks crash in recession scenarios, gold often rises, particularly when inflation expectations spike. Historical correlation data show gold’s non-correlation with stocks and bonds, meaning it genuinely reduces portfolio volatility rather than simply adding another equity-like position. The 2002-2008 period and 2008 crisis provided the clearest evidence: gold moved opposite to equities during genuine systemic stress. However, gold provides no guaranteed protection and isn’t infallible during all market dislocations.
Moving From Theory to Action
The key is positioning gold as part of a deliberate allocation strategy, not as a speculative bet. For most investors, this means combining physical gold for sovereignty and privacy with paper gold for liquidity, balanced according to your risk tolerance and portfolio goals. Understanding gold’s price drivers and historical performance sets the foundation, but the real challenge lies in evaluating which gold mining companies and stocks actually deliver returns. The next section walks you through the specific metrics and frameworks that separate quality gold producers from mediocre ones.
How to Assess Gold Mining Companies and Separate Winners From Losers
The Metrics That Actually Predict Mining Stock Returns
Evaluating gold mining stocks requires specificity. Most investors focus on production volume or reserve size, then watch their picks underperform. The real drivers of mining stock returns are all-in sustaining costs, reserve life, and cash flow generation relative to gold prices. Newmont Corporation, the world’s largest gold miner, produces roughly 5.3 million ounces annually from continuing operations after divesting six higher-cost, smaller mines in 2026. This strategic pruning shifts the production mix toward higher-margin assets, directly improving per-share cash flow.
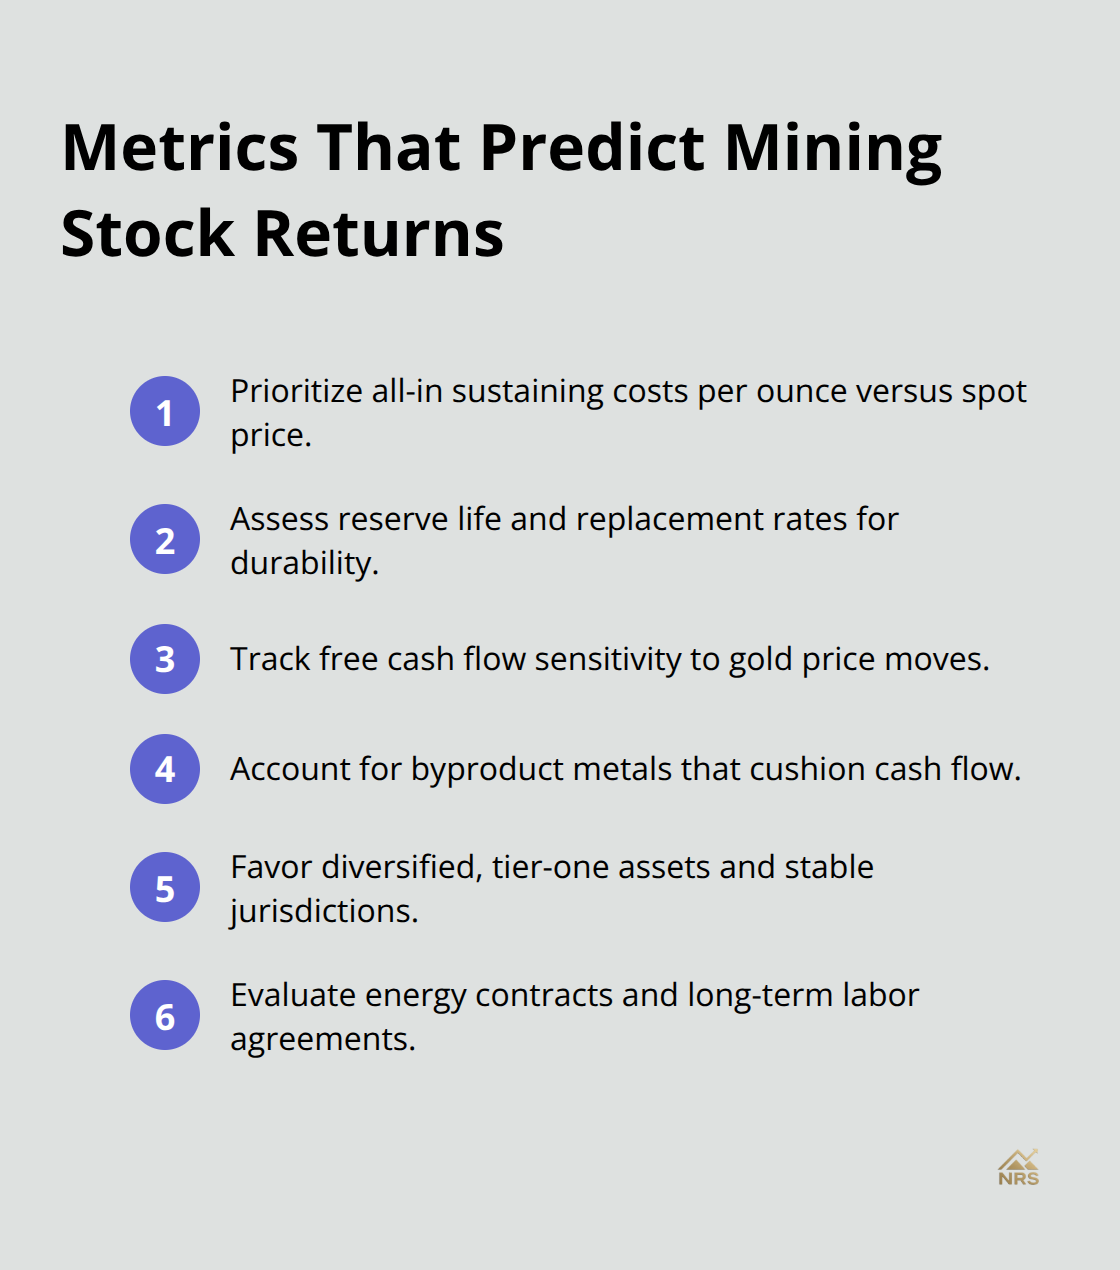
When evaluating any gold producer, calculate all-in sustaining costs per ounce and compare it to current spot prices. A miner with $1,200 per ounce costs performs dramatically better than one with $1,600 costs when gold trades at $2,000. This gap compounds over time and determines whether a stock delivers shareholder returns or destroys value.
Byproduct Metals and Hidden Diversification
Newmont generates substantial byproduct metals, notably copper and silver, which cushion returns when gold prices move sideways. This diversification within a single miner’s cash flow is a hidden advantage most investors overlook. When gold stagnates but copper rallies, byproduct revenue offsets flat gold margins. The reverse also holds: copper weakness gets offset by gold strength. This internal hedging mechanism makes large producers more resilient than single-commodity miners.
Geographic Spread Reduces Concentration Risk
Large-cap miners like Newmont operate across geographies spanning the Americas, Africa, Australia, and Papua New Guinea, spreading political and operational risk. Junior miners, conversely, typically operate one or two projects in single jurisdictions, concentrating both upside and downside. For most portfolio builders, a core position in a tier-one producer like Newmont paired with exposure via diversified mining ETFs such as XME or VAW creates the right balance. This two-tier approach captures the quality and stability of established producers while gaining geographic and commodity diversification without micromanaging individual junior positions.
Geopolitical and Regulatory Risk Surprises
Geopolitical and regulatory risk often surprises investors because they focus on gold prices alone. A mine operating in politically unstable regions faces permit revocation, workforce disruption, or sudden tax increases that no gold price movement can offset. Newmont’s 2019 Nevada joint venture with Barrick and its 2023 Newcrest acquisition both expanded production in stable jurisdictions, reducing concentration in emerging markets.
When analyzing any gold stock, research the jurisdiction’s recent policy changes, tax history, and relationship with foreign investors. A miner operating in countries with stable rule of law and established tax codes faces far lower regulatory surprises than one in nations with histories of sudden policy shifts. Morningstar provides analyst coverage on Newmont and other major producers, offering research validation on growth trajectories and risk factors. Argus publishes detailed analyst reports on mining companies that assess both operational metrics and macro drivers.
Energy Costs and Labor Agreements Shape Competitive Position
Energy and labor costs directly impact miner profitability but fluctuate independently from gold prices. A miner with locked-in renewable energy contracts or long-term labor agreements gains a competitive edge during cost inflation cycles. These operational advantages often matter more than reserve size because they protect margins when input costs spike.
Avoid chasing junior miners purely for exploration upside unless you possess genuine expertise in evaluating ore bodies and development risk. The leverage cuts both ways: junior miners can deliver outsized returns on successful discoveries, but most fail to reach production or destroy shareholder value through dilution and management missteps. A disciplined approach combines a core holding in a proven large-cap producer with cost-conscious exposure to diversified mining ETFs, guided by research from Morningstar and Argus. With these evaluation frameworks in place, the next step involves constructing a portfolio that balances these quality producers with broader mining exposure while managing position sizes according to your risk tolerance.
Building Your Gold Portfolio Structure
The gap between owning gold and building a strategic portfolio lies in how you structure positions. A single large-cap miner holding or a physical gold stash solves nothing without deliberate allocation rules. A two-tier structure works best: establish a core position in a proven tier-one producer like Newmont, then layer diversified mining ETF exposure on top. This approach gives you the stability and cash flow visibility of established miners while avoiding the trap of micromanaging individual junior exploration plays. Newmont’s 5.3 million ounce annual production from continuing operations after 2026 divestitures demonstrates exactly how large-cap miners generate predictable cash flows.
Core Holdings and ETF Diversification
Pair your core Newmont position with exposure through ETFs such as XME (SPDR S&P Metals & Mining), VAW (Vanguard Materials ETF), or IYM (iShares U.S. Basic Materials ETF) to capture geographic and commodity diversification without operational complexity. If Newmont represents 40% of your gold equity allocation, the remaining 60% across diversified mining ETFs gives you exposure to smaller producers, emerging projects, and byproduct metals like copper and silver without concentration risk. This structure eliminates the need to track ten junior miners simultaneously while maintaining meaningful upside participation.
Physical Gold Allocation and Paper Alternatives
Physical gold allocation should represent 5% to 10% of total portfolio value for investors genuinely concerned with counterparty risk or currency collapse scenarios. Beyond that range, you hold a non-yielding asset that creates drag on returns. Paper gold through ETFs backed by physical bullion eliminates the 5% to 10% premium over spot price and sidesteps storage fees entirely. Most investors benefit from this approach due to superior liquidity and lower costs.
Position Sizing for Risk Management
Position sizing matters more than stock selection. Most investors fail not because they picked the wrong miner but because they sized positions too large relative to their risk tolerance. A 3% to 5% allocation to gold equities and 1% to 3% to physical gold works for most diversified portfolios. Risk-tolerant investors seeking genuine portfolio stabilization during equity crashes can push toward the upper end. Conservative investors should stay below 2% total gold exposure and avoid junior miners entirely.
Rebalancing Triggers and Exit Rules
Quarterly rebalancing tied to gold price movements prevents sentiment-driven mistakes. When gold rallies 20% in three months while your equity allocation stays flat, your gold position drifts from 4% to 6% of portfolio value. Trim it back to target. When gold crashes 15%, resist panic selling; instead, rebalance by adding to the position if it falls below your target weight. This mechanical discipline prevents the common mistake of buying high and selling low.
Monitor all-in sustaining costs for gold mining for your core Newmont position or whichever large-cap miner you hold. If spot gold prices fall below $1,800 per ounce and your miner’s costs sit at $1,400, you maintain a $400-per-ounce margin. If costs creep toward $1,600, that margin compresses and warrants a position review. Set a specific trigger: if your core miner’s all-in costs exceed 75% of current gold prices, trim the position by 25% and reallocate to the ETF component.
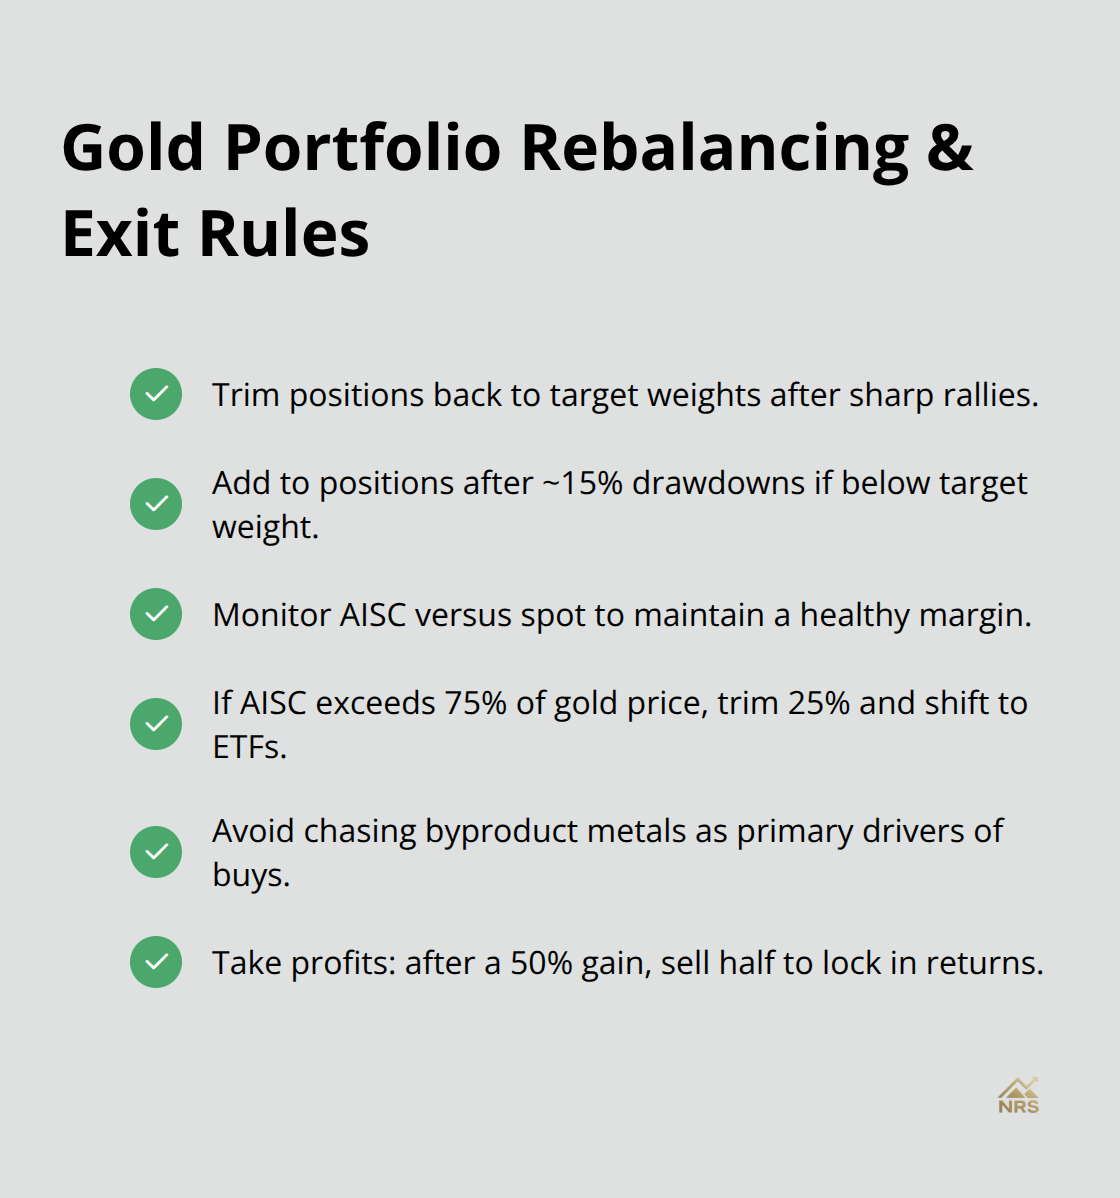
Avoid chasing byproduct metals as primary drivers. Copper and silver generate meaningful cash flow for large producers but shouldn’t drive your buy decision. Treat them as upside optionality when commodity cycles align favorably. Establish a clear exit rule before buying. If your large-cap miner position delivers a 50% gain, sell half and lock in profits. Greed kills gold portfolios more reliably than bear markets.
Final Thoughts
Building a strategic gold portfolio requires discipline, not complexity. The framework we’ve outlined at Natural Resource Stocks rests on three core principles: evaluate gold mining companies using concrete metrics like all-in sustaining costs and reserve life, structure positions through a two-tier approach combining large-cap producers with diversified mining ETFs, and manage risk through position sizing and mechanical rebalancing rules. Gold stock picks succeed when you treat them as portfolio stabilizers, not speculation vehicles.
Your core holding in a tier-one producer like Newmont paired with ETF exposure captures both the cash flow predictability of established miners and the geographic diversification that protects against concentrated risk. Physical gold allocation between 5% and 10% of portfolio value addresses genuine counterparty concerns, while paper gold through ETFs serves most investors more efficiently. Start implementing immediately by defining gold’s specific role in your portfolio-are you hedging against currency weakness, geopolitical risk, or inflation?
Open a brokerage account if you haven’t already, research Newmont’s latest production guidance and all-in costs, then establish your core position. Layer in ETF exposure through XME or VAW within two weeks to avoid timing the market. For ongoing research and market analysis, explore Natural Resource Stocks for expert video and podcast content covering macroeconomic factors affecting gold prices and geopolitical impacts on mining operations.