Platinum prices have experienced dramatic swings over the past five decades, from $100 per ounce in the 1970s to peaks above $2,200 in 2008. A platinum value graph reveals these volatile patterns shaped by industrial demand shifts and supply constraints.
We at Natural Resource Stocks track how automotive industry changes and mining disruptions continue driving price movements. Understanding these historical trends helps investors navigate this complex precious metals market.
What Drove Platinum’s Wild Price Swings
Platinum’s price journey from $100 per ounce in the 1970s to its March 2008 peak of $2,290 reveals three distinct phases of market behavior. The 1970s and 1980s saw steady growth as automotive demand expanded, with prices that reached $400-600 per ounce. The real action started in the 1990s when South African strikes disrupted production. The 2008 financial crisis created the perfect storm: speculative buyers, supply fears, and industrial demand pushed platinum to its all-time high before it crashed 70% within months as the global economy collapsed.
Platinum Outperformed Gold Until 2015
The platinum-to-gold ratio tells the real story of market sentiment shifts. From 1970 to 2015, platinum consistently traded at a premium to gold (often 1.5 to 2 times gold price). This premium reflected platinum’s industrial utility and rarity. However, since 2015, platinum trades at a discount to gold, currently around $1,590 versus gold’s higher levels. The 2020 pandemic crash saw platinum hit decade lows near $600 while gold surged past $2,000. This divergence signals a fundamental shift: investors now view platinum as an industrial commodity rather than a store of value.
Supply Shocks Created the Biggest Price Moves
South Africa’s dominance in production makes the metal vulnerable to geopolitical disruptions. The 2012-2014 strikes removed nearly 1 million ounces from the market, which created severe shortages that pushed prices above $1,400. Political instability and power outages in South Africa continue to affect production levels today. The World Platinum Investment Council forecasts supply deficits through 2026 due to lower mined output, yet prices remain subdued because automotive demand shifts toward electric vehicles.
Industrial Demand Patterns Shape Long-Term Trends
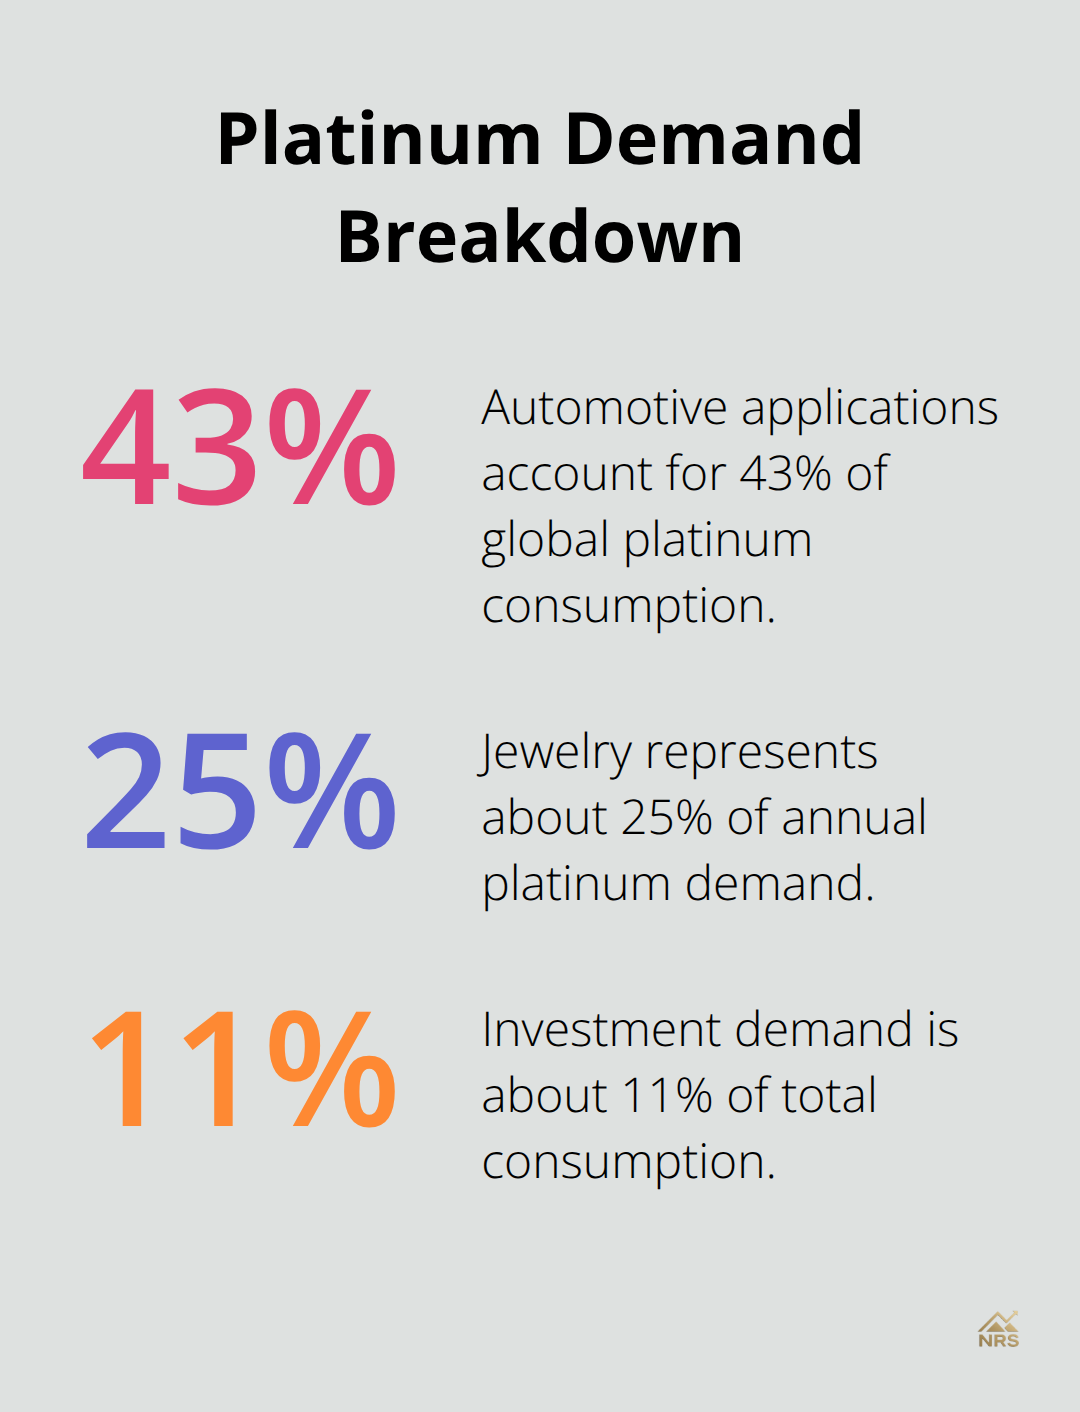
Automotive applications account for 43% of global platinum consumption, primarily for catalytic converters in diesel engines. Stricter environmental regulations worldwide boost demand for platinum in automotive applications. The jewelry industry constitutes about 25% of annual platinum demand, with its hypoallergenic properties that make it desirable for consumers with sensitive skin.
These industrial applications create steady baseline demand that supports price floors during economic downturns, though they also limit upside potential when industrial activity slows.
What Really Moves Platinum Prices
The automotive sector drives 43% of platinum demand through catalytic converter production, which makes car sales data a primary indicator for price movements. European diesel regulations and Chinese emission standards directly impact platinum consumption rates. The World Platinum Investment Council reports that every 1% increase in global auto production translates to roughly 15,000 ounces of additional platinum demand.
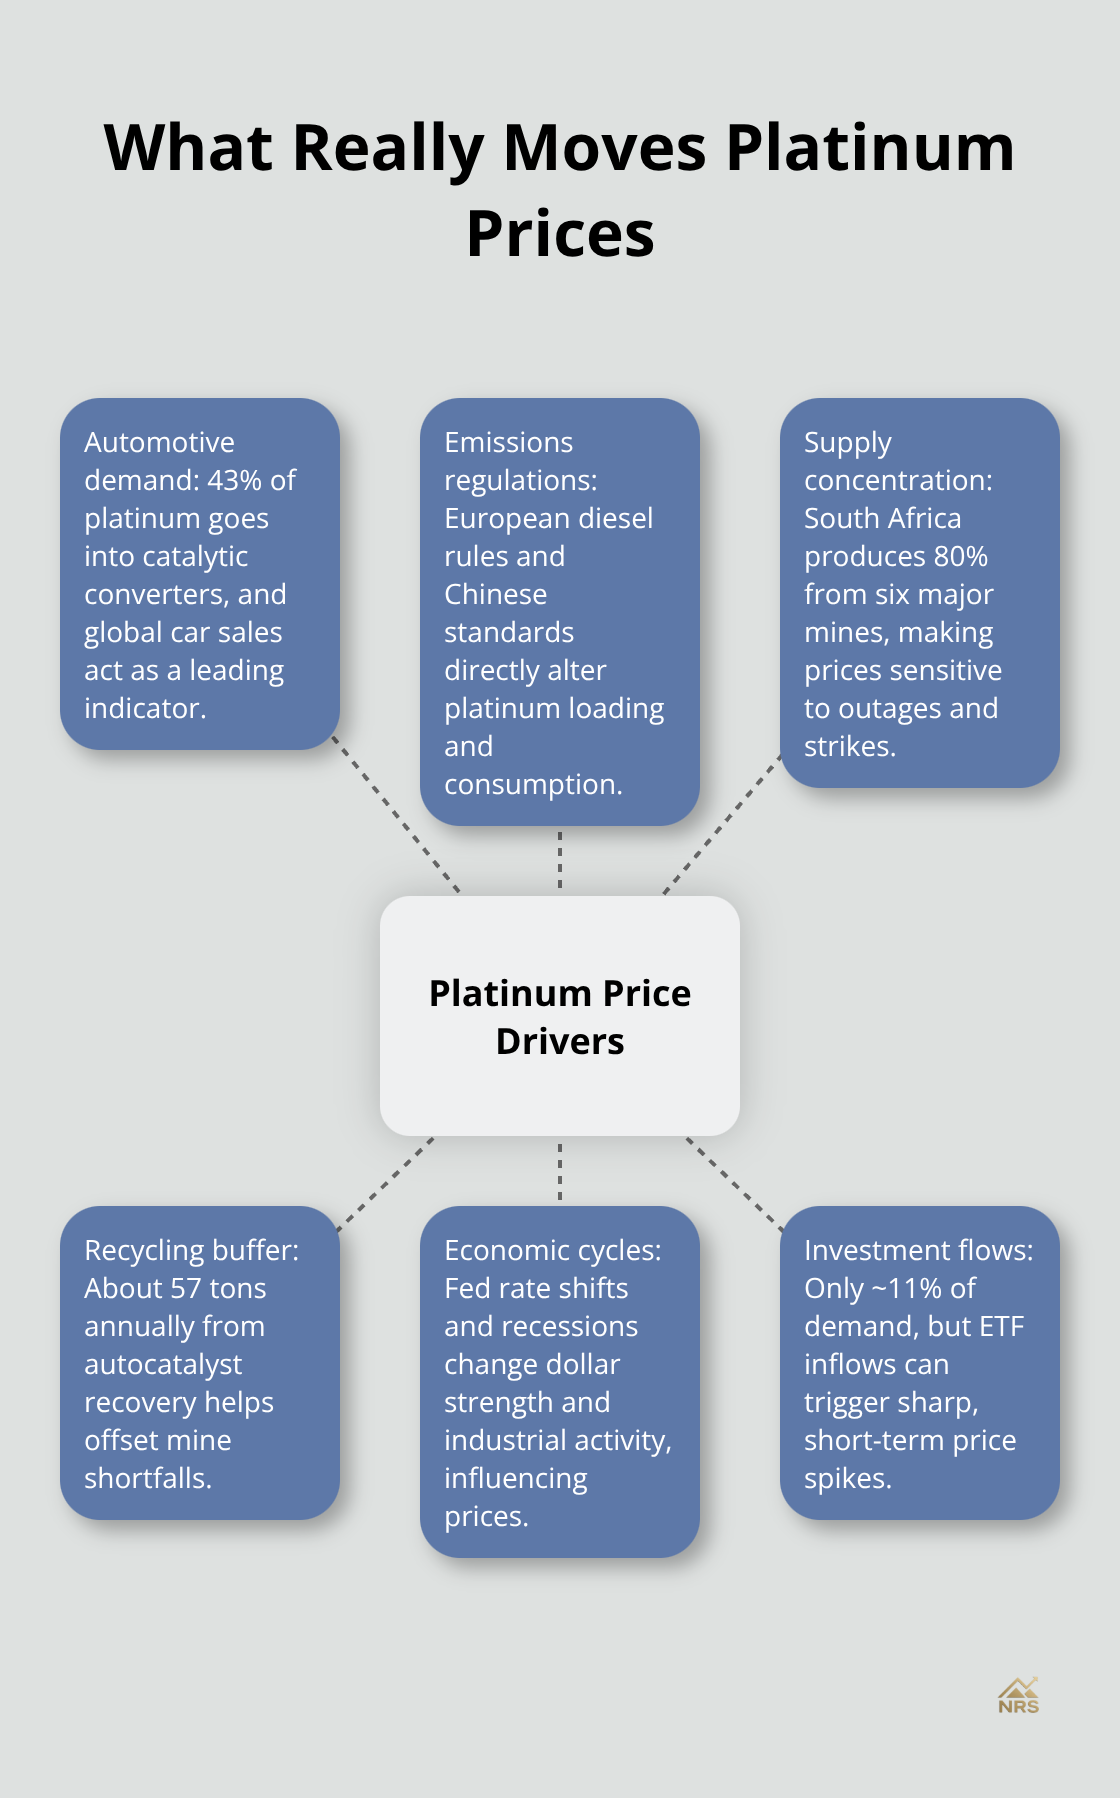
Jewelry demand accounts for 25% of consumption, with India and China leading purchases during wedding seasons and festivals. Investment demand remains volatile at just 11% of total consumption, but ETF inflows can create significant price spikes during market uncertainty.
Supply Concentration Creates Price Volatility
South Africa produces 80% of global platinum from just six major mines, which creates extreme supply concentration risk. The 2014 strikes affected 40% of worldwide production for five months and demonstrated how labor disputes translate directly into price volatility. Power outages and infrastructure failures regularly reduce South African output by 10-15% annually.
Russian production represents the second-largest source, which makes geopolitical sanctions a major price factor. The World Platinum Investment Council forecasts supply deficits through 2026 due to aging mines and reduced capital investment. Zimbabwe and North America contribute smaller amounts but offer geographic diversification that investors should monitor.
Secondary Supply Provides Market Buffer
Recycling provides 57 tons annually from autocatalyst recovery, though this secondary supply depends on vehicle scrappage rates and collection efficiency. Automotive recyclers recover platinum from old catalytic converters when vehicles reach end-of-life (typically 12-15 years). This recycled platinum helps offset mine production shortfalls during supply disruptions.
The recycling process requires specialized facilities and high-temperature processing, which limits the number of active recovery operations globally. Market prices above $1,500 per ounce make recycling operations profitable and increase recovery rates.
Economic Cycles Determine Investment Appetite
Platinum behaves as both an industrial commodity and precious metal, which creates complex price dynamics during economic transitions. Federal Reserve rate decisions impact platinum through dollar strength and industrial demand expectations. The metal typically underperforms during recessions as automotive production falls but recovers faster than gold during economic expansion.
Investment demand surges during inflation fears, though platinum lacks gold’s safe-haven reputation among institutional buyers. Current market conditions show platinum trades at a discount to gold (around $1,590 versus gold’s higher levels), which reflects this sentiment shift since 2015.
These fundamental drivers set the stage for understanding how recent market developments have shaped platinum’s performance over the past five years.
What Changed for Platinum Since 2020
Platinum prices collapsed from $1,000 per ounce in early 2020 to $600 during the March pandemic crash, then surged 160% to peak at $1,340 in February 2021 before it settled around current levels near $1,590. This 2025 performance shows platinum up nearly 50% year-to-date, which outperforms both gold and silver as supply deficits intensify. The World Platinum Investment Council forecasts continued shortages through 2026 as South African mines struggle with power outages and infrastructure that reduce output by 15% annually.
Electric Vehicle Growth Reshapes Demand Patterns
Electric vehicle sales reached 15.8% of global light vehicle sales in 2023, with BEVs accounting for 11.1% and PHEVs for 4.7%, eliminating platinum demand from those vehicles since EVs require no catalytic converters. Tesla alone sold 1.8 million vehicles in 2023, each vehicle represented lost platinum consumption of roughly 3-5 grams per unit. However, stricter Euro 7 emissions standards that start in 2026 will require more platinum per diesel catalytic converter, which offsets some EV losses.
China phases out platinum tax rebates on November 1, 2025, which increases competition and may pressure prices despite industrial applications in fuel cells and hydrogen production facilities that continue to rise.
Production Disruptions Hit Major Mines
South African platinum mines operated at 70% capacity in 2024 due to blackouts and infrastructure failures that cost the industry 400,000 ounces of production. Anglo American Platinum, the world’s largest producer, reported 11% decline in own-mined production in 2024 as ore grades decline and operational costs rise. Russian sanctions eliminated approximately 700,000 ounces from global supply chains, while Zimbabwean producers increased output by 25% to partially fill supply gaps.
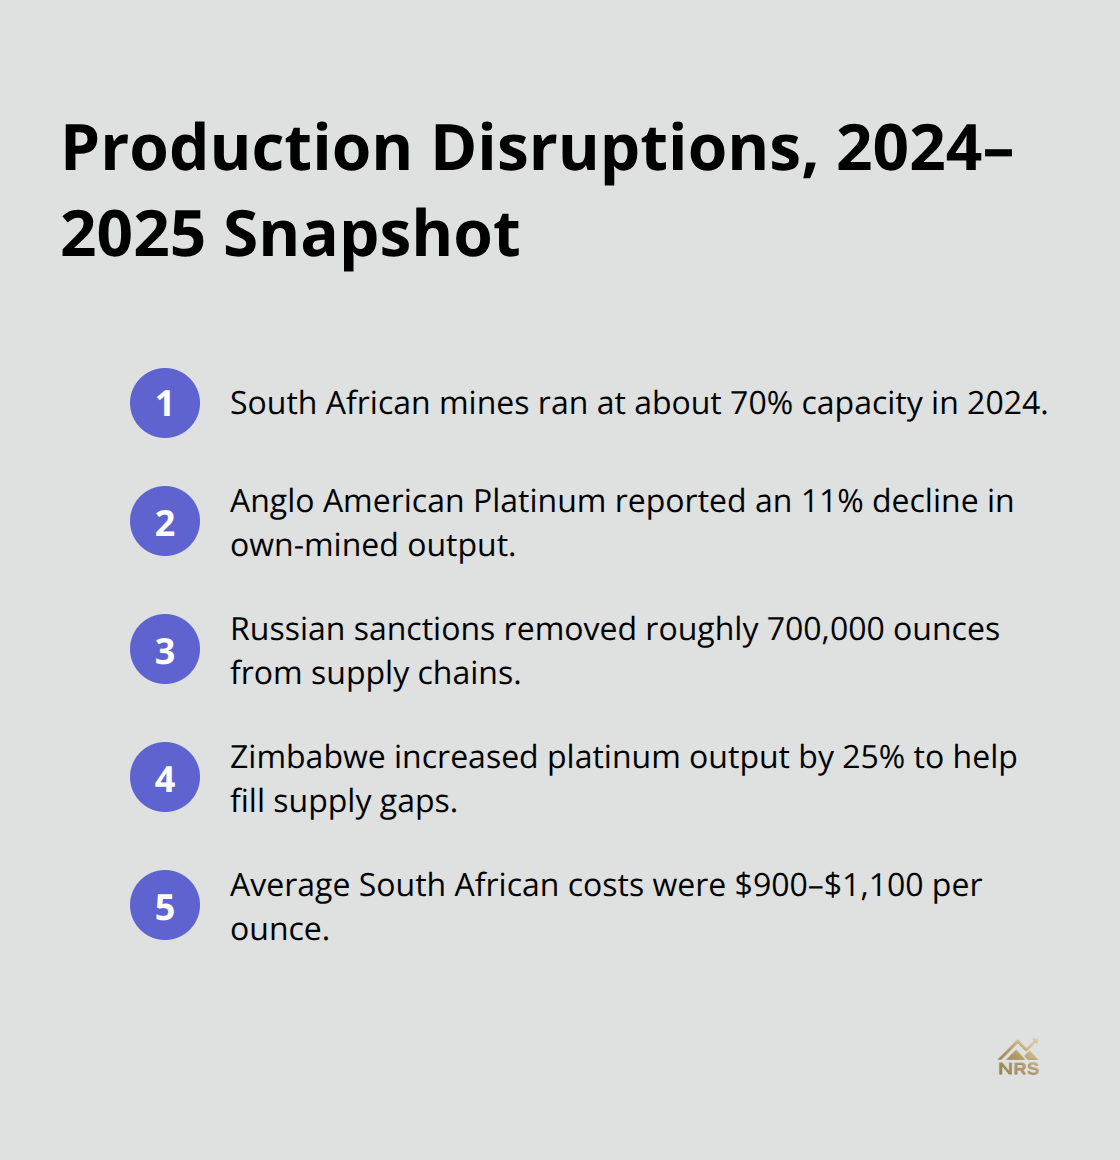
Current costs average $900-1,100 per ounce in South Africa (which makes operations profitable at current price levels) but limit expansion investment that could address long-term supply deficits.
Investment Demand Patterns Shift
Investment demand through ETFs surged during 2020-2021 market uncertainty but declined as investors rotated toward technology stocks and bonds. Physical platinum investment remains limited compared to gold, with most investors preferring exposure through mining stocks rather than direct metal ownership. The platinum-to-gold ratio trades near historic lows around 0.75, which indicates potential value opportunities for contrarian investors who believe industrial demand will recover.
Market participants now view platinum primarily as an industrial commodity rather than a safe-haven asset, which creates different price dynamics than traditional precious metals during economic stress periods.
Final Thoughts
Platinum’s price evolution from $100 per ounce in the 1970s to today’s $1,590 level reveals a metal caught between industrial utility and investment demand. The platinum value graph shows distinct phases: steady automotive-driven growth through 2008, speculative peaks during financial crisis, and recent industrial commodity behavior since 2015. We at Natural Resource Stocks see three key investment implications for natural resource investors.
Platinum’s 80% supply concentration in South Africa creates ongoing volatility from geopolitical risks and infrastructure failures. The automotive transition toward electric vehicles fundamentally alters demand patterns, though stricter emissions standards partially offset EV losses. Platinum trades at historic discounts to gold (presenting contrarian opportunities for investors who believe industrial applications will expand).
The supply-demand fundamentals point toward continued deficits through 2026 as mine production declines while hydrogen fuel cell technology and industrial applications grow. However, platinum behaves more like copper than gold during economic cycles, which makes it suitable for investors who seek industrial commodity exposure rather than safe-haven assets. Natural Resource Stocks provides expert analysis and market insights to help investors navigate these complex precious metals dynamics across the natural resource landscape.
