


Precious metal prices shift constantly, and most investors miss the best opportunities because they’re watching the wrong sources. At Natural Resource Stocks, we’ve seen how comparing precious metal prices across multiple platforms reveals gaps that can cost you thousands.
The difference between a smart purchase and an expensive mistake often comes down to understanding where prices come from and what actually moves them. This guide walks you through the tools and strategies that separate informed buyers from the rest.
Where Precious Metal Prices Actually Come From
The London Bullion Market Association sets the official gold price twice daily through the London Gold Fixing, while the LBMA silver price is determined by ICE Benchmark Administration with a daily auction at 12:00 UK time. These benchmarks matter because international transactions and many dealer quotes anchor to these reference points. When a dealer quotes you a price, they typically mark it up from one of these sources. The spread between what dealers will pay you (bid) and what they’ll charge you (ask) is where they profit, and this gap widens dramatically during volatile market conditions. During normal trading, gold bid-ask spreads might be 50 cents to a dollar per ounce, but when markets spike due to geopolitical tension or Fed announcements, spreads can explode to 3 or 5 dollars.
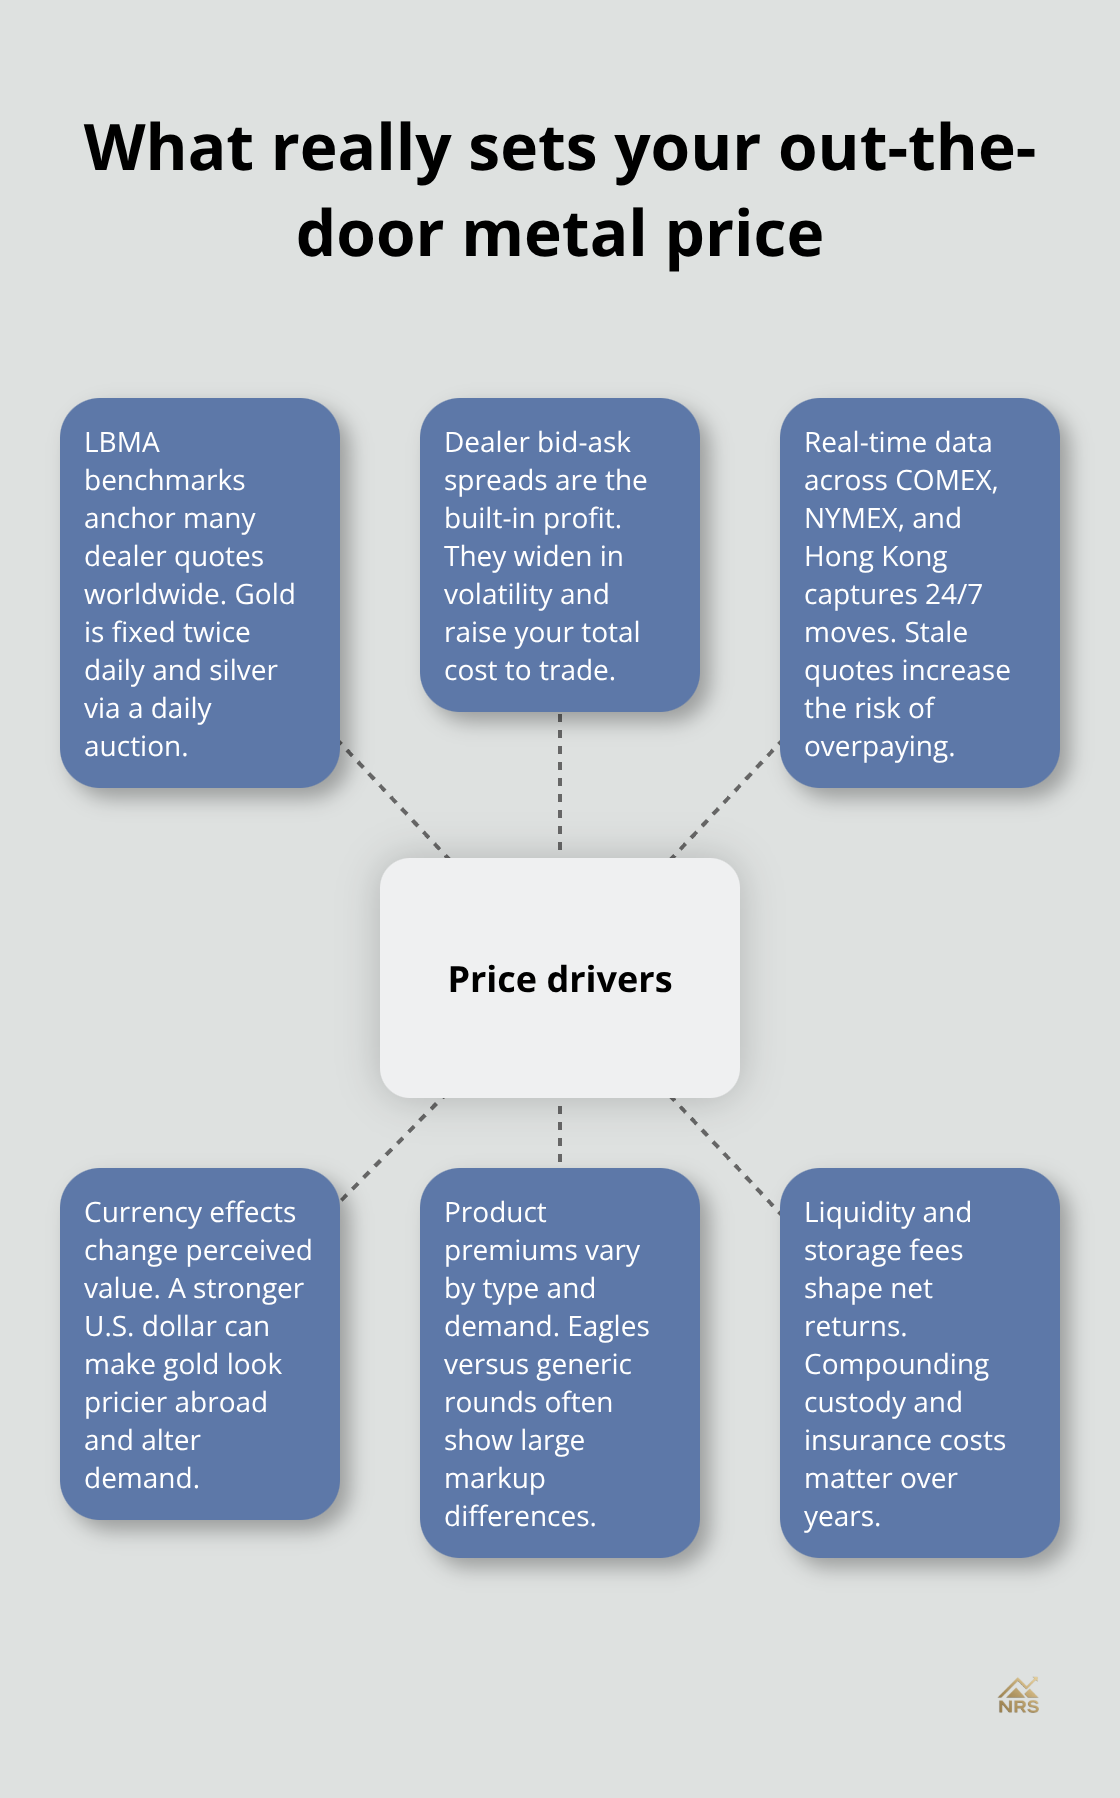
A wide spread means you pay more to buy and receive less when you sell, effectively taxing your entire position.
Real-Time Data Changes Everything
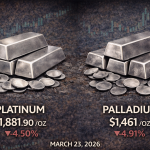
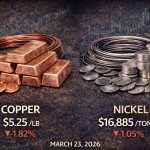
Real-time price feeds update every few seconds and capture spot prices plus futures movements across COMEX, NYMEX, and Hong Kong exchanges where precious metals trade 24/7. Outdated hourly or daily price quotes cost you money because markets react instantly to Fed policy announcements, geopolitical escalations, and currency swings. Gold surpassed 4,000 dollars per ounce in 2025, a milestone driven by central banks increasing reserves and inflation concerns, yet many investors learned about this shift days late through traditional news. You need a platform that shows live prices for gold, silver, platinum, and palladium across multiple currencies so you can assess value in your home currency and track how forex movements affect your holdings. Mobile access matters because metals trade around the clock and opportunities appear without warning. GoldFolio Portfolio Tracker on iOS lets you log all your purchases and see real-time valuations instantly, though if privacy concerns you, a simple Excel sheet updated with spot prices from LBMA or Kitco works just as well.
Historical Charts Reveal Patterns Dealers Hide
Ten and twenty-year price charts show that silver’s annual volatility swung nearly 70 percentage points between 2014 and 2020. This volatility reveals opportunities because sharp dips often precede strong recoveries. The gold-to-silver ratio, which hit 125 to 1 in 2020, acts as a powerful relative-value signal showing when one metal is undervalued against the other. When the ratio climbs above 100, silver historically offers better upside potential, while lower ratios below 80 can favor gold accumulation. Historical data also exposes seasonal patterns like stronger physical demand from India and China during certain months (patterns that influence dealer premiums and spot prices). Most dealers won’t volunteer this information, but examining five-year performance snapshots alongside macro data like inflation rates and bond yields helps you time purchases when metals are genuinely cheap versus when you’re just buying into hype.
Bid-Ask Spreads Widen When You Need Them Most
The bid-ask spread represents the dealer’s profit margin and directly impacts your total cost. During calm markets, spreads stay tight at under a dollar per ounce for gold, but geopolitical crises or major economic announcements can push spreads to 5 dollars or more. This expansion happens because dealers face higher uncertainty and wider inventory risks when volatility spikes. You can’t eliminate spreads, but you can minimize their impact by comparing quotes across multiple dealers before committing to a purchase. Tracking spreads over time also signals market stress-when spreads widen suddenly, it often means smart money is moving, and you should pay attention to what’s driving the shift.
Multiple Currencies Show True Value
Precious metals trade in dollars, but their value shifts when you convert to euros, pounds, or other currencies. A gold price that looks expensive in dollars might appear cheap in euros if the dollar strengthens. Platforms that display prices across multiple currencies (EUR, USD, CHF, GBP, CAD, AUD, JPY, CNY) let you assess whether currency movements are creating opportunities or illusions. This matters especially if you transact internationally or hold metals in different countries. Understanding currency context prevents you from chasing phantom gains that evaporate once you account for forex headwinds.
Now that you understand where prices originate and how to access real-time data, the next step is recognizing what actually moves those prices. Supply constraints, geopolitical shocks, and central bank decisions create the volatility that separates profitable timing from costly mistakes.
What Actually Moves Precious Metal Prices
Central Banks Drive Price Direction More Than Supply
Mining output and industrial demand create the baseline supply and demand equation, but this foundation matters far less than most investors think. Central banks purchasing gold reserves drive far more price movement than jewelry demand or manufacturing needs. In 2024 and 2025, central banks accumulated gold at accelerating rates as they hedged against currency devaluation and geopolitical instability, creating sustained upward pressure that spot prices reflect immediately. The World Gold Council tracks these purchases monthly, and when accumulation spikes, prices typically follow within days. You should monitor central bank reserve announcements through Reuters and Bloomberg because they signal institutional conviction about gold’s value. When China or Russia increase holdings significantly, Western investors often react by buying, which pushes prices higher before the broader market catches up. This means tracking central bank activity gives you a timing edge that casual investors miss entirely.
Currency Strength Determines Affordability Across Markets
Currency strength determines whether precious metals look expensive or cheap in your home currency, and this relationship matters more than most people realize. A stronger US dollar makes gold more expensive for foreign buyers, which can suppress international demand and pressure prices downward even when supply remains constant. Conversely, dollar weakness makes metals cheaper for overseas buyers and often triggers buying waves that push prices up. Federal Reserve interest rate decisions directly influence dollar strength, so Fed announcements move precious metal prices before economic data confirms the direction.
Inflation Data Triggers Immediate Price Reactions
Inflation data matters because rising inflation erodes currency purchasing power, which historically drives investors toward gold as a store of value. When CPI readings climb above expectations, gold typically gains within hours because investors fear currency debasement. You should set calendar alerts for Fed policy announcements, inflation reports, and jobs data because these economic releases create the volatility that generates both opportunities and losses.
Geopolitical Tensions Push Investors Toward Safe-Haven Assets
Geopolitical tensions amplify price movements because they increase demand for safe-haven assets. Wars, trade sanctions, or political instability push investors toward precious metals as insurance against broader economic disruption. The Middle East tensions in 2024 and 2025 drove gold prices higher because investors feared supply chain disruption and currency instability. You cannot predict geopolitical events, but you can recognize that when tensions rise, metals often outperform stocks and bonds. This means holding some precious metals makes sense not because geopolitics will definitely worsen, but because the protection they provides during crises justifies the allocation. Track geopolitical news through mainstream outlets like Reuters, Bloomberg, and the Wall Street Journal, then cross-reference price movements to understand which tensions actually move markets versus which ones investors ignore.
Now that you understand the forces that move prices, the next step involves comparing those prices across sources to identify where dealers offer genuine value and where they exploit information gaps.
Where Dealers Hide Their Margins
Comparing precious metal prices across dealers reveals a brutal truth: the same ounce of gold carries wildly different total costs depending on where you buy. The spot price you see on LBMA or COMEX represents only the starting point. Dealers layer premiums on top of spot, and these markups vary dramatically by product type, dealer, and market conditions.
Premium Variations Across Product Types
A generic silver round costs 3 to 6 dollars over spot, while an American Silver Eagle commands 8 to 12 dollars per ounce. Government-issued coins like American Gold Eagles carry even steeper premiums, sometimes 50 to 150 dollars above spot per ounce, because buyers value the recognition and liquidity they provide. The critical insight is that premium levels fluctuate daily based on demand and supply constraints.
During COVID-19 disruptions, silver premiums surged from 4 to 5 dollars over spot to 8 to 12 dollars, a significant jump that persisted into the new normal we see today. Large bars like 100-ounce or kilogram products drop significantly in premium because they carry minimal numismatic value and pure metal content drives pricing. This means purchasing 100 ounces of generic bars costs far less per ounce than purchasing one ounce American Gold Eagles, even though both contain identical gold content.
Research Multiple Dealers to Establish Fair Pricing
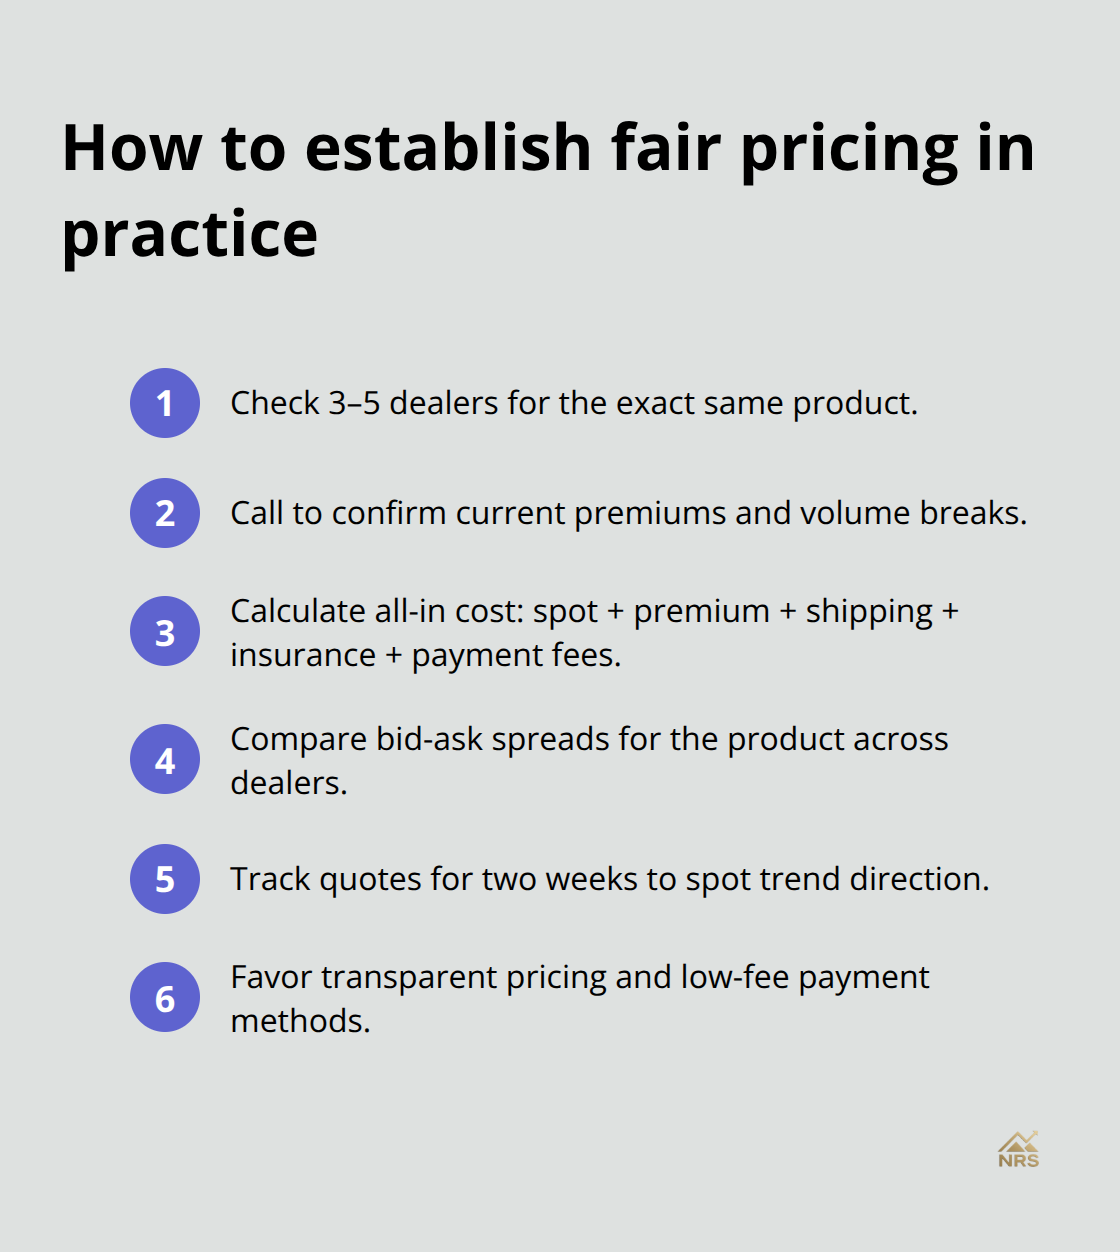
You must research at least three to five dealers simultaneously to establish a realistic market range for identical products. Call dealers directly and ask their current premiums on your target items, available volume discounts, and lowest-fee payment methods. Calculate your total investment cost by adding spot price plus premium plus shipping plus insurance plus any payment method fees.
Dealers who hide their premiums or use vague language about pricing are signaling that they’re counting on your confusion to inflate margins.
Track prices for your target products across Kitco, LBMA reference prices, and at least three dealers for two weeks before committing to a purchase. This tracking period reveals whether premiums are stable or climbing, which signals whether demand is increasing and prices might accelerate upward.
Storage and Liquidation Costs Impact Total Returns
Storage and liquidation costs matter equally when comparing prices, yet most investors ignore these expenses until they try to sell. Physical metals stored at home carry insurance costs ranging from 0.1 to 0.3 percent annually depending on your homeowner policy and declared value. Depository storage through reputable custodians typically costs 0.5 to 1 percent annually plus an initial setup fee. These costs compound over years, so a dealer offering metals at a 2 percent premium but requiring expensive depository storage might cost you more than a dealer charging a 4 percent premium with no mandatory storage requirement.
When evaluating deals, ask dealers about their buyback guarantees and whether they charge fees to repurchase metals later. Local coin shops provide immediate cash settlements but typically offer below spot prices due to overhead costs and profit margins. Generic bullion offers the tightest spreads on both purchase and resale because dealers compete aggressively on commodity products, while rare coins and pre-1933 gold pieces carry wide spreads due to limited trading volume and subjective grading disputes.
Identify Red Flags Before Committing to a Purchase
Red flags include dealers offering prices far below market rates, aggressive pressure tactics, limited-time offers with no legitimate scarcity basis, missing industry credentials, or refusal to provide return policies. The Better Business Bureau maintains ratings for precious metals dealers, and checking BBB scores alongside customer reviews on independent sites prevents costly mistakes with unreliable sellers.
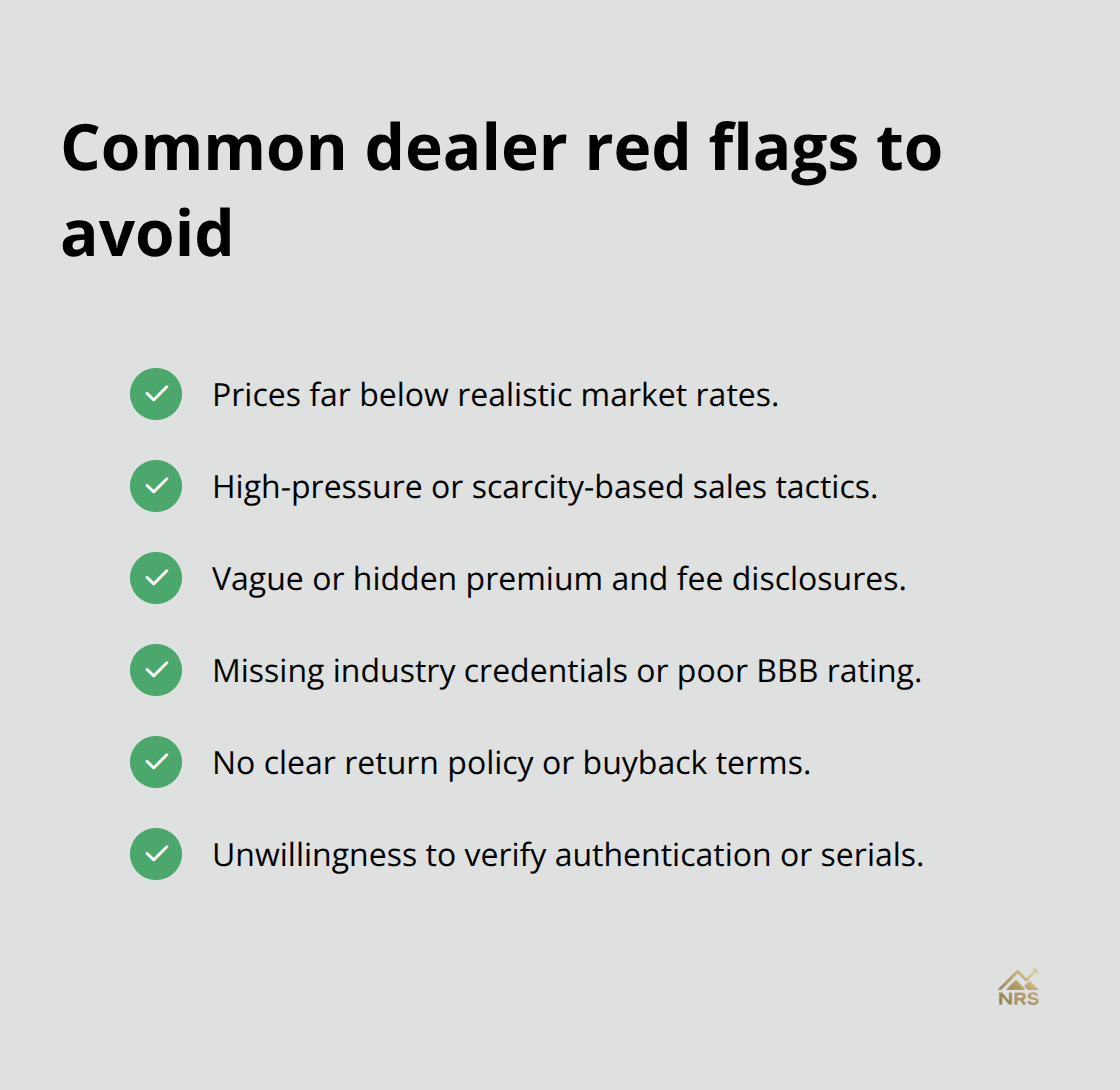
Verify that dealers hold industry memberships and possess transparent authentication guarantees before you hand over your money.
Final Thoughts
Comparing precious metal prices effectively requires you to access real-time data from authoritative sources, understand what moves prices beyond spot quotes, and calculate total costs including premiums and storage. Most investors check a single dealer’s website, see a price, and assume they obtained fair value-you now know this approach costs thousands over time. The LBMA gold fixing and ICE silver auction set benchmarks, but bid-ask spreads, premiums, and currency fluctuations create the actual landscape where you buy and sell metals.
Central bank activity drives prices more than mining output, inflation data triggers immediate reactions, and geopolitical tensions push metals higher when investors seek safety. When you compare precious metal prices across multiple dealers over a two-week period, you establish a realistic market range and spot dealers who exploit information gaps. A generic silver round at 3 to 6 dollars over spot costs far less per ounce than an American Silver Eagle at 8 to 12 dollars, yet both contain identical metal content.
Storage costs, liquidation spreads, and buyback policies matter equally to the initial purchase price because they compound over years. Set calendar alerts for Fed announcements and inflation reports, track the gold-to-silver ratio for relative value signals, and monitor central bank reserve changes through Reuters and Bloomberg. We at Natural Resource Stocks provide expert video and podcast content plus in-depth market analysis that helps you understand macroeconomic factors affecting resource prices-visit Natural Resource Stocks to access expert commentary on geopolitical impacts and engage with a community of informed investors who apply these strategies daily.