


Natural gas stocks offer compelling opportunities for investors seeking exposure to America’s energy transition. The sector spans exploration companies, pipeline operators, and utility providers.
We at Natural Resource Stocks see strong fundamentals driving this market forward. Learning how to invest in natural gas stocks requires understanding production costs, regulatory shifts, and demand patterns across the entire value chain.
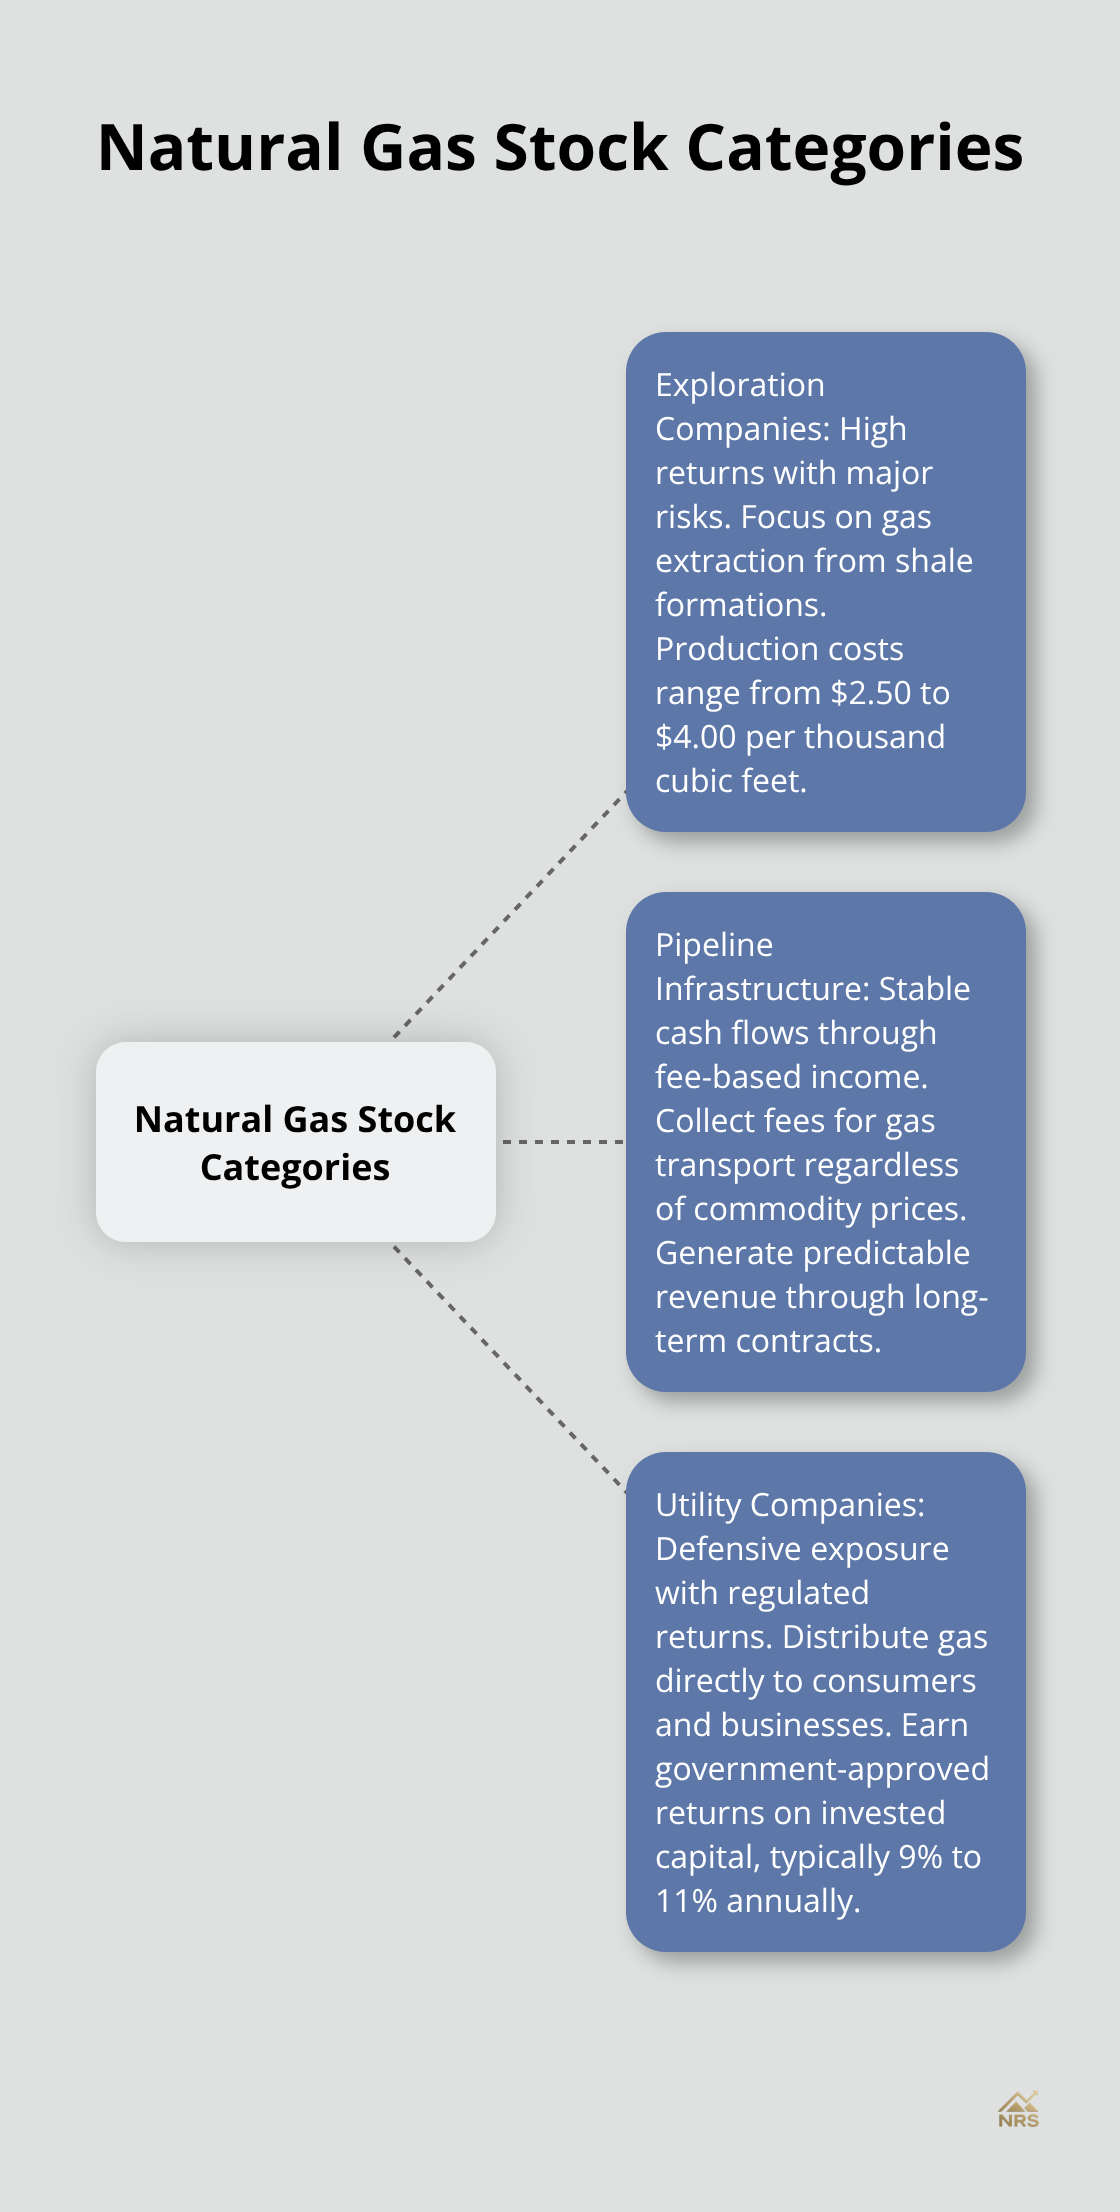
Which Natural Gas Stock Categories Should You Target?
Exploration Companies Deliver High Returns With Major Risks
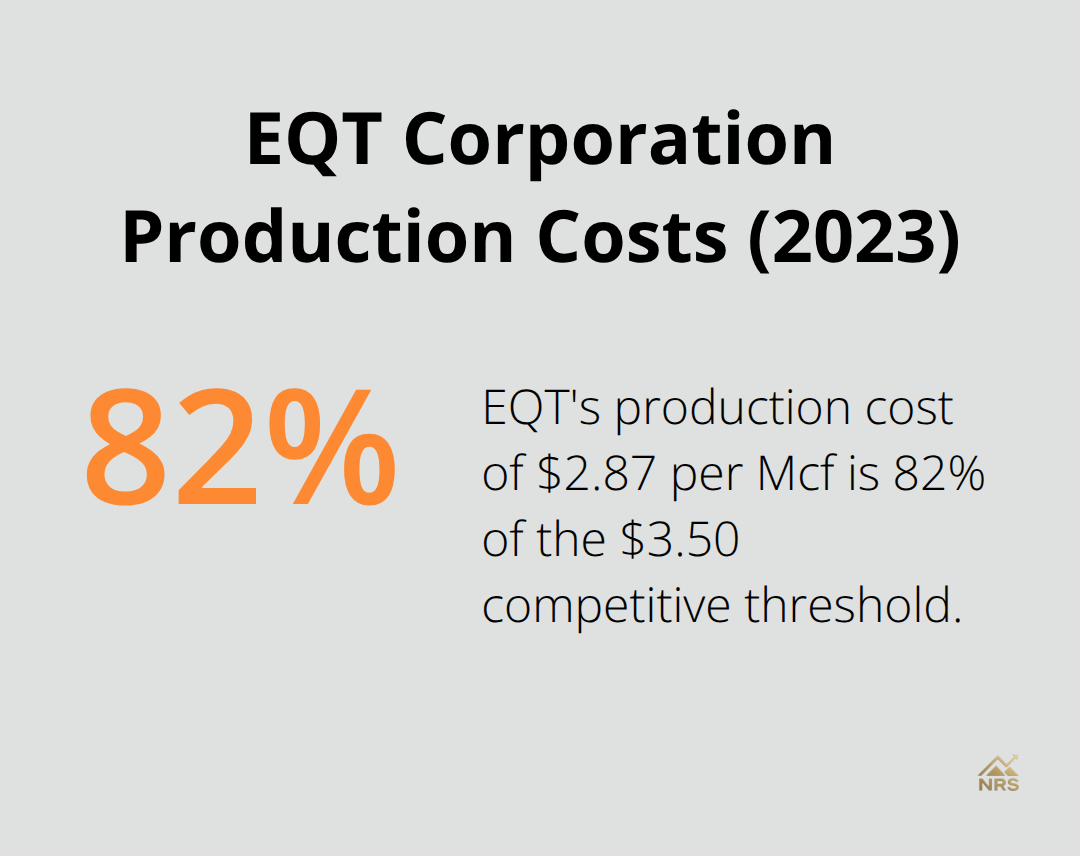
Natural gas exploration and production companies generate the highest returns but carry significant operational risks. Companies like EQT Corporation and Chesapeake Energy focus on gas extraction from shale formations, with production costs that range from $2.50 to $4.00 per thousand cubic feet. These upstream operators benefit directly from price spikes but face constant pressure from expenses and reserve depletion. EQT reported production costs of $2.87 per Mcf in 2023, which makes it competitive when natural gas trades above $3.50.
Pipeline Infrastructure Stocks Offer Stable Cash Flows
Pipeline and midstream companies like Kinder Morgan and TC Energy collect fees for gas transport regardless of commodity prices. These businesses generate predictable revenue through long-term contracts (typically $0.25 to $0.50 per Mcf transported). Kinder Morgan operates 70,000 miles of pipelines and reported 94% fee-based income in 2023. Interstate pipeline projects require Federal Energy Regulatory Commission approval, which creates regulatory barriers that protect existing operators from new competition.
Utility Companies Provide Defensive Exposure
Natural gas utilities such as Atmos Energy and National Fuel Gas distribute gas directly to consumers and businesses. These regulated monopolies earn government-approved returns on invested capital, typically 9% to 11% annually. Atmos Energy serves 3.7 million customers across eight states and increased its dividend for 40 consecutive years. Utilities benefit from residential and commercial demand growth as coal plants convert to cleaner natural gas generation (the Energy Information Administration projects 20% growth in gas-fired electricity by 2030).
Each category requires different analysis methods to identify the strongest investment opportunities within your risk tolerance.
What Financial Metrics Matter Most for Natural Gas Stocks?
Production Costs Separate Winners from Losers
Natural gas companies succeed or fail based on their production costs relative to market prices. The Marcellus Shale is the second largest natural gas producer in the U.S. with nearly 11,500 producing wells generating 7.53 trillion cubic feet in 2023, representing 18% of total U.S. natural gas production. Haynesville Shale costs range from $2.50 to $3.00 per Mcf (according to Wood Mackenzie data). Companies with breakeven costs above $3.50 per Mcf struggle when prices fall below $4.00.
Antero Resources achieved $2.31 per Mcf costs in 2023, which positions it well for volatile markets. Reserve quality matters equally – operators with 15-year+ reserves at current production rates offer better long-term stability than companies that burn through reserves in 8-10 years.
Regulatory Changes Create Investment Winners and Losers
Federal Energy Regulatory Commission pipeline approvals determine which midstream companies capture growth opportunities. The Mountain Valley Pipeline received final approval in 2023 after eight years of delays, which benefited Equitrans Midstream shareholders with 40% stock gains.
Environmental regulations force coal plant retirements nationwide – electricity generators plan to retire 12.3 gigawatts of capacity in 2025, a 65% increase in retirements compared with 2024, which drives natural gas demand higher. State-level renewable portfolio standards in California and New York limit long-term gas demand growth, which makes Appalachian producers more attractive than Western operators.
Price Volatility Patterns Guide Entry and Exit Decisions
Natural gas prices show predictable seasonal patterns with winter heating demand that drives prices 30-50% higher than summer levels. Henry Hub futures averaged $6.20 per Mcf in January 2023 versus $2.80 in July according to CME Group data.
Weather forecasts 30-45 days ahead provide early signals for price movements – La Niña winters typically increase heating demand and boost gas prices 15-25% above normal years. Storage levels published weekly by the Energy Information Administration reveal supply tightness when inventories fall below the five-year average range (3.2 to 3.8 trillion cubic feet).
These financial metrics form the foundation for smart investment strategies that capitalize on natural gas market cycles and sector rotation opportunities.
How Should You Build Your Natural Gas Portfolio
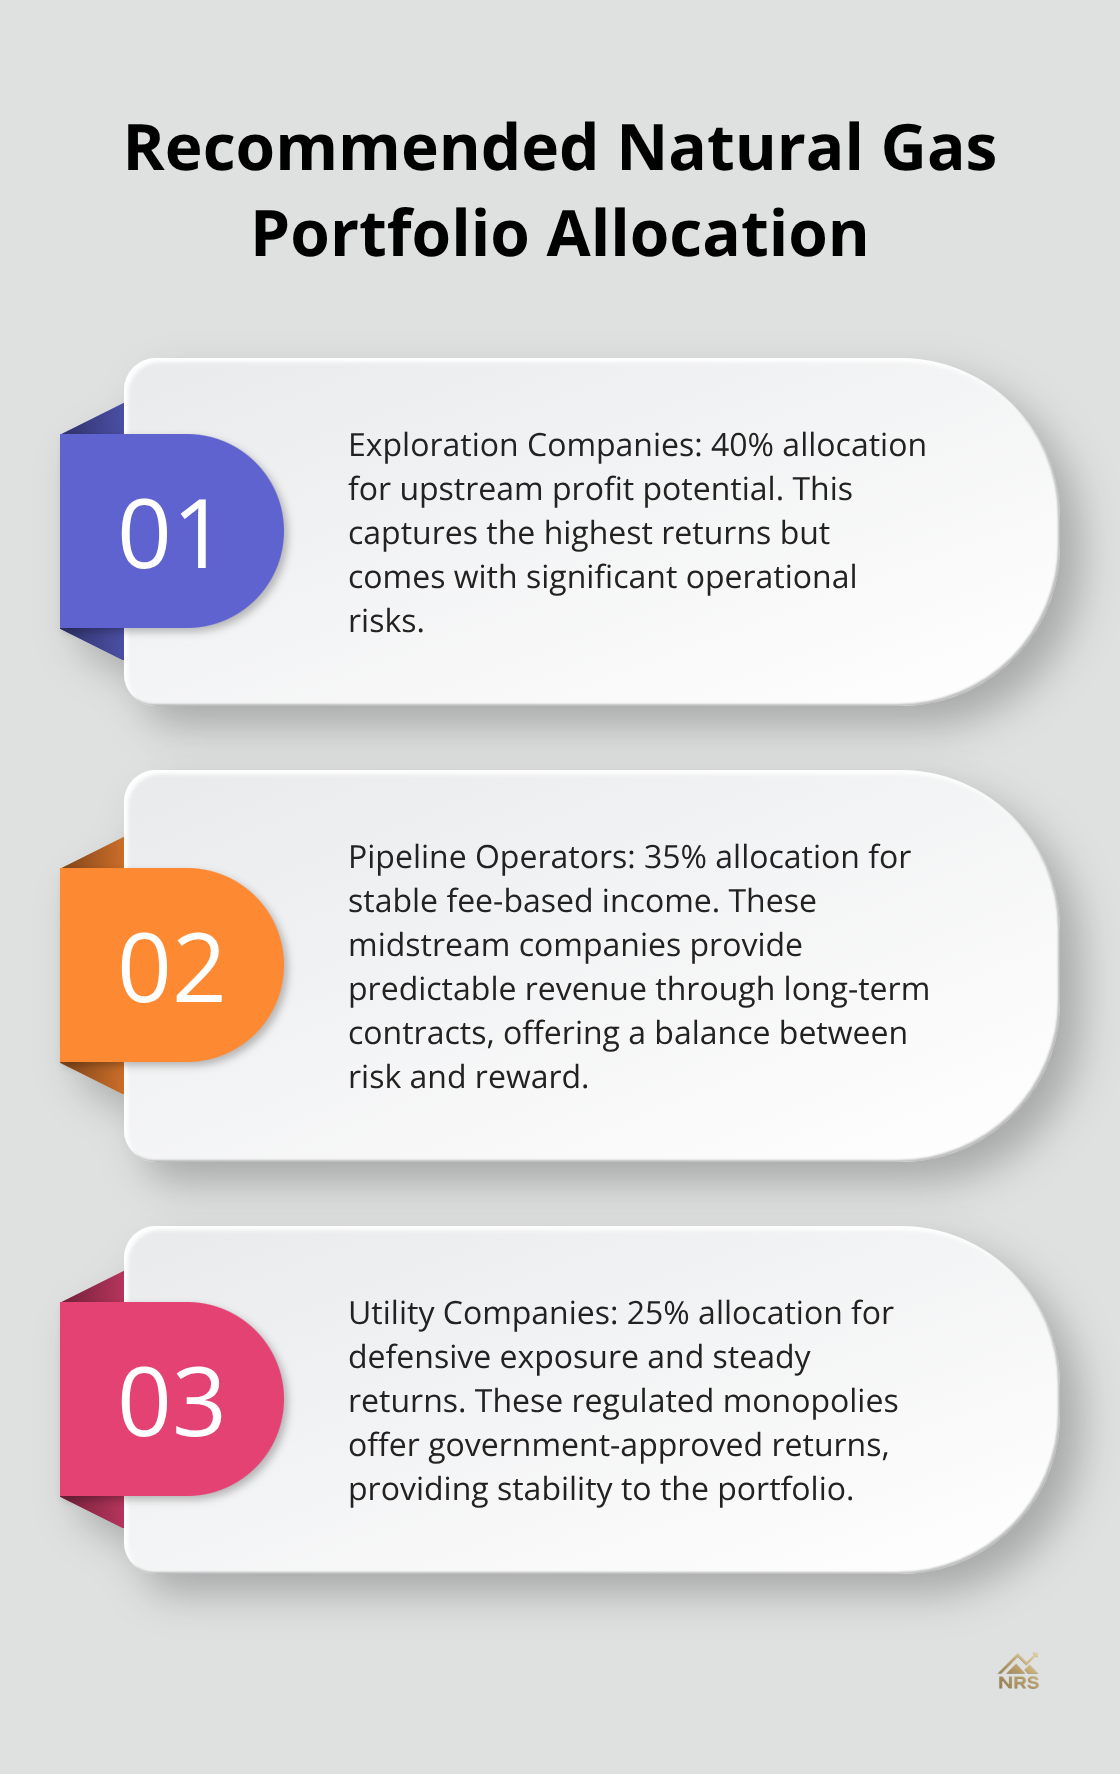
Spread Risk Across Production, Transport, and Distribution
Allocate 40% to exploration companies, 35% to pipeline operators, and 25% to utilities for balanced natural gas exposure. This allocation captures upstream profit potential while it protects against commodity price crashes through fee-based midstream income. Antero Resources generated 47% returns in 2022 when gas prices spiked, while Kinder Morgan delivered steady 6% gains through pipeline fees. Utilities like Atmos Energy provided 8% annual returns during the same volatile period. Never concentrate more than 15% in any single company – natural gas bankruptcies like Chesapeake Energy in 2020 can wipe out concentrated positions overnight.
Target Winter Entries and Summer Exits for Maximum Gains
Smart investors buy natural gas stocks between August and October when prices hit seasonal lows, then sell positions in February through April during peak demand. This pattern generated 23% average returns from 2018-2023 according to S&P Global data. EQT Corporation shares show seasonal volatility patterns influenced by market conditions and expected inflation factors. Weather forecasts from the National Oceanic and Atmospheric Administration provide 30-day advance signals – La Niña patterns affect natural gas consumption patterns for both residential and commercial users. Storage data releases every Thursday at 10:30 AM Eastern create weekly opportunities when inventories deviate from five-year averages.
Limit Individual Positions to 8% Maximum Allocation
Position limits prevent catastrophic losses from operational accidents, regulatory setbacks, or reserve writedowns that plague natural gas companies. The Colonial Pipeline cyberattack in 2021 crashed related energy stocks 15-20% within days, while successful companies limited investor damage through proper diversification. Set stop losses at 12% below entry prices and take partial profits when positions gain 25% or more. Rebalance quarterly to maintain target allocations as gas price volatility creates dramatic performance differences between upstream producers and stable utility operators.
Monitor Storage Levels and Weather Patterns
Weekly storage reports from the Energy Information Administration reveal supply tightness when inventories fall below 3.2 trillion cubic feet (the five-year average low). Cold weather forecasts 30-45 days ahead signal price spikes that benefit exploration stocks most. Hurricane season from June through November disrupts Gulf Coast production and creates short-term opportunities in Appalachian producers like Range Resources and Southwestern Energy. Consider geopolitical risk management strategies when international tensions affect global energy markets.
Final Thoughts
Natural gas stocks present significant opportunities across exploration, pipeline, and utility sectors. We at Natural Resource Stocks recommend balanced allocation with 40% exploration companies, 35% pipeline operators, and 25% utilities to capture upside potential while you manage volatility risks. Companies with breakeven costs below $3.50 per Mcf offer better protection when prices decline.
Pipeline operators provide stable fee-based income through long-term contracts, while utilities deliver defensive exposure through regulated returns (typically 9% to 11% annually). Risk management remains paramount given natural gas price volatility and operational hazards. You should limit individual positions to 8% maximum allocation and maintain stop losses at 12% below entry prices.
Weather patterns and storage data provide timing signals for optimal entry and exit points when you learn how to invest in natural gas stocks. Success depends on diversification across the value chain and disciplined position sizes. Natural Resource Stocks provides expert analysis and market insights to help investors navigate energy sector opportunities and build stronger portfolios.