


Silver’s price trajectory to 2050 depends on forces we can measure and analyze today. Industrial demand from solar panels and electronics will reshape the market, while geopolitical instability threatens supply chains that investors rely on.
At Natural Resource Stocks, we’ve examined historical patterns, current demand drivers, and expert forecasts to build a realistic silver price forecast for 2050. This analysis shows you which scenarios matter most for your portfolio.
What Shaped Silver Prices Over the Past 50 Years
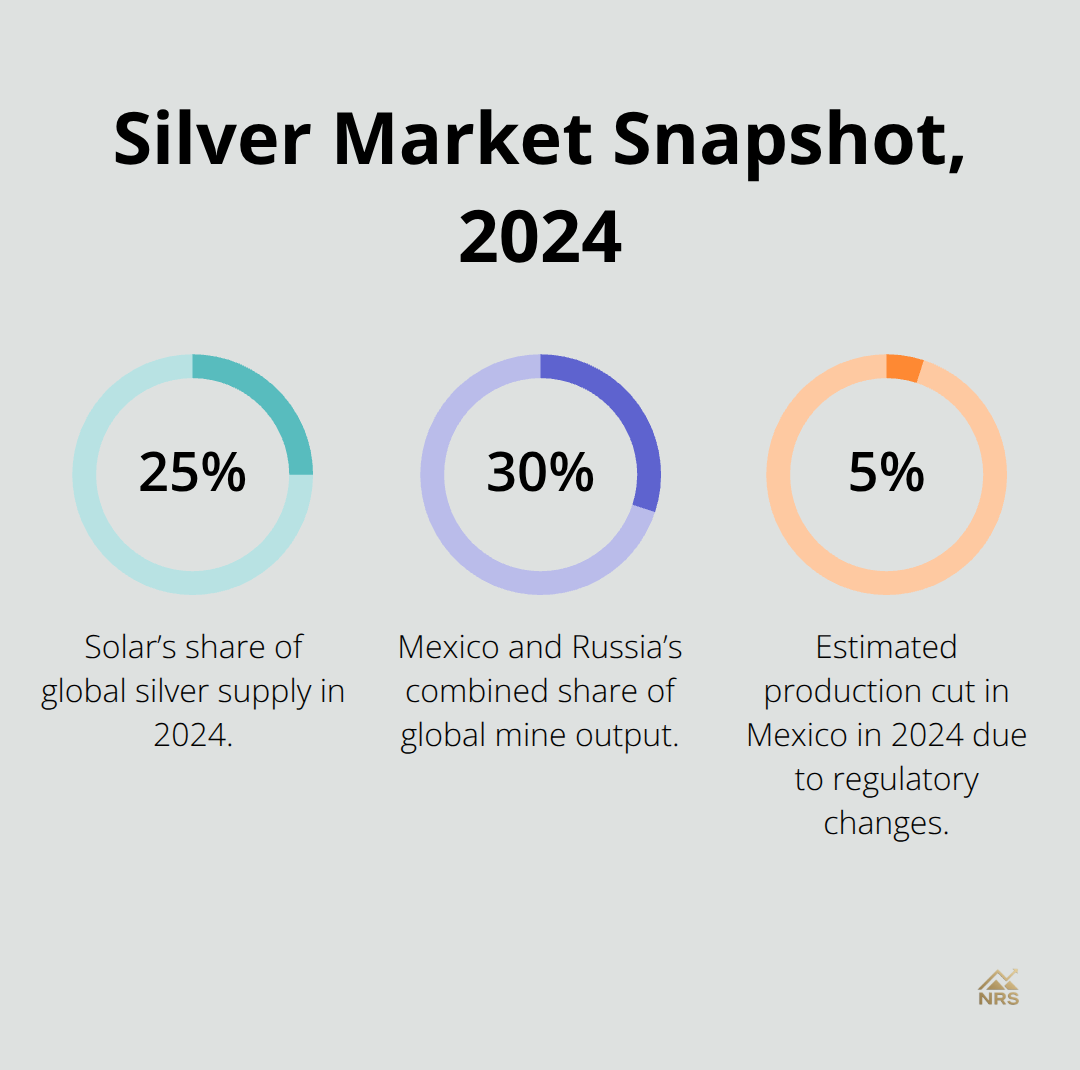
Silver’s real price swung wildly across the past five decades, moving from $1.80 per ounce in 1969 to $20.98 in 1980, then collapsing to $4.83 by 1990 according to historical data tracked on Macrotrends. That 1980 spike wasn’t driven by industrial demand-it came from the Hunt brothers’ attempt to corner the market, which ended in a spectacular margin-call crash that wiped out speculators and taught the market a hard lesson about leverage. The 2008 financial crisis pushed silver to $14.99 as investors fled risk, while the post-2008 recovery saw prices climb to $20.19 by 2010 and $20.69 by 2020. What matters for your 2050 forecast is recognizing that silver moves on two separate tracks: monetary shocks (like currency crises or rate changes) that drive safe-haven demand, and structural industrial demand that builds slowly but relentlessly. The real price history shows silver spent most of the 1990s and early 2000s in a $4–$5 range, starved of both investment interest and industrial momentum. Then 2008 changed the equation. From 2010 onward, industrial applications accelerated as solar panel manufacturing ramped up globally, and solar consumed over 25 percent of global silver supply in 2024. That shift matters enormously for 2050 because it signals a permanent structural change, not a temporary cycle.
The Structural Shift Toward Industrial Demand
The critical turning point arrived around 2010–2012 when solar photovoltaic installation began its exponential climb. Before that, silver was primarily a safe-haven asset and jewelry metal, vulnerable to interest-rate shocks and currency movements. Today, industrial demand accounts for more than half of total silver consumption, and solar alone is projected to nearly double its silver offtake from 2020 to 2030 according to Silver Institute forecasts. This matters because it decouples silver from pure monetary cycles. When the Federal Reserve raises rates, gold often sells off sharply, but silver now has a floor built from manufacturing demand. Conversely, geopolitical shocks that used to trigger short-term rallies now risk disrupting supply chains-Mexico and Russia together account for roughly 30 percent of global mine output, and Mexico’s recent regulatory changes reduced production by about 5 percent in 2024. The 2025 surge to around $64 per ounce wasn’t primarily driven by monetary easing; it came from a fifth consecutive year of supply deficits and inventory drawdowns, combined with accelerating industrial demand from solar, electric vehicles, and AI data centers. That’s the opposite of the 1980 Hunt brothers blow-up, where leverage and speculation drove the spike. Today’s rally is grounded in physical scarcity and rising consumption, which changes how you should think about the 2050 price path.
What the Data Shows About Future Tightness
Macrotrends provides 100 years of inflation-adjusted silver price history that you can download and analyze yourself. Using that dataset alongside the U.S. Bureau of Labor Statistics CPI data, you can stress-test forecasts across multiple inflation regimes and economic cycles. The real-price history shows silver traded above $30 per ounce in only a handful of years-1980 (the Hunt spike), 2010–2012 (post-crisis recovery), and 2020–2021 (pandemic stimulus). Holding that level consistently would be unprecedented in modern history. Yet cumulative solar demand could equal 85–98 percent of today’s known silver reserves by 2050, suggesting a structural supply gap that no historical precedent covers. This isn’t theoretical-global mine supply hovered around 1.03 billion ounces in 2024, while demand exceeded supply by roughly 160–200 million ounces in 2025. That deficit is real, tracked in COMEX and LBMA inventory draws. The data reveals a fundamental mismatch between future industrial demand and available supply that historical price patterns cannot capture.
Why Historical Patterns Fail for 2050
Price forecasts built on the past 50 years will underestimate upside because the underlying demand structure is fundamentally different from what came before. Silver spent decades as a monetary asset first and an industrial metal second. That hierarchy has reversed. Solar, electric vehicles, and advanced electronics now drive the market, and these applications won’t disappear when interest rates rise or the dollar strengthens. The 2025 rally to $64 per ounce proves this point-it occurred despite expectations for rate cuts and a softer dollar, driven instead by physical scarcity and industrial momentum. When you compare this to the 1980 Hunt brothers episode or the 2008 financial crisis, the price drivers are entirely different. Those events were about speculation and monetary shock. Today’s market reflects a structural supply deficit that will persist and likely widen through 2050. This distinction matters enormously for how you should approach forecasting and portfolio positioning, because it means the next chapter’s analysis of expert projections and price scenarios must account for demand patterns that have no historical equivalent.
What Will Actually Drive Silver Prices to 2050
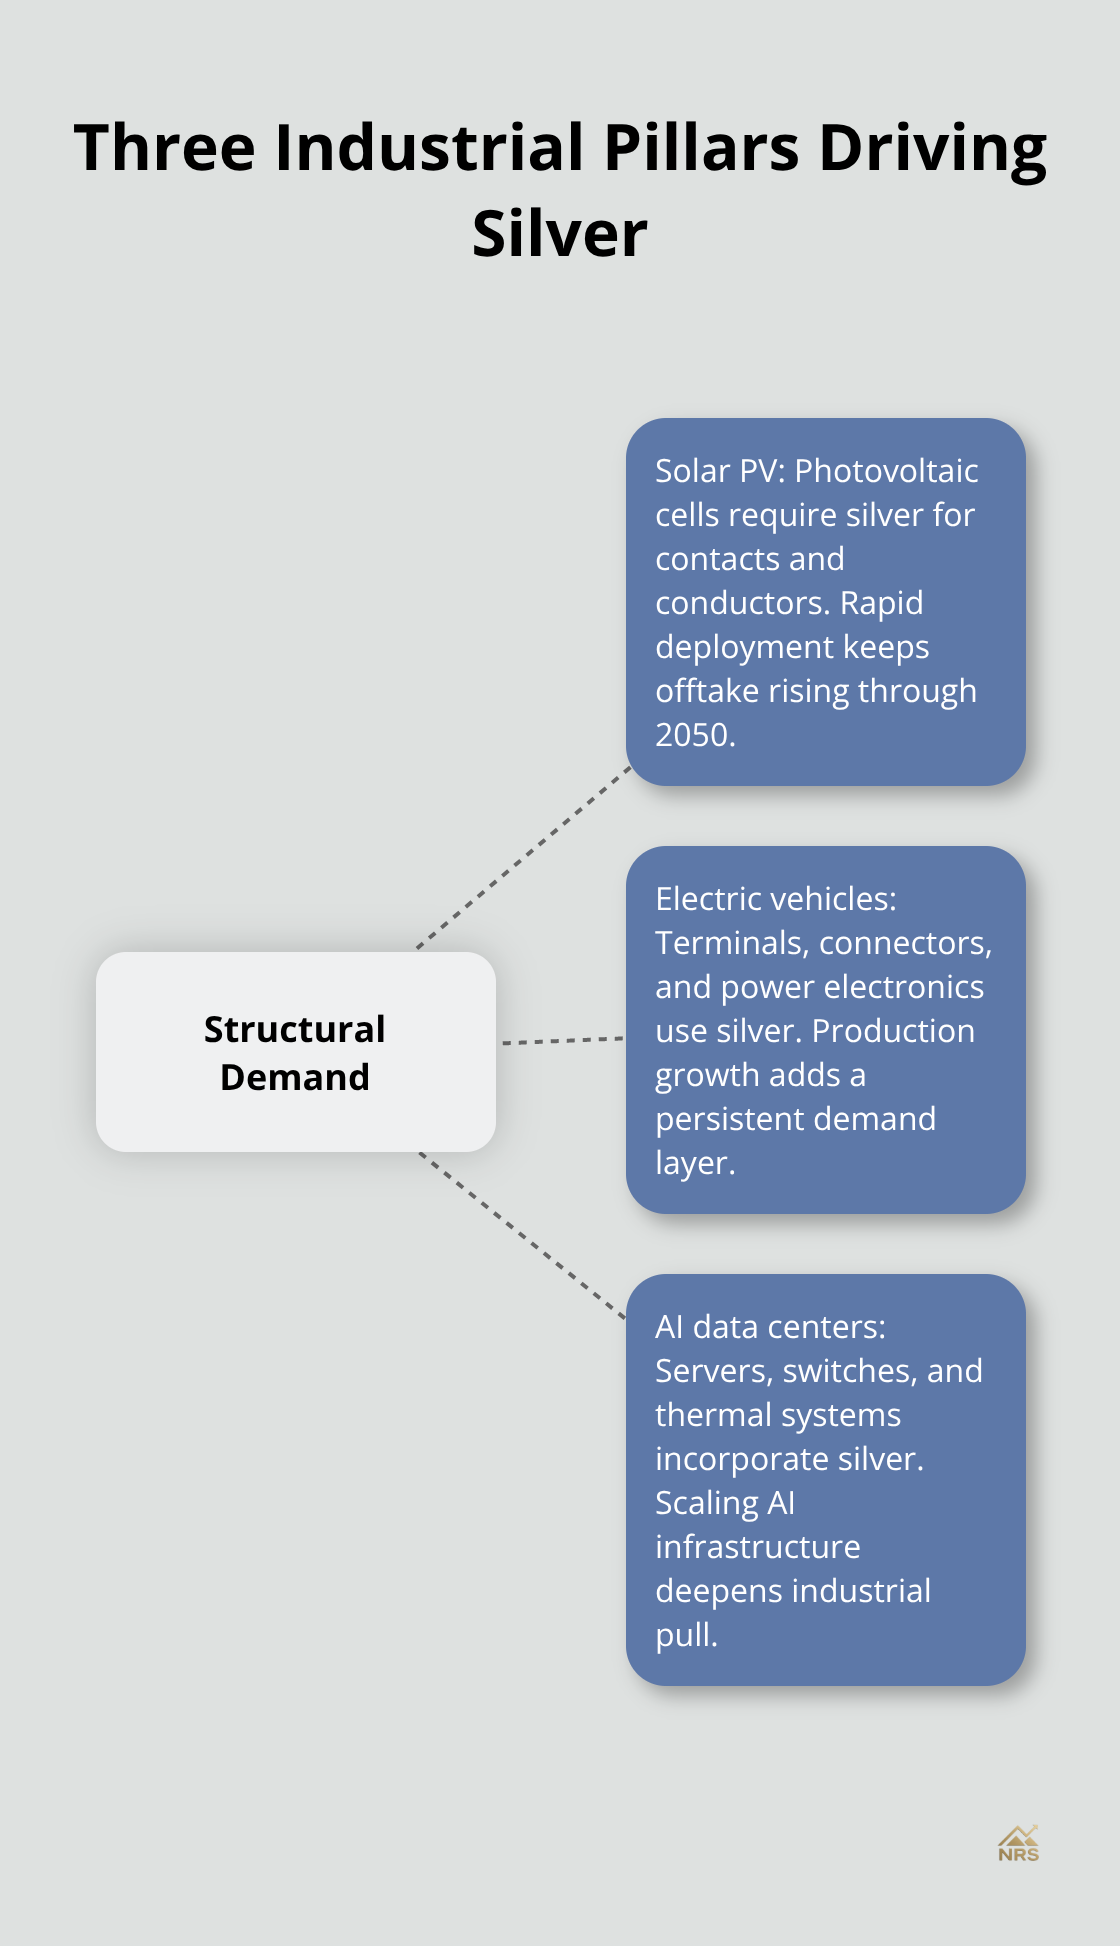
Solar panel manufacturing reshapes silver’s price trajectory, and the numbers leave no room for debate. Solar consumed over 25 percent of global silver supply in 2024, and that share accelerates. The International Renewable Energy Agency projects solar installations will expand dramatically through 2050, which means silver offtake from photovoltaic cells alone could consume 85 to 98 percent of today’s known silver reserves by mid-century. This isn’t speculation-it’s a mathematical consequence of current deployment rates and panel efficiency requirements. Each solar panel requires silver for electrical contacts and conductors, and no cheap substitute matches silver’s conductivity and reliability at scale.
Three Industrial Pillars Lock in Structural Demand
Electric vehicle production adds another 20 percent annual growth layer on top of solar demand, with EV battery terminals, connectors, and electronic components all requiring silver. AI data centers form the third industrial pillar, consuming silver in server components, switches, and thermal management systems. Together, these three applications create structural demand that persists regardless of interest rates or currency movements. When the Federal Reserve cut rates in 2024 and the dollar weakened, silver rallied to $64 per ounce not because investors chased yield, but because manufacturers knew they needed physical silver and inventories were tightening. That contrasts sharply with the 1980 Hunt brothers speculation or the 2008 financial crisis panic buying. This demand is locked in by industrial production schedules and engineering specifications that manufacturers cannot ignore.
Supply Cannot Keep Pace With Industrial Consumption
Global mine supply stalled around 1.03 billion ounces in 2024, while demand exceeded supply by 160 to 200 million ounces in 2025 according to Silver Institute data. That deficit is real and tracked in COMEX and LBMA inventory draws, not theoretical. Mexico and Russia together produce roughly 30 percent of global silver, and Mexico’s recent regulatory changes cut output by about 5 percent in 2024. Russia faces ongoing sanctions that constrain exports and refining capacity. Major mines like Cannington in Australia and Antamina in Peru are aging, with few large replacement projects ready to offset their eventual decline.
Mine supply is inelastic in the short term-you cannot simply drill more holes and produce more silver overnight. New mines take 7 to 10 years from discovery to production, and capital requirements have soared as ore grades decline. The readily accessible silver stockpiles and scrap reserves that existed at lower prices have been exhausted. When prices were $5 per ounce, recycling made no sense. At $64 per ounce, scrap recovery accelerates, but scrap supply is finite and cannot replace depleting ore reserves. COMEX and LBMA vaults have drawn down continuously through 2024 and 2025, signaling physical tightness in the market. This supply constraint is the structural floor under silver prices through 2050.
Investment Demand Amplifies Industrial Scarcity
Investment demand shifted decisively in 2025 after years of ETF outflows. Positive inflows returned as prices cleared key psychological levels around $30 and then $50 per ounce, with retail buyers re-entering the market. Futures volumes surged during geopolitical shocks and Federal Reserve uncertainty, indicating that institutional investors now view silver as a hedge against currency debasement and inflation. Central banks are increasingly considering silver alongside gold as a strategic reserve asset, diversifying beyond traditional gold holdings.
This dynamic matters because investment demand acts as a multiplier on top of industrial consumption. When a solar manufacturer purchases silver for production, that represents one ounce consumed. When an investor purchases silver bullion or ETF shares as an inflation hedge, that represents another ounce removed from available supply. At current deficit rates of 160 to 200 million ounces annually, even modest increases in investment demand can trigger sharp price spikes. The 2025 rally to $64 per ounce proves this dynamic-industrial demand provided the foundation, but investment inflows accelerated the move higher. If central banks formally announce silver reserve programs or if inflation expectations spike, investment demand could easily double or triple, overwhelming the already-tight supply picture and pushing prices well above current forecasts.
These three forces-industrial demand locked in by manufacturing schedules, supply constrained by mine inelasticity, and investment demand amplifying scarcity-create the foundation for understanding expert price projections. The next chapter examines what major institutions and analysts actually forecast for 2050 and which scenarios carry the highest probability.
What Expert Forecasts Actually Tell You About 2050
Three Competing Price Scenarios Shape Your Portfolio Decisions
Institutional forecasts for 2050 cluster around three distinct price ranges, and the gap between them reveals which assumptions matter most for your portfolio decisions. JPMorgan projects $58 per ounce, Saxo Bank targets $60–$70, and Citigroup forecasts $60–$72 according to their 2026 outlooks. These aren’t wild guesses-they’re built on specific assumptions about solar deployment rates, industrial demand growth, and supply tightness. The World Bank takes a more conservative stance at $41 per ounce, while outlier forecasters like InvestingHaven and Robert Kiyosaki project triple digits, with Kiyosaki arguing for $100–$200 per ounce by 2026 and InvestingHaven approaching $75 by 2027.
The difference between a $41 forecast and a $200 forecast hinges entirely on how aggressively you model solar demand growth and whether you assume central banks enter the market as buyers. If solar offtake grows at historical rates and investment demand remains muted, the World Bank scenario plays out. If solar deployment accelerates due to energy security concerns and central banks formally add silver to strategic reserves, the triple-digit scenarios become realistic.
Why Historical Price Patterns Fail for 2050 Forecasting
Technical analysis alone cannot resolve this uncertainty because 2050 sits outside any meaningful chart pattern. The 100-year real-price history available on Macrotrends shows silver traded above $30 per ounce in only scattered years, yet current structural deficits suggest that price level becomes the floor, not the ceiling. This tells you that historical price ranges are useless for 2050 forecasting-you must instead build scenario analysis around industrial demand variables, not past price behavior.
Silver has traded above $30 per ounce in only a handful of years across the past century, making historical comparisons misleading. The 1980 Hunt brothers spike, the 2010–2012 post-crisis recovery, and the 2020–2021 pandemic stimulus all pushed prices above $30, but none of those episodes reflected structural supply deficits. Today’s market operates under fundamentally different conditions. Current structural deficits suggest that $30 per ounce becomes the floor, not the ceiling, which means historical price ranges cannot anchor your 2050 forecast.
Macroeconomic Models Reveal the Real Price Driver
Macroeconomic models that account for inflation and real yields provide sharper insights than technical patterns. If inflation averages 2.5 percent annually through 2050 and silver prices rise 4 percent per year in nominal terms, the real price barely moves. If inflation averages 4 percent and silver prices rise 6 percent annually, real purchasing power compounds meaningfully over 25 years. The critical variable is whether silver prices rise faster than inflation-a true supply-driven bull market-or merely keep pace with currency debasement.
The 2025 surge to $64 per ounce occurred with inflation expectations actually declining and the dollar weakening, which means the rally was driven by physical scarcity, not inflation hedging. This distinction matters enormously because it suggests upside to $100+ per ounce is possible even in a low-inflation environment if supply deficits persist. Consensus forecasts anchor to recent history and systematically underestimate structural shifts, as demonstrated when Reuters polled analysts in 2024 and found consensus around $24.85 per ounce-a forecast that proved wildly pessimistic within months as prices nearly tripled.
Build Three Scenarios to Test Your Assumptions
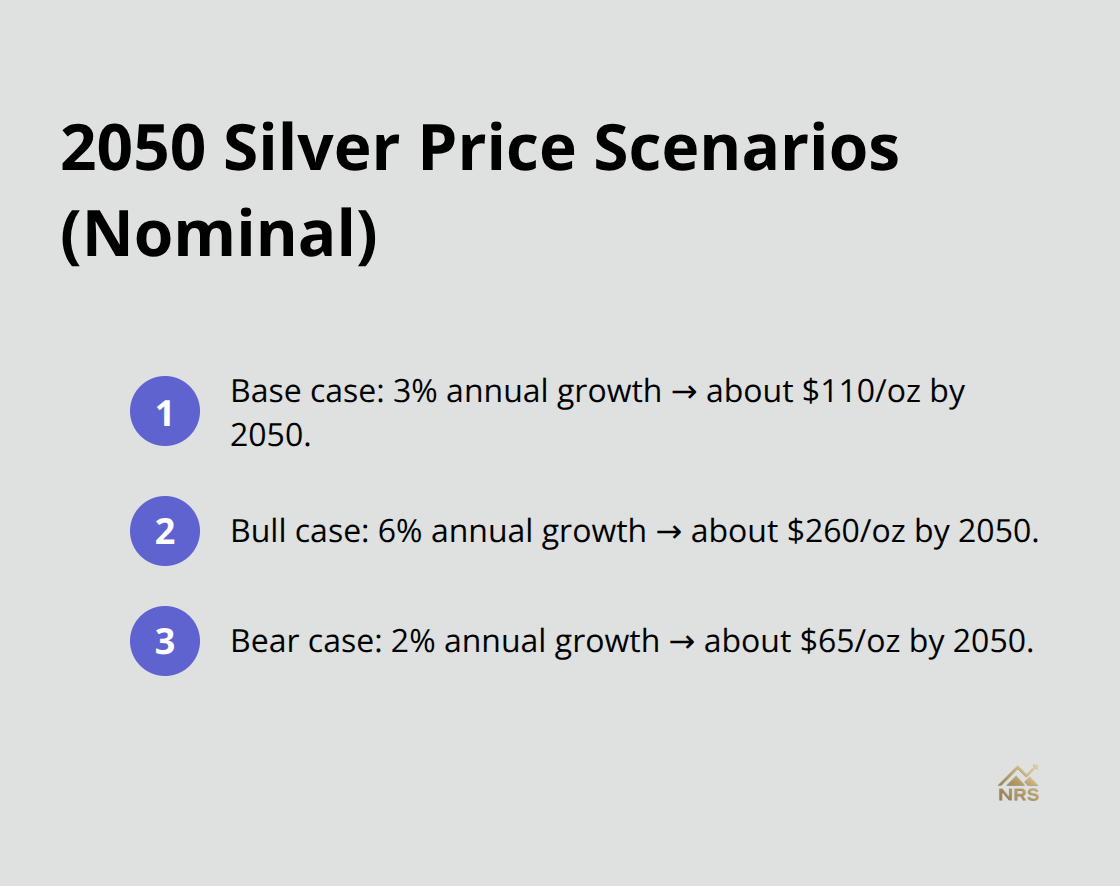
For 2050, you should weight scenarios that assume accelerating solar demand and tightening inventories far more heavily than consensus estimates that assume supply catches up. The most actionable approach is to build three scenarios-a base case assuming 3 percent annual silver price growth, a bull case assuming 6 percent growth driven by industrial demand acceleration, and a bear case assuming 2 percent growth if substitutes emerge for solar applications.
Run those scenarios through 25 years of compounding and you’ll see why the range between $41 and $200 per ounce exists. The bull case scenario, where solar demand nearly doubles through 2030 and investment demand adds another multiplier, produces the highest probability outcome given current inventory draws and mine supply constraints. A base case scenario with 3 percent annual growth compounds to roughly $110 per ounce by 2050 in nominal terms. The bull case with 6 percent annual growth reaches approximately $260 per ounce. The bear case with 2 percent annual growth settles around $65 per ounce. These calculations show you that small differences in annual growth rates produce vastly different outcomes over 25 years, which is why identifying the correct demand assumptions matters far more than predicting short-term price swings.
Conclusion
Silver’s price trajectory through 2050 rests on three immovable pillars: industrial demand locked in by solar manufacturing and electronics production, supply constrained by aging mines and inelastic production timelines, and investment demand amplifying scarcity as central banks diversify reserves. These forces operate independently of interest rates or currency movements, which means the structural deficit driving prices higher today will persist and likely intensify. Solar alone will consume 85 to 98 percent of today’s known silver reserves by mid-century, creating a supply gap with no historical precedent for your silver price forecast 2050.
Conservative forecasts around $41 per ounce assume supply catches up with demand, which contradicts current inventory draws and mine supply constraints. Moderate scenarios projecting $60 to $70 per ounce assume solar deployment continues at historical rates while investment demand remains modest. Aggressive scenarios reaching $100 to $200 per ounce assume solar acceleration and formal central bank silver reserve programs, with the bull case carrying the highest probability given current structural deficits.
Position your portfolio by recognizing that silver now functions as both an industrial commodity and a monetary hedge, which creates dual upside. The 2025 surge to $64 per ounce proved this dynamic works even in low-inflation environments when physical scarcity dominates. We at Natural Resource Stocks track macroeconomic factors and geopolitical impacts that reshape resource prices, providing the analysis you need to navigate these scenarios.