


Silver prices are moving in unpredictable ways right now, shaped by industrial demand, geopolitical shifts, and currency swings. At Natural Resource Stocks, we’re breaking down what these forces mean for your iShares Silver Trust forecast and investment decisions.
This guide covers the real performance data, the key factors driving silver in 2025, and practical strategies for positioning yourself in this market.
Where SLV Stands Right Now
Recent Price Action and Liquidity Advantage
SLV closed at $66.01 on December 29, 2025, down 7.19% for the day, but this single-day drop masks a much stronger two-week surge of 17.63%. The fund trades with roughly 150 million shares daily-about $9.93 billion in value-making it far more liquid than its main competitor, IAU (iShares Gold Trust), which moves around 16 million shares on a typical day. This liquidity gap matters for traders who need to move positions quickly without moving the price.
Performance Comparison and Volatility Reality
Over the past year, SLV delivered a 98.94% total return, crushing gold’s 60.2% performance, though silver’s volatility cuts both ways. The 52-week range of $26.22 to $71.23 tells the real story: SLV swings hard. A $1,000 investment five years ago grew to roughly $2,532 in SLV versus $2,322 in IAU, but SLV experienced a maximum drawdown of 38.79% compared to gold’s 21.88%, meaning silver investors endured far sharper losses during downturns. The expense ratio of 0.50% sits higher than IAU’s 0.25%, so long-term holders pay an extra 25 basis points annually.
The Premium Valuation Trap
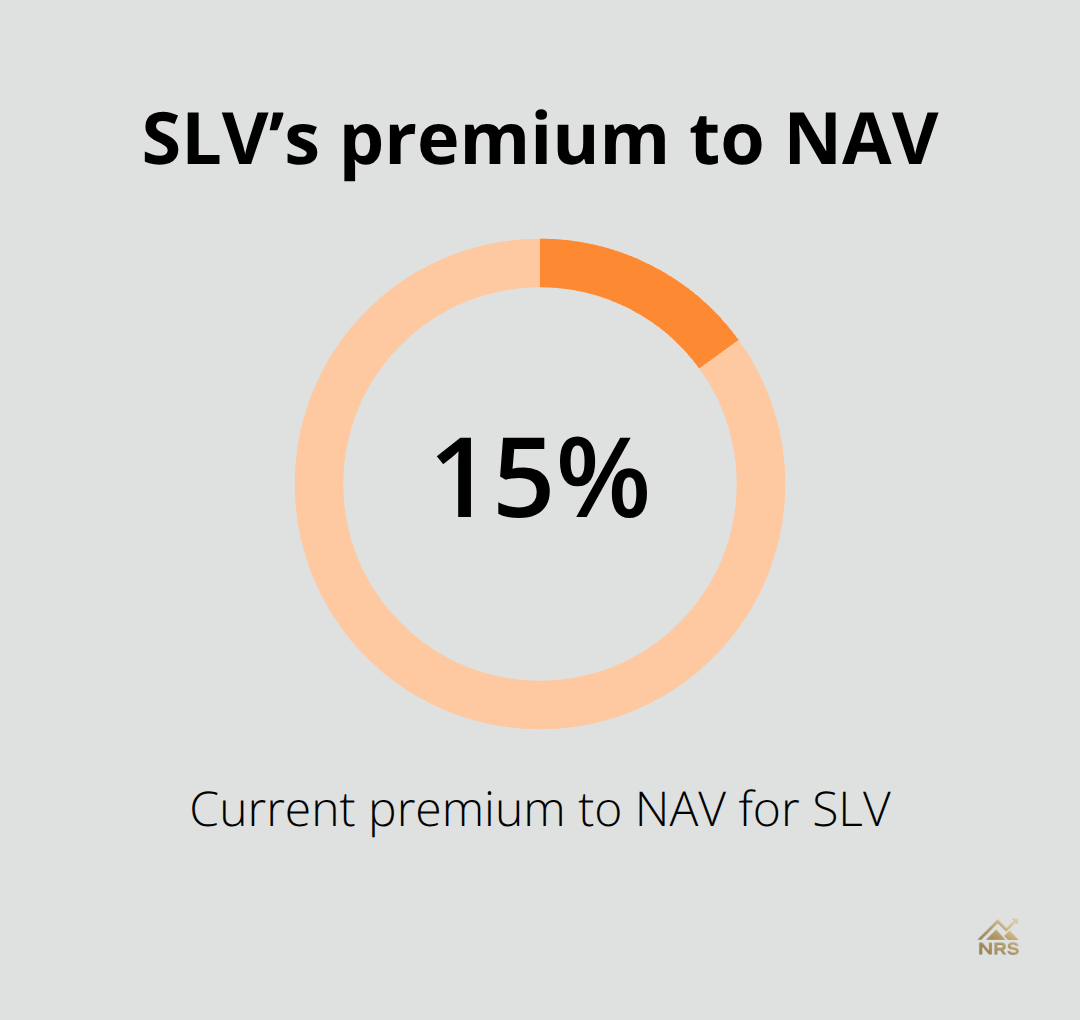
One critical detail separates SLV from the underlying silver value: the iShares Silver Trust trades at a premium to its net asset value. The fund’s NAV sits around $58.50, yet the market price hovers near $67.56, representing roughly a 15% premium. This gap exists because investors will pay extra for liquidity and convenience, but it also means you overpay relative to the underlying silver value. If that premium contracts, you lose money even if silver prices hold steady.
Technical Signals and Support Levels
Technical indicators send mixed signals heading into 2026. The STOCHRSI reads 100 and the STOCH(9,6) sits at 91.98, both flashing sell warnings that suggest short-term exhaustion. However, all five major moving averages (10, 20, 50, 100, and 200-day) display buy signals, with the 10-day average at 62.60 sitting well above the 200-day at 38.17. The MACD and ADX(14) at 45.69 also point upward, indicating a strong directional trend. Overall, 12 of 17 technical indicators favor buying. Support levels sit around $64.27 and $64.84, with resistance near $71.12.
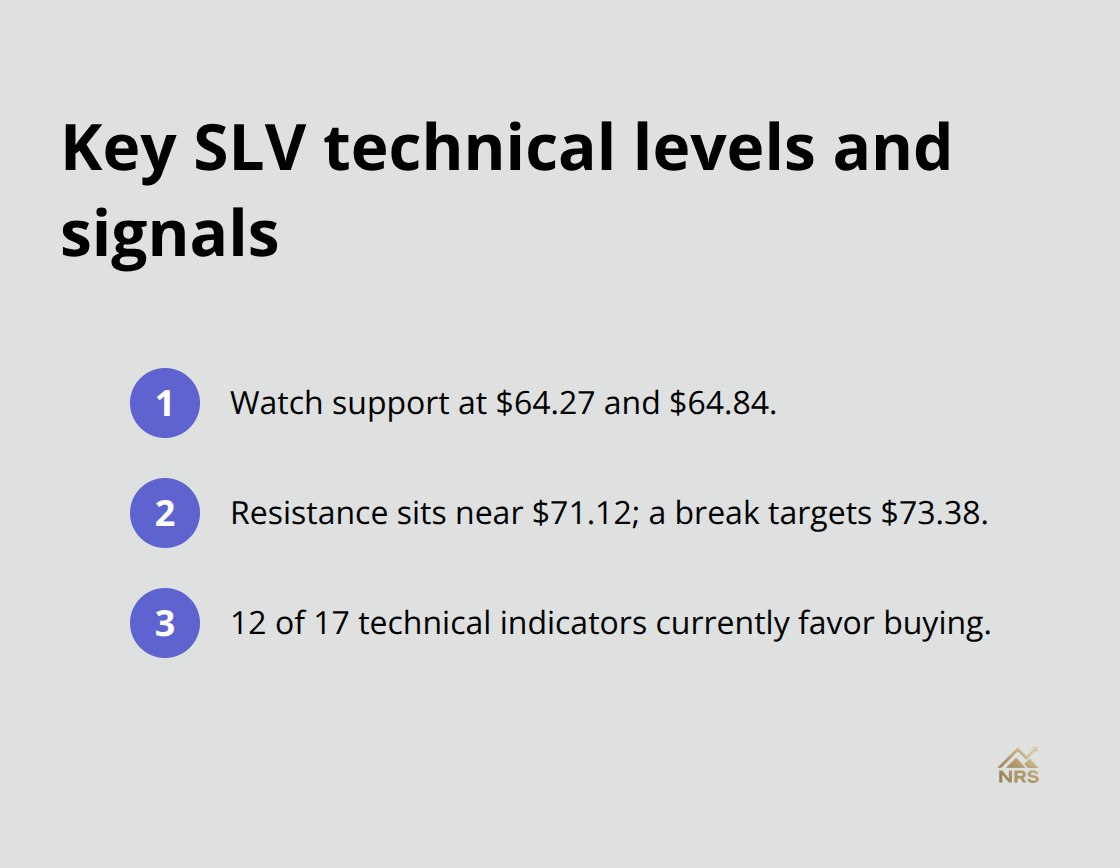
If SLV breaks above $71.12, the next target reaches $73.38. A breakdown below $64.27 would trigger meaningful sell signals and could accelerate losses.
Supply Constraints Meet Rising Demand
The silver market’s fundamentals remain tight. The Silver Institute provides leading research on silver supply and demand. Demand from solar photovoltaic manufacturing and green technologies continues climbing, while jewelry consumption in emerging markets adds another bullish layer. Against this backdrop, SLV’s premium valuation and overbought short-term conditions create a tension: the long-term setup looks constructive, but near-term pullback risk is real. Position sizing matters more than conviction here-which is why understanding what analysts actually predict for SLV becomes essential before you commit capital.
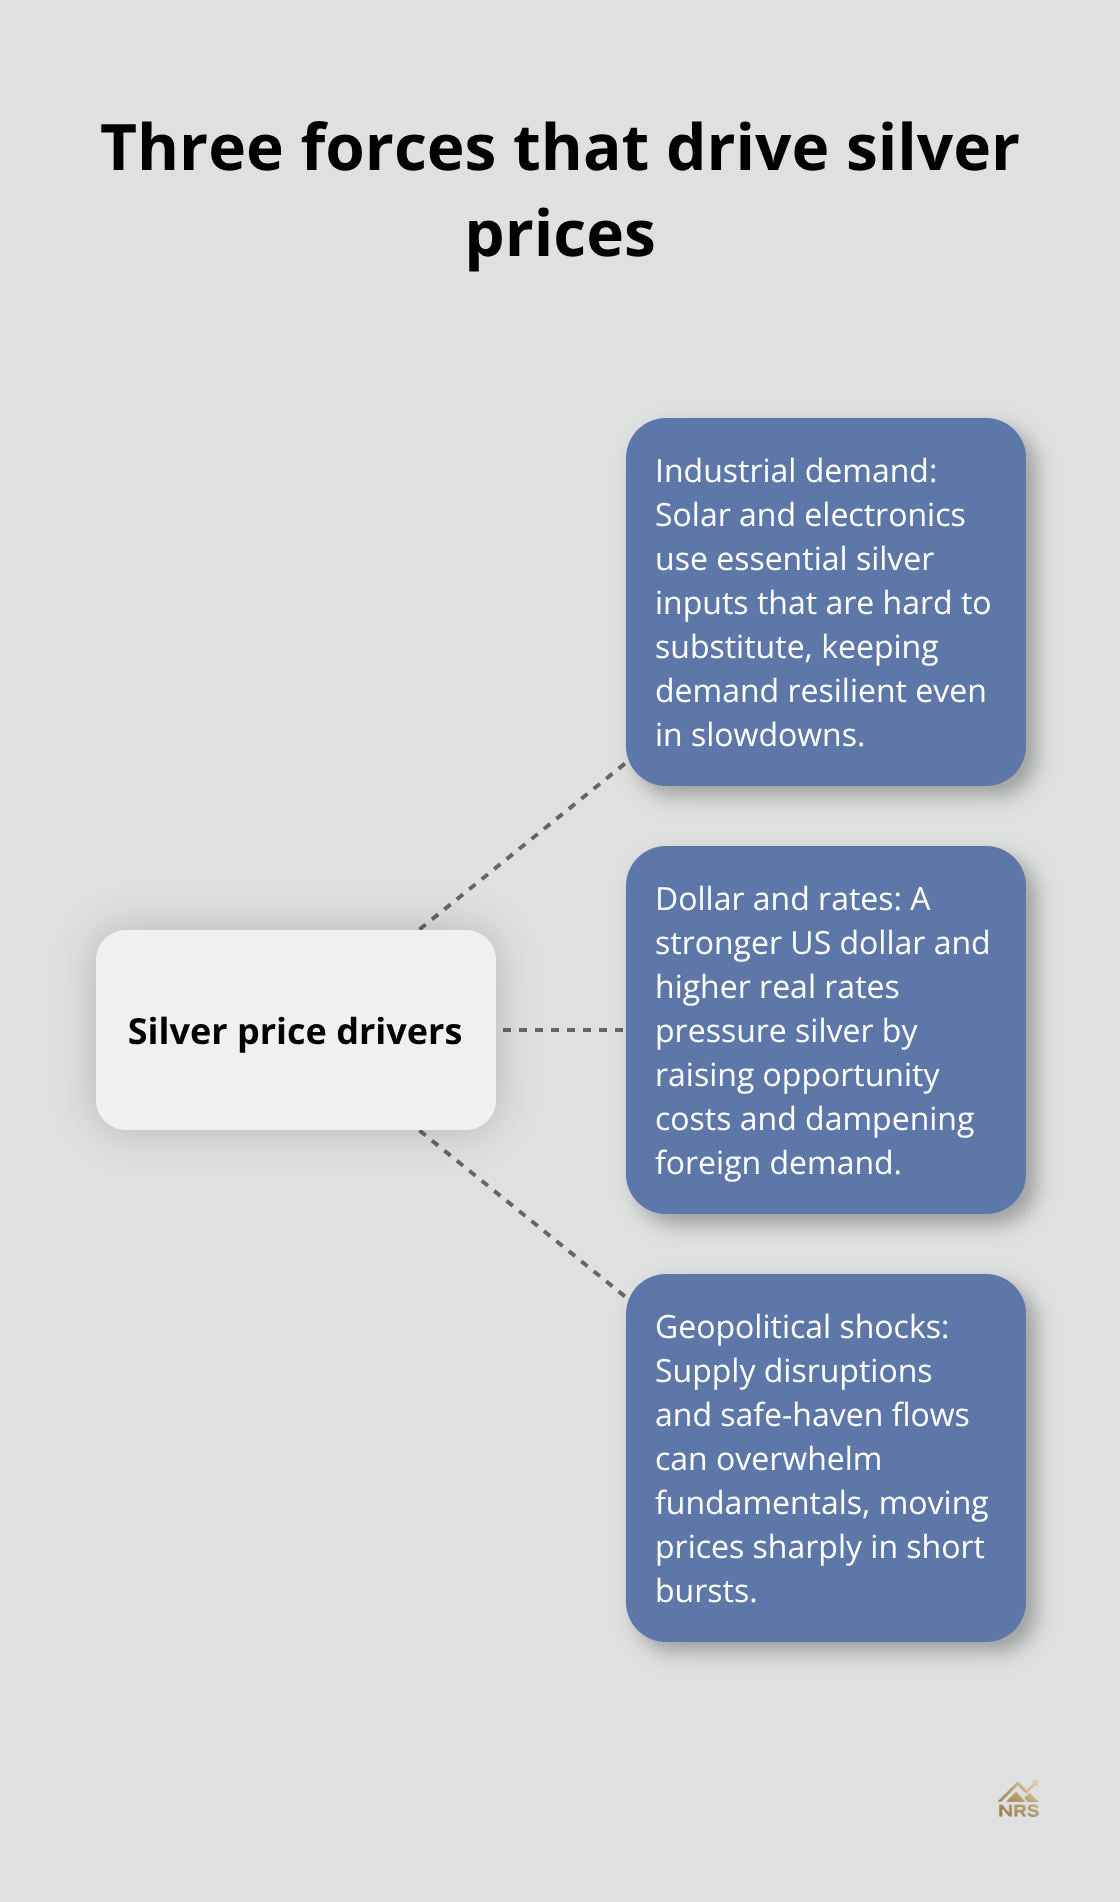
What Drives Silver Prices in 2025
Industrial Demand Powers the Market
Solar panel manufacturers and electronics producers consume roughly 55% of annual silver demand, making industrial usage the primary price driver in 2025. When solar installations accelerate due to energy transition policies, silver prices respond directly and measurably. A surge in photovoltaic deployment across Europe, the US, and Asia creates genuine supply pressure because industrial applications remain essential. Electronics manufacturers use silver in circuit boards, switches, and conductive adhesives where substitutes exist but perform worse. This means industrial demand rarely disappears entirely, even during economic slowdowns.
Currency and Interest Rate Headwinds
The US dollar strength presents the opposite force: a stronger dollar makes silver more expensive for foreign buyers, directly suppressing prices. When the dollar strengthens, international investors hesitate to buy silver-denominated contracts, reducing overall demand. Interest rate movements amplify this effect because higher rates increase the opportunity cost of holding non-yielding assets like silver. A 0.5% increase in real interest rates typically correlates with 3-5% downward pressure on silver prices within weeks, according to historical patterns. Central bank policy decisions ripple through silver markets faster than most investors expect. When the Federal Reserve signals rate cuts ahead, silver tends to rally within days as investors rotate away from cash positions into hard assets.
Geopolitical Shocks Override Fundamentals
Geopolitical tensions act as a wildcard that can override fundamental supply-demand calculations entirely. Mining disruptions in Mexico, Peru, or Russia create immediate supply shocks that push prices higher regardless of dollar strength or interest rates. When labor strikes shut down major silver mines, spot prices can jump 2-3% in a single session. Safe-haven demand intensifies during periods of political instability, rising sovereign debt concerns, or banking sector stress. Investors fleeing currency devaluation or capital controls historically accumulate silver as a tangible asset that governments cannot freeze or confiscate. This flight-to-safety dynamic happened repeatedly during the 2020 pandemic crash and the 2022 banking turmoil, with silver rallying sharply as equities fell.
Timing Shocks and Controlling What You Can
The challenge for SLV investors lies in timing these geopolitical shocks, which remain inherently unpredictable. What you can control is monitoring supply-side announcements from major mining regions and tracking central bank communications about future rate directions. Set price alerts at key resistance levels like the $71.12 mark mentioned earlier, and watch for dollar weakness signals before committing fresh capital. The interaction between industrial demand growth, dollar movements, and geopolitical surprises creates the volatility that generates both SLV’s 98.94% annual returns and its 38.79% maximum drawdown. Understanding these three forces helps you anticipate which direction silver moves next, but predicting the exact timing requires staying alert to real-time developments across multiple fronts. As analyst predictions and price targets emerge for 2026, the question shifts from what moves silver to where SLV actually heads in the months ahead.
Where SLV Heads in 2026 and Beyond
The Forecast Disconnect: Near-Term Pain Versus Long-Term Gains
Analysts project SLV will average $37.27 in 2026, implying a 43.54% decline from the December 29 price of $66.01, with targets ranging from $33.45 to $41.09. These projections reflect expectations of a significant pullback before any sustained recovery takes hold. The 30-day forecast is even more severe, averaging $35.21 with a 46.65% downside, though compressed timeframes rarely materialize exactly as modeled. What matters more than the precise 2026 figure is the trajectory: analysts see prices bottoming in the 2026-2029 window before climbing steadily through 2030-2050, with 2050 targets averaging $97.25. This long-term bullish view rests on supply tightness from exhausted stockpiles and scrap combined with accelerating solar and green technology demand.
The gap between near-term pain and long-term gain creates a critical timing problem for SLV investors. If you buy at $66 expecting a recovery, you will likely watch the position lose 40-45% before any upside emerges, assuming the forecast holds. Position sizing becomes non-negotiable here. Rather than allocating a fixed percentage of your portfolio to SLV, cap your exposure at a level where a 40% drawdown will not force you to sell at the worst moment.
Portfolio Construction and Position Sizing
Many investors allocate 2-5% of their total portfolio to silver as a hedge against currency devaluation and inflation, with SLV serving as the convenient vehicle despite its 0.50% annual expense ratio. If you commit to a multi-year hold based on the long-term forecast, the premium to NAV matters less than the trajectory itself. Consider SLV as a tactical position rather than core exposure if you feel uncomfortable with 40% swings. This approach protects you from forced selling during sharp declines while maintaining exposure to the long-term uptrend.
Risk Factors That Could Invalidate the Forecast
The real risk lies not in the price forecast but in the forces that could invalidate it entirely. A sustained surge in real interest rates above 3% would crush silver demand and push prices toward the lower end of analyst targets or beyond. Dollar strength extending into 2026 creates headwinds that offset industrial demand gains, particularly if the Federal Reserve maintains restrictive policy longer than markets expect. Mining disruptions in Mexico or Peru could create temporary spikes that trap momentum traders, while geopolitical escalation might trigger safe-haven rallies that fade once tensions ease.
Technical Levels and Entry Signals
Use the support level at $64.27 as your decision point: if SLV breaks below this level decisively, the downside forecast gains credibility and further losses accelerate. Conversely, if SLV sustains above $71.12 resistance, it signals the long-term uptrend has legs and near-term pullback risks diminish. Dollar weakness and Fed rate-cut signals offer your most reliable entry points for adding to SLV positions, since these conditions historically precede silver rallies. Monitor the gold-silver ratio as a timing tool: when silver underperforms gold significantly, it often signals an upcoming mean reversion that favors silver outperformance.
Valuation Compression and Premium Dynamics
The premium to NAV at 15% remains elevated, so watch for compression during market stress when liquidity concerns surface and premiums typically shrink, creating additional downside even if silver spot prices hold steady. This premium compression happened repeatedly during the 2020 pandemic crash and the 2022 banking turmoil, with SLV declining faster than the underlying silver value. Understanding this dynamic helps you anticipate total returns that diverge from silver price movements alone. When you evaluate SLV positions, factor in both the spot price forecast and the likelihood that the current 15% premium contracts toward historical averages of 5-8%.
Final Thoughts
Silver’s price movements hinge on three forces: industrial demand from solar and electronics, dollar strength and interest rates, and geopolitical shocks that override fundamentals. The iShares Silver Trust forecast shows near-term pain followed by long-term gains, with analysts projecting a 43.54% decline through 2026 before prices climb toward $97.25 by 2050. This disconnect between short-term weakness and multi-decade strength defines how you should position yourself in SLV.
SLV works best as a tactical position sized conservatively enough to survive a 40% drawdown without forcing you to sell at the worst moment. A 2-5% portfolio allocation gives you exposure to silver’s long-term uptrend while protecting your overall financial plan from the volatility that comes with commodity ETFs. The 15% premium to net asset value matters less for long-term holders but becomes a real risk if that premium compresses during market stress, which happened in 2020 and 2022.
Monitor support at $64.27, resistance at $71.12, and the premium to NAV as your three key decision points. Watch for dollar weakness and Federal Reserve rate-cut signals before adding to positions, since these conditions historically precede silver rallies, and track mining disruptions in Mexico and Peru alongside central bank communications. At Natural Resource Stocks, we provide expert analysis and market insights to help you navigate commodity investments with confidence, giving you the context needed to execute your strategy effectively.