


Resource commodity cycles move in predictable patterns, but most investors treat them like random events. At Natural Resource Stocks, we’ve built this guide to help you read those cycles and act on them before the crowd does.
The difference between profit and loss often comes down to timing. We’ll show you how to spot the signals that matter.
Reading the Four Commodity Supercycles
The Bank of Canada has tracked four major commodity supercycles since the 1900s, and understanding their patterns reveals why most investors fail to time resource markets correctly. The first supercycle in the early 1900s was driven by demand for steel and coal supporting U.S. infrastructure development. The second emerged pre-WWII as metals and oil demand surged from militarization. Post-WWII industrialization in Europe and Japan created the third supercycle through energy, steel, and metals demand. The most recent supercycle from 2001 to 2011 was fueled by China’s rise as a manufacturing powerhouse. Each cycle lasted at least five years and moved across metals, oil, and agricultural commodities in synchronized fashion.
What separates winners from losers is recognizing where we sit in the current cycle and what forces actually drive prices. The current supercycle is being fueled by global post-pandemic recovery, the energy transition demanding copper and lithium, geopolitical shifts tightening supply chains, and sustained growth in emerging markets like India. Years of underinvestment in commodity production have created genuine supply constraints that push prices higher, not temporary market distortions. This matters because it means the cycle has structural legs, not just momentum.
Why the 2016 Collapse Teaches the Wrong Lesson
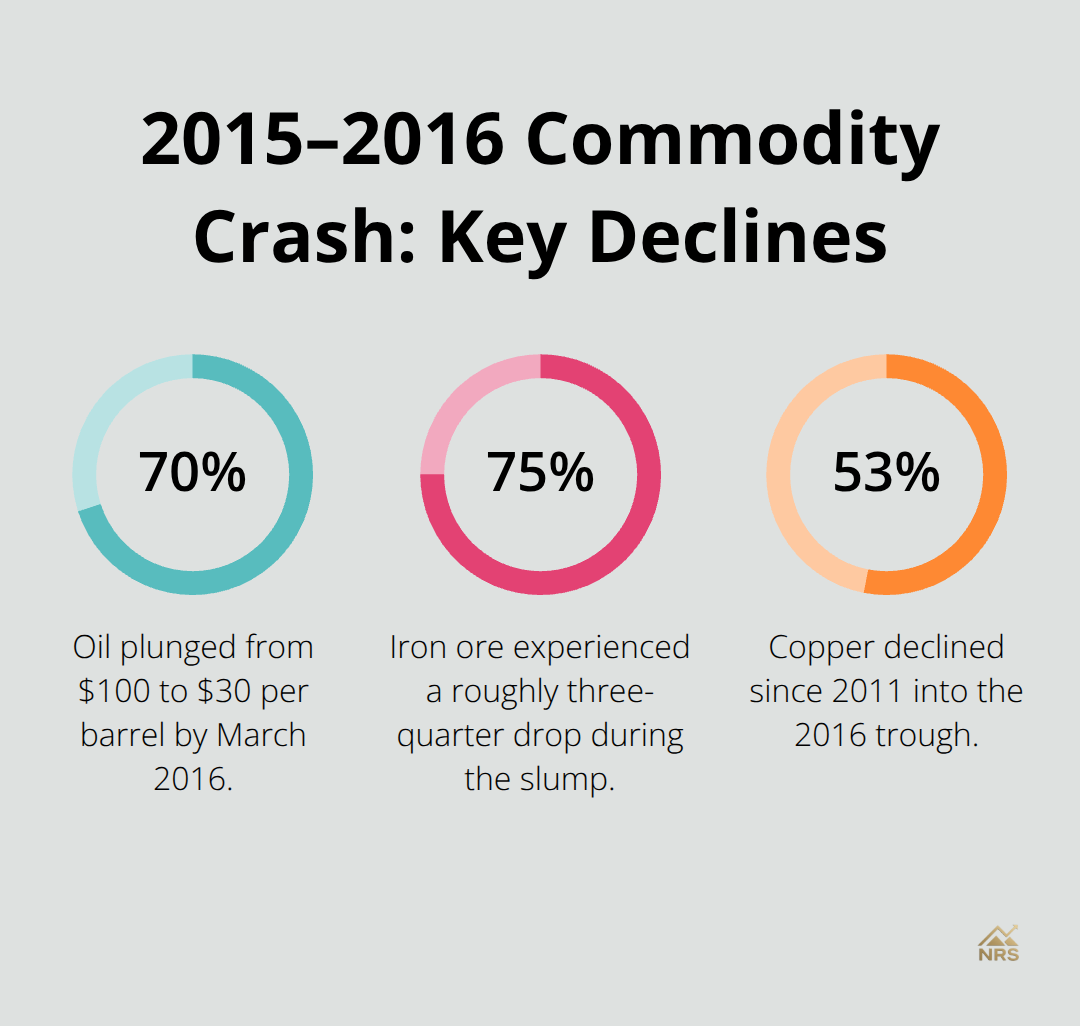
The commodity crash from 2015 to 2016 terrified investors and convinced many that commodity cycles are unpredictable death traps. Oil plunged 70% from $100 to $30 per barrel by March 2016. Iron ore dropped roughly 75%, coal fell about 61%, and copper declined 53% since 2011.
Zambia’s fiscal deficit widened so severely the kwacha became one of Africa’s worst performers. Venezuela faced actual humanitarian collapse from petrodollar shortfalls.
The lesson most investors drew was wrong. They concluded commodity prices are random. The actual lesson is that when supply and demand fundamentals deteriorate and macroeconomic growth stalls, prices fall with extreme violence. Understanding which phase you occupy prevents panic selling at bottoms and reckless buying at tops.
The Current Correction Within a Broader Cycle
The World Bank currently forecasts global commodity prices will fall to the lowest level in six years during 2026, driven by weak global growth, an oil surplus, and policy uncertainty. Prices are expected to drop 7% in both 2025 and 2026. This is not a supercycle continuation. This is a correction within a broader cycle.
Macroeconomic factors like interest rates, currency strength, and global growth rates trigger these shifts, but they are not invisible. The Federal Reserve’s interest rate decisions directly impact whether the dollar strengthens or weakens, which either crushes or supports commodity prices across the board. When you track these variables, you stop treating cycles as random events and start treating them as predictable phenomena shaped by measurable forces.
How to Spot Recovery Signals Before Prices Spike
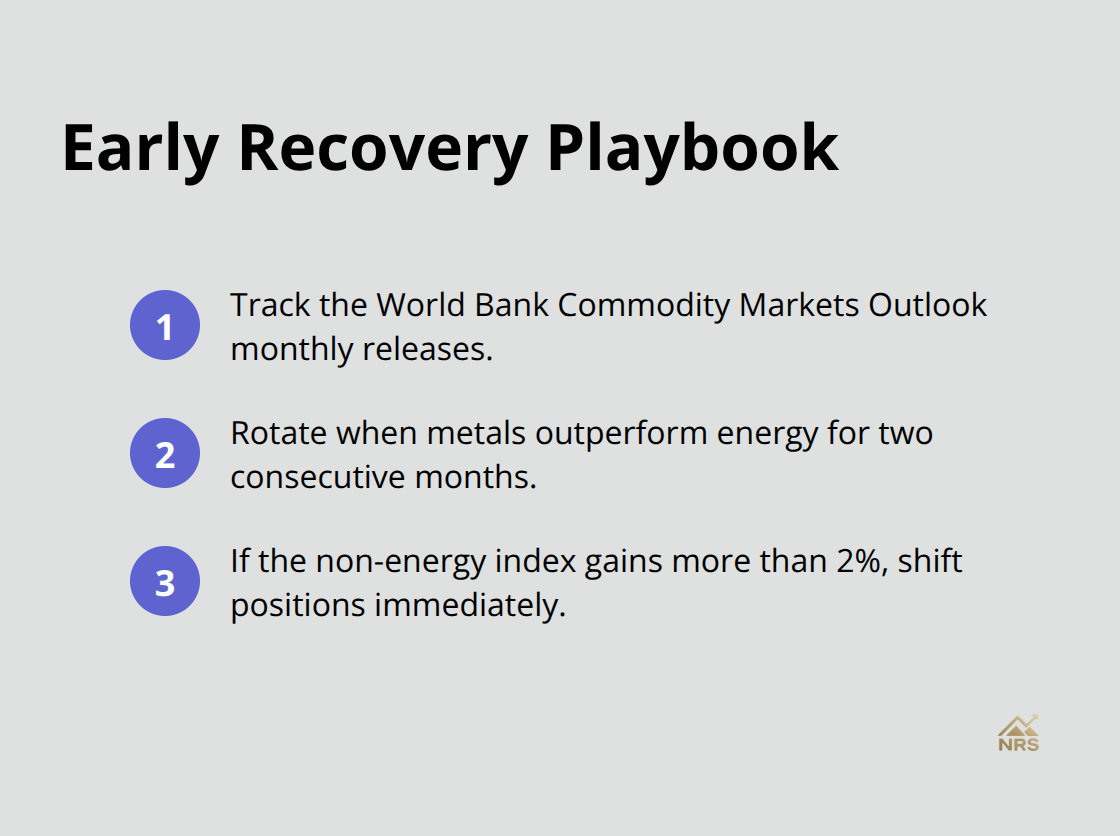
The January 2026 commodity data reveals exactly what recovery looks like in real time. World Bank Commodity Markets Outlook monthly releases captured record-setting performance and key factors influencing commodities in January 2026, signaling that the correction phase we discussed is ending and upside momentum is building. When metals and precious metals move faster than energy, it means industrial demand is reaccelerating alongside safe-haven buying. This is not noise-the market prices in economic recovery before it shows up in GDP data.
The practical move is to monitor the World Bank Commodity Markets Outlook monthly releases because they capture these shifts weeks before mainstream financial media catches on. If metals outperform energy for two consecutive months and the non-energy commodity index gains more than 2%, you should shift positions immediately, not after the move has already happened.
Positioning Capital When Momentum Turns
Gold in 2024 rose more than 21% year-to-date as inflation concerns and debt worries persisted, demonstrating that recovery cycles do not ignore macroeconomic headwinds. Many analysts expect gold to potentially surpass $3,000 per ounce as these pressures continue. Gold acts as insurance during upturns, not just downturns. During the 2001 to 2011 supercycle, investors who held gold alongside cyclical metals and oil captured both safety and explosive growth.
The tactical approach is to build positions in gold and silver first during early recovery signals, then gradually shift capital into copper and lithium as growth confirmation arrives. Copper is the metal most sensitive to industrial expansion, so tracking copper futures prices gives you a real-time read on whether the recovery is genuine or false. If copper breaks above its 200-day moving average while gold continues climbing, you have confirmation that both defensive and growth positioning is warranted.
For oil, selective positioning makes sense given market dynamics, rather than broad exposure. Natural gas presents a different opportunity because supply constraints remain structural, making it the energy play most likely to outperform during upturns.
Allocating Capital Using the Risk Framework
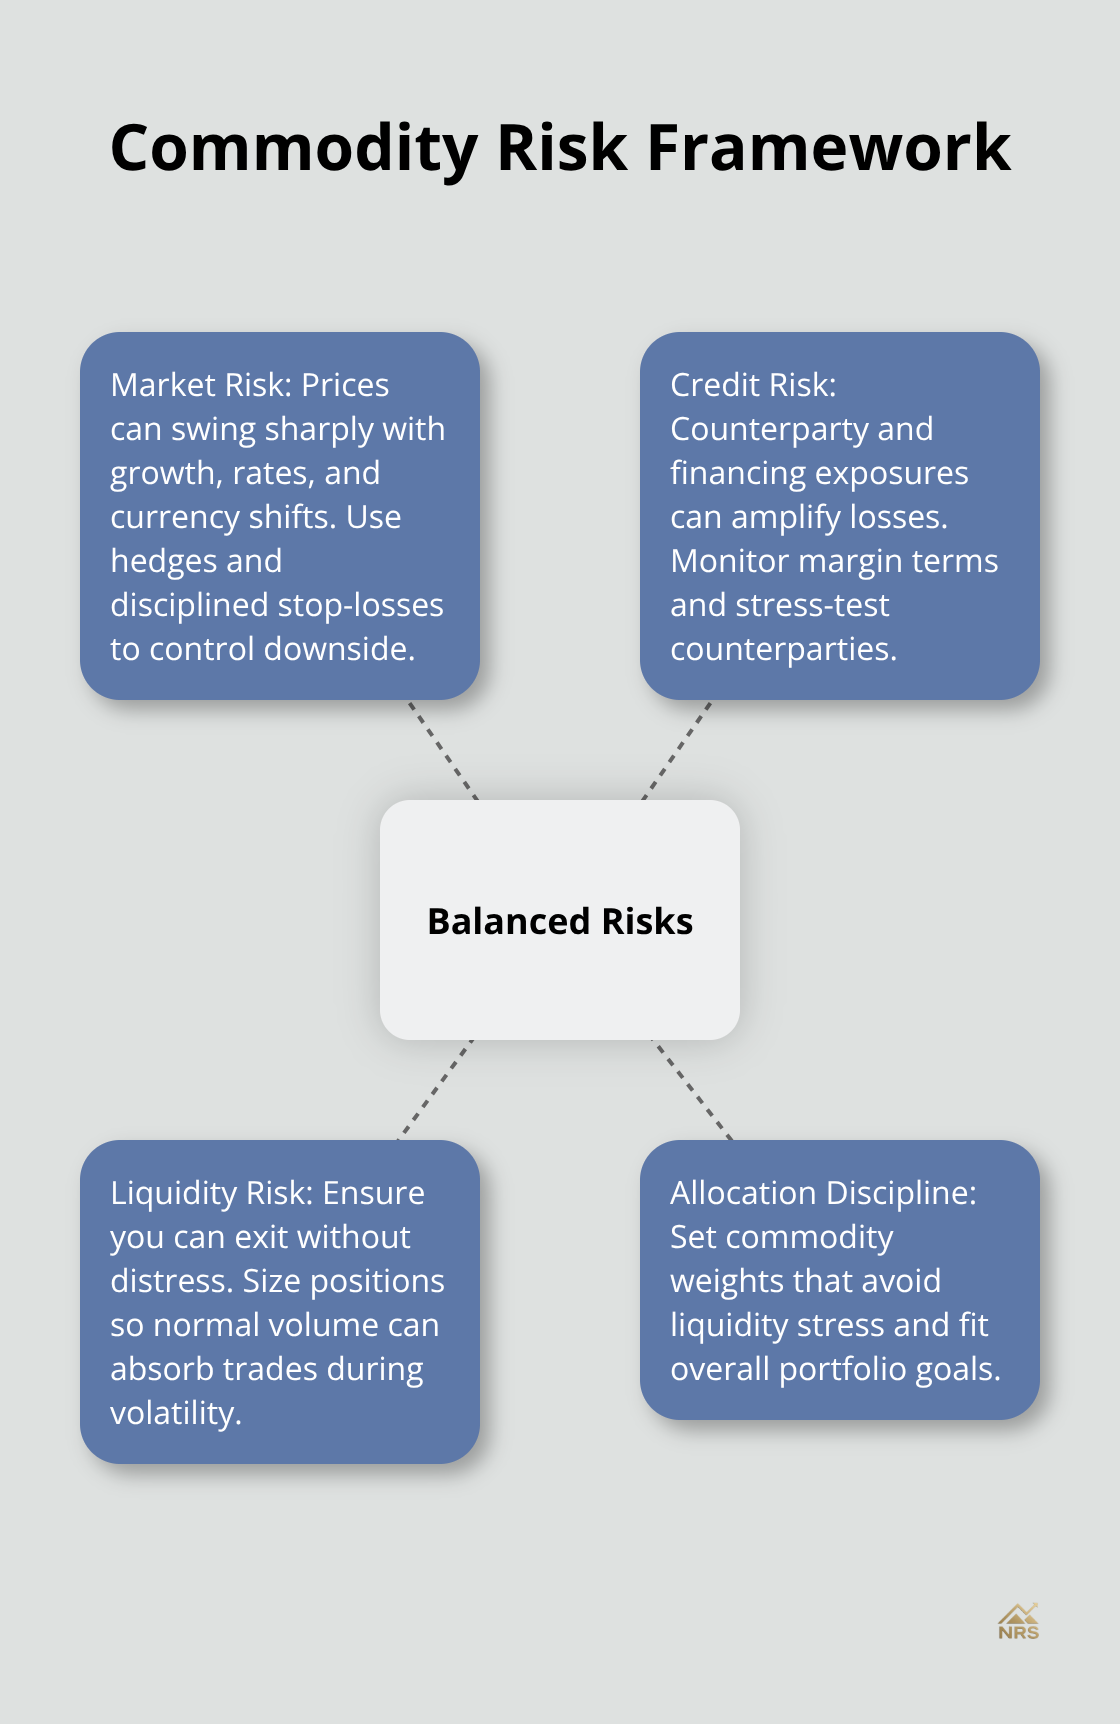
The McKinsey 2025 analysis of commodity traders revealed that the most successful operations balance market risk, credit risk, and liquidity risk simultaneously rather than treating them separately. Apply this framework to your portfolio: determine how much capital you can allocate to commodities without creating liquidity stress if prices move against you. If you have less than 10% of your portfolio in alternatives currently, commodities deserve consideration during upturns because they provide genuine diversification that stocks and bonds cannot offer.
The Federal Reserve’s interest rate signals matter more than any other single indicator during recovery phases. When the Fed signals an end to higher rates, a weaker dollar typically follows, which bolsters the entire commodities complex including gold. Track the Fed’s forward guidance statements, and when officials begin discussing rate cuts, increase commodity allocations within 4 to 6 weeks because the market prices these moves ahead of time.
Sequencing Your Metal Exposure
Silver tends to outperform gold when industrial demand accelerates, so shift from pure gold exposure into silver once copper confirms the recovery is real. This sequencing prevents you from sitting in defensive metals too long while also preventing premature exposure to cyclical assets that may not hold their gains. The transition from recovery signals to confirmed growth requires active monitoring of these three metals in sequence: gold first, then silver, then copper. Each metal tells you something different about what the market expects to happen next, and reading that sequence correctly determines whether you capture the full upside or exit too early.
Protecting Capital When Downturns Arrive
Downturns in commodity markets arrive with visible warning signs, but most investors ignore them until prices have already collapsed. The World Bank forecasts prices will drop 7% in both 2025 and 2026, yet many commodity allocations remain positioned for growth rather than defense. The difference between managing downturns successfully and suffering severe losses comes down to recognizing what the data actually says before sentiment shifts.
Reading the Data Before Prices Fall
When the energy price index falls while metals decline faster, industrial demand is weakening, not stabilizing. When precious metals fail to hold their gains even as macroeconomic uncertainty rises, safe-haven buying has exhausted itself and sellers are stepping in. The McKinsey analysis of commodity traders revealed that firms treated market risk, credit risk, and liquidity risk in isolation rather than together and suffered the largest losses during volatile periods.
You cannot simply hold a commodity position and hope price movements work in your favor. You must actively monitor whether the macroeconomic environment supporting your thesis still exists. If interest rate expectations shift toward higher rates, the dollar strengthens, and emerging market growth stalls simultaneously, your commodity allocation faces downward pressure from three directions at once.
Setting Exit Thresholds Before Entering Positions
The practical move is to set specific exit thresholds before you enter positions. If gold fails to hold $2,800 per ounce while copper breaks below its 200-day moving average, reduce exposure immediately rather than waiting for confirmation that the downturn is real. Price action itself is the confirmation. Waiting for economic data to catch up means you exit at worse prices than available when warning signals first emerged.
This discipline separates investors who preserve capital from those who suffer catastrophic losses. The 2015 to 2016 collapse demonstrated this principle: oil dropped 70%, iron ore fell 75%, and copper declined 53%. Investors who waited for official recession declarations exited far lower than those who acted on price signals alone.
Tactical Allocation Across Sectors
Diversification across resource sectors during downturns works differently than most investors assume. Spreading capital equally across gold, silver, copper, oil, and natural gas does not protect you because these commodities often decline together when macroeconomic conditions deteriorate. The World Bank data from 2015 to 2016 confirmed that sector diversification provides minimal protection during severe downturns.
Instead, tactical allocation means holding the assets most likely to hold value when growth expectations collapse. Gold and silver preserve capital better than industrial metals during downturns because fear drives safe-haven buying even as economic activity slows. Natural gas presents a different opportunity because supply constraints remain structural regardless of economic cycles, making it less correlated to growth expectations.
Monitoring Natural Gas Versus Oil Performance
The practical approach during downturns is to shift capital from cyclical positions like copper into defensive positions like gold, then monitor whether natural gas outperforms or underperforms relative to oil. If natural gas gains 5% while oil falls 10%, it signals that supply tightness still matters more than demand destruction, creating a genuine opportunity within a declining market.
The Federal Reserve’s interest rate guidance determines whether this shift should happen gradually or quickly. When the Fed signals rates will remain higher for longer, commodity allocations should shrink by 30 to 40% within two weeks because the dollar strength that follows crushes prices across the board. When the Fed signals potential rate cuts, you can maintain larger allocations because currency weakness typically supports commodity prices even amid slower growth. These decisions require active management, not passive holding.
Final Thoughts
Resource commodity cycles reward investors who act on data rather than hope. You now understand how to monitor World Bank releases, track Federal Reserve signals, and recognize when metals outperform energy-the exact indicators that separate profitable positioning from costly mistakes. The framework we’ve outlined transforms commodity allocation from passive holding into active management that captures gains during upturns and protects capital during downturns.
Success in these markets requires you to rotate between defensive and cyclical assets based on macroeconomic conditions and price action. Gold and silver preserve value when fear dominates markets, while copper and oil amplify returns when demand accelerates. Natural gas operates independently on supply constraints, offering opportunities even when broader commodity cycles weaken. This rotation discipline prevents you from holding the wrong assets at the wrong time.
Visit Natural Resource Stocks to access expert analysis and real-time commentary on how geopolitical shifts and policy changes affect resource prices. Our platform delivers the market insights and community access you need to navigate resource commodity cycles with confidence and position your portfolio for the opportunities ahead.