


Silver prices are moving in ways that matter to investors right now. Industrial demand, geopolitical shifts, and dollar strength are reshaping the market in 2026.
At Natural Resource Stocks, we’re breaking down what a realistic silver stock price forecast looks like based on concrete market data. This guide covers the trends, opportunities, and risks you need to understand before making your next move.
How Silver Performed Over the Last Decade
Silver surged 147% in 2025 alone, rising from about $28.92 at the start of the year to over $72 by year-end, but this explosive move masks a more complex decade-long story. From 2015 to 2024, silver traded in a wide range, spending most years between $15 and $30 per ounce before breaking above $30 in late 2024 and accelerating higher through 2025. The metal hit an all-time high of $54.48 on October 17, 2025, signaling that the current rally is fundamentally different from previous cycles. This isn’t a speculative bubble but a structural shift driven by supply constraints and industrial demand that won’t reverse quickly. The Investing News Network reports that silver has entered its fifth consecutive year of supply deficits, with Metal Focus projecting a deficit of 63.4 million ounces in 2025 and 30.5 million ounces in 2026. Above-ground stocks are shrinking, and mine production has fallen over the past decade despite higher prices, because roughly 75% of silver is mined as a by-product of other metals, limiting incentives to boost output. The exploration-to-production cycle for silver takes 10 to 15 years, meaning higher prices do not quickly translate into meaningfully more new mines, reinforcing persistent shortages.
Why This Cycle Differs from Past Volatility
Previous silver rallies in 2008, 2011, and 2020 were driven primarily by monetary stimulus and safe-haven demand, but they eventually collapsed when those conditions reversed. The current 2025 rally is anchored by genuine industrial demand from solar photovoltaic systems, electric vehicles, and AI data centers, according to the Silver Institute. Solar demand projected to nearly double silver consumption between 2020 and 2030, and by 2050 cumulative solar demand could equal 85 to 98% of today’s known silver reserves. EV-related silver demand rose about 20% in 2025 as vehicles use more sensors, high-voltage wiring, and power-management systems. Industrial demand now accounts for more than half of total silver consumption for the second straight year, a structural shift that did not exist in prior cycles. Geopolitical disruptions also matter: regulatory changes in Mexico reduced output by about 5% in 2025, and Russia’s role as a major producer adds geopolitical risk that constrains supply growth.
Silver Versus Gold in 2026
Gold and silver move together during risk-off periods, but silver outperforms when industrial demand remains solid and interest rates are expected to fall. Gold prices sit around $4,510 per troy ounce while silver trades near $80, reflecting a gold-silver ratio that signals relative value. Silver offers the more compelling opportunity because it combines safe-haven appeal with genuine industrial tailwinds that gold lacks. Citi forecasts silver to reach about $70 per ounce in 2026 if industrial fundamentals stay supportive, but other analysts like Frank Holmes at US Global Investors argue for upside above $100 per ounce if solar and AI demand accelerates. The key difference is that gold is primarily a monetary hedge, while silver is both a monetary asset and a critical industrial metal tied to the energy transition and technology adoption.
What Investors Should Watch Next
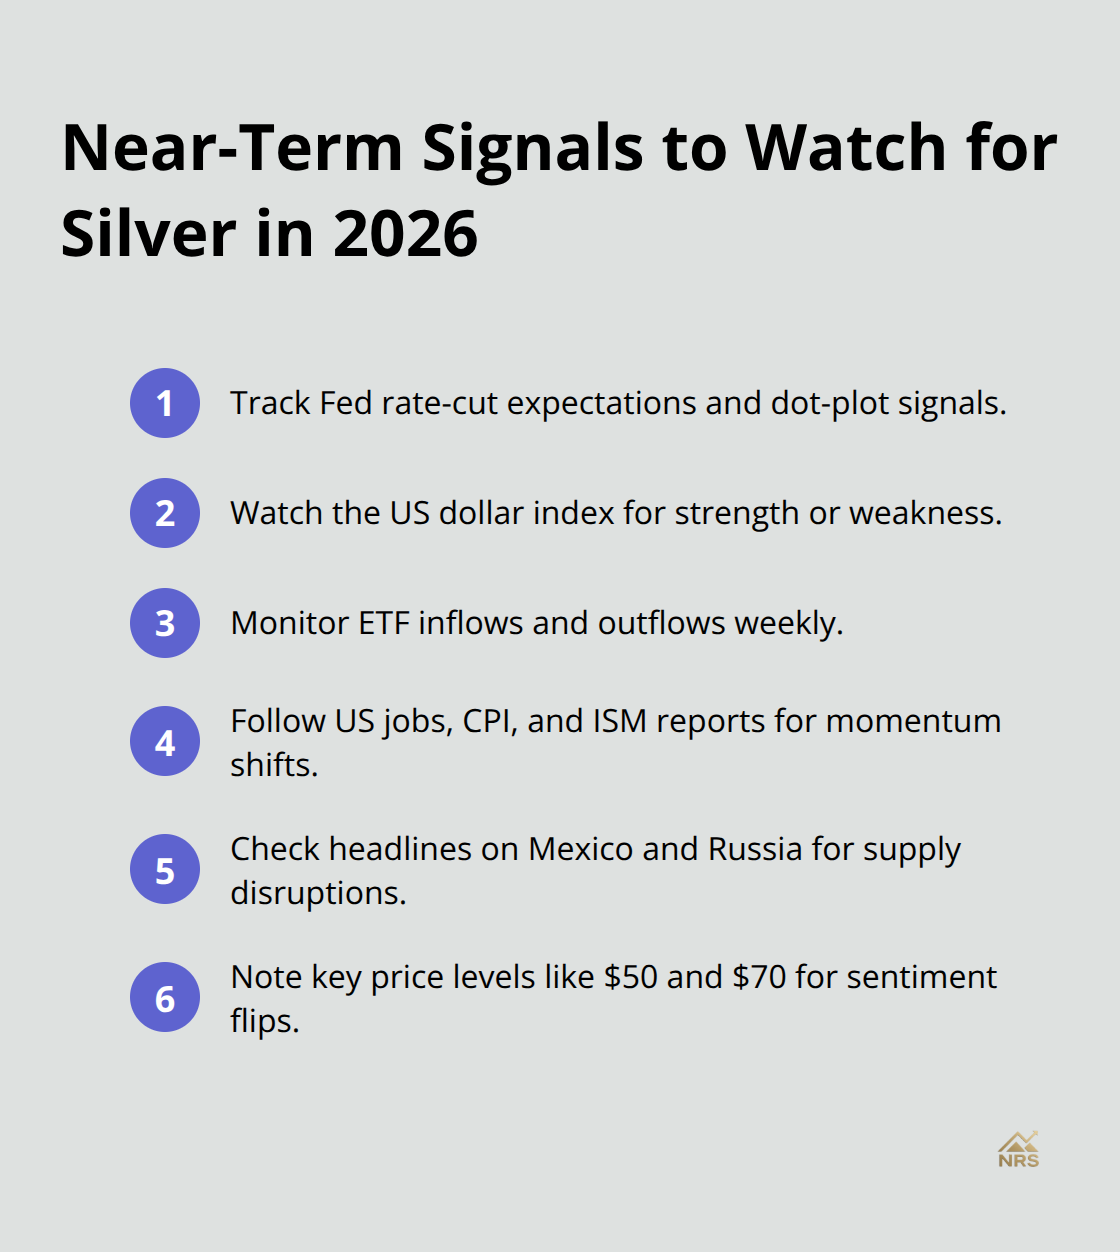
The structural supply deficit and rising industrial demand create a foundation for higher prices, but near-term volatility will test conviction. Fed rate-cut expectations, dollar strength, and ETF inflows will shape price action in the first half of 2026. Understanding these near-term drivers-and how they interact with long-term industrial trends-is essential for positioning in silver stocks and related investments.
What’s Driving Silver Prices in 2026
Solar Energy Reshapes Industrial Demand
Solar energy dominates the shift in silver consumption, and the scale is substantial. PV manufacturers consumed roughly a quarter of annual silver supply in 2024, and that proportion continues rising through 2025. Solar capacity is forecast to grow at 17% compound annual growth rate (CAGR) to 2030, meaning the industry will use more silver in the next five years than it consumed in the previous decade. The Silver Institute projects that cumulative solar demand through 2050 could equal 85 to 98% of today’s known silver reserves. This trend reflects real market activity, not speculation. The US installed 37 gigawatts of solar capacity in 2024 alone, and global capacity accelerates as countries pursue net-zero targets. Industrial demand now accounts for more than half of total silver consumption for the second straight year-a structural shift that anchors prices higher independent of safe-haven sentiment.
Electric Vehicles and Data Centers Expand the Picture
EV manufacturers increased silver consumption by about 20% in 2025 as they added more sensors, high-voltage wiring, and power-management systems to vehicles. AI data centers represent an emerging high-demand vector, consuming silver in high-efficiency components and thermal management systems. These applications create persistent demand that won’t reverse when market sentiment shifts. The convergence of solar, EV, and data-center demand establishes a multi-year tailwind for silver that differs fundamentally from previous cycles driven solely by monetary stimulus.
Geopolitical Risk and Supply Constraints Matter
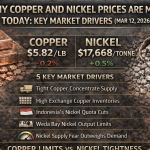
Mexico supplies roughly 20% of global silver production, and regulatory changes there reduced output by about 5% in 2025. Russia accounts for another 7% of global supply, and sanctions create ongoing supply uncertainty that supports prices. These disruptions prevent rapid supply growth even when prices rise, because the exploration-to-production cycle for silver spans 10 to 15 years. Supply tightness remains structural rather than temporary.
Currency and Monetary Conditions Shape Near-Term Price Action
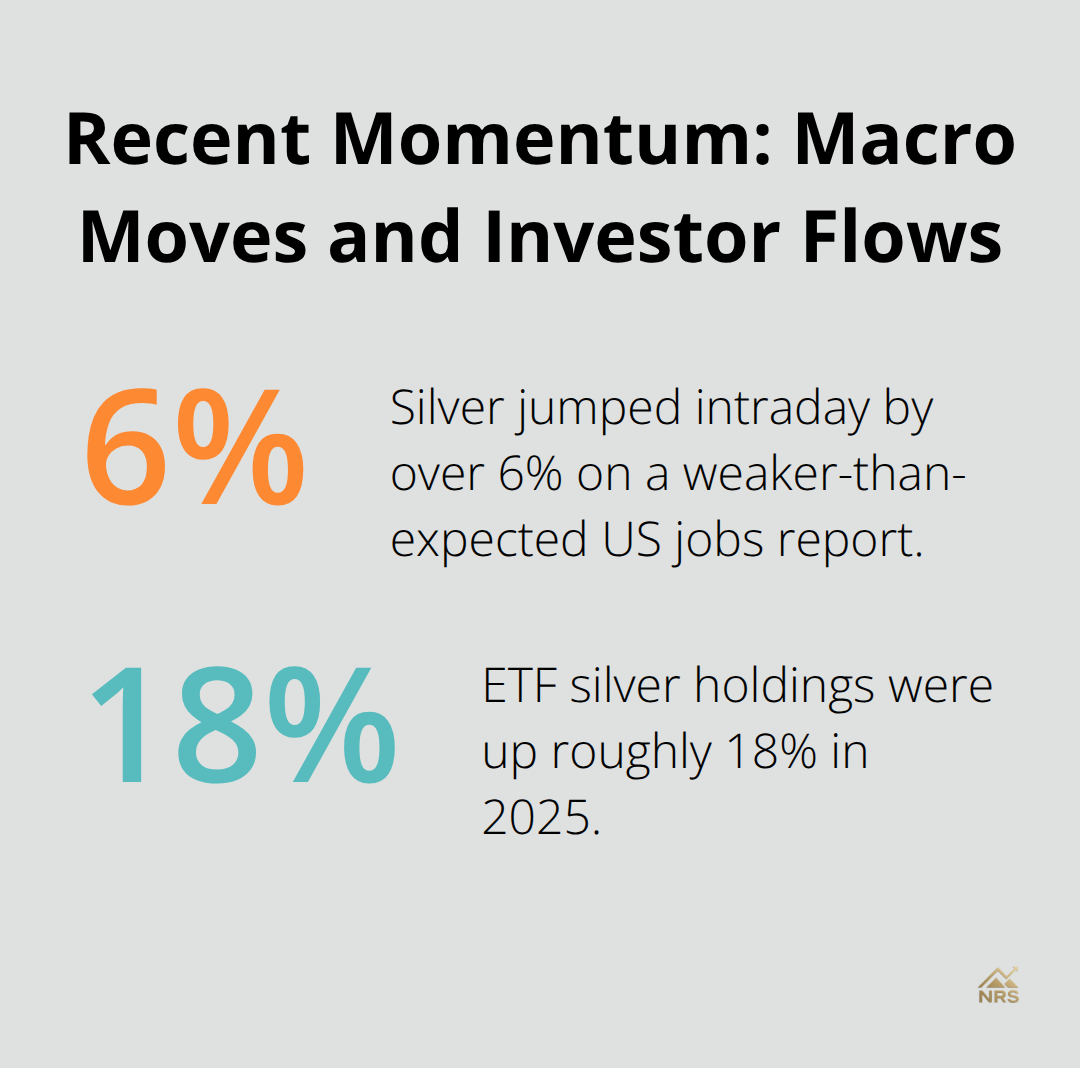
The US dollar index sits around 99.14, and dollar strength typically caps silver rallies by making the metal more expensive for foreign buyers. However, Fed rate-cut expectations offset this pressure by lowering real yields, which reduces the opportunity cost of holding non-yielding assets like silver. A weaker-than-expected US jobs report recently boosted silver intraday by over 6%, demonstrating how labor data directly influences price movement. ETF inflows turned positive in 2025, with holdings near 844 million ounces-up roughly 18% according to Saxo Bank and Bloomberg data. This retail participation matters because investors re-enter aggressively when prices dip below psychological levels like $50 or $70.
What Moves Silver Prices Day-to-Day
Monitor US macro data releases, Fed communications on rate cuts, and production disruptions in Mexico and Russia to anticipate near-term volatility. These factors drive short-term price swings, but industrial demand from solar, EVs, and data centers provides the floor that prevents sharp reversals. The practical reality is that silver now trades on two distinct narratives: immediate monetary conditions and long-term industrial fundamentals. Understanding which narrative dominates in any given week helps investors position for both the volatility and the structural upside that lies ahead.
Silver Stock Investment Opportunities
Mining Companies: Leverage and Risk Trade-Offs
Silver mining companies offer direct leverage to price appreciation, but most investors overlook a critical reality: junior miners and even mid-cap producers carry execution risk that can wipe out gains even when silver prices rise. Major producers like Pan American Silver and Fortuna Silver Mines have stronger balance sheets and established operations, meaning their stock prices track silver prices more reliably than smaller peers that depend on financing, permitting, and operational efficiency. The practical approach is to recognize that mining equities amplify both upside and downside relative to the physical metal itself. When silver rises from $80 to $100 per ounce, a well-positioned mining company might see earnings double or triple, but when silver falls to $70, that same company could face margin compression or project delays that crater share value far beyond the metal’s decline.
Mining stocks work best as a tactical position within a broader silver allocation rather than your entire exposure. Silver mining stocks fell 40 to 60 percent during the 2020 pandemic crash despite silver eventually rising, meaning miners amplify fear as much as greed. This volatility matters when you assess your drawdown tolerance.
ETFs and Streaming Companies: Stability Over Leverage
ETFs and streaming companies offer a different risk profile entirely. Silver ETFs track the physical metal directly, eliminating company-specific risk and giving you pure exposure to price movements. Streaming companies like Wheaton Precious Metals buy future silver production from mines at fixed prices, then sell that silver at spot prices, capturing the spread as profit. This structure means streaming companies profit when silver rises but also generate stable cash flow regardless of price direction, making them less volatile than mining equities while still offering meaningful upside participation.
Streaming companies typically trade at premium valuations because institutional investors value their predictable returns, but that premium is justified by the lower drawdown risk compared to mining stocks. The cash-flow stability these companies provide creates a foundation that mining equities cannot match.
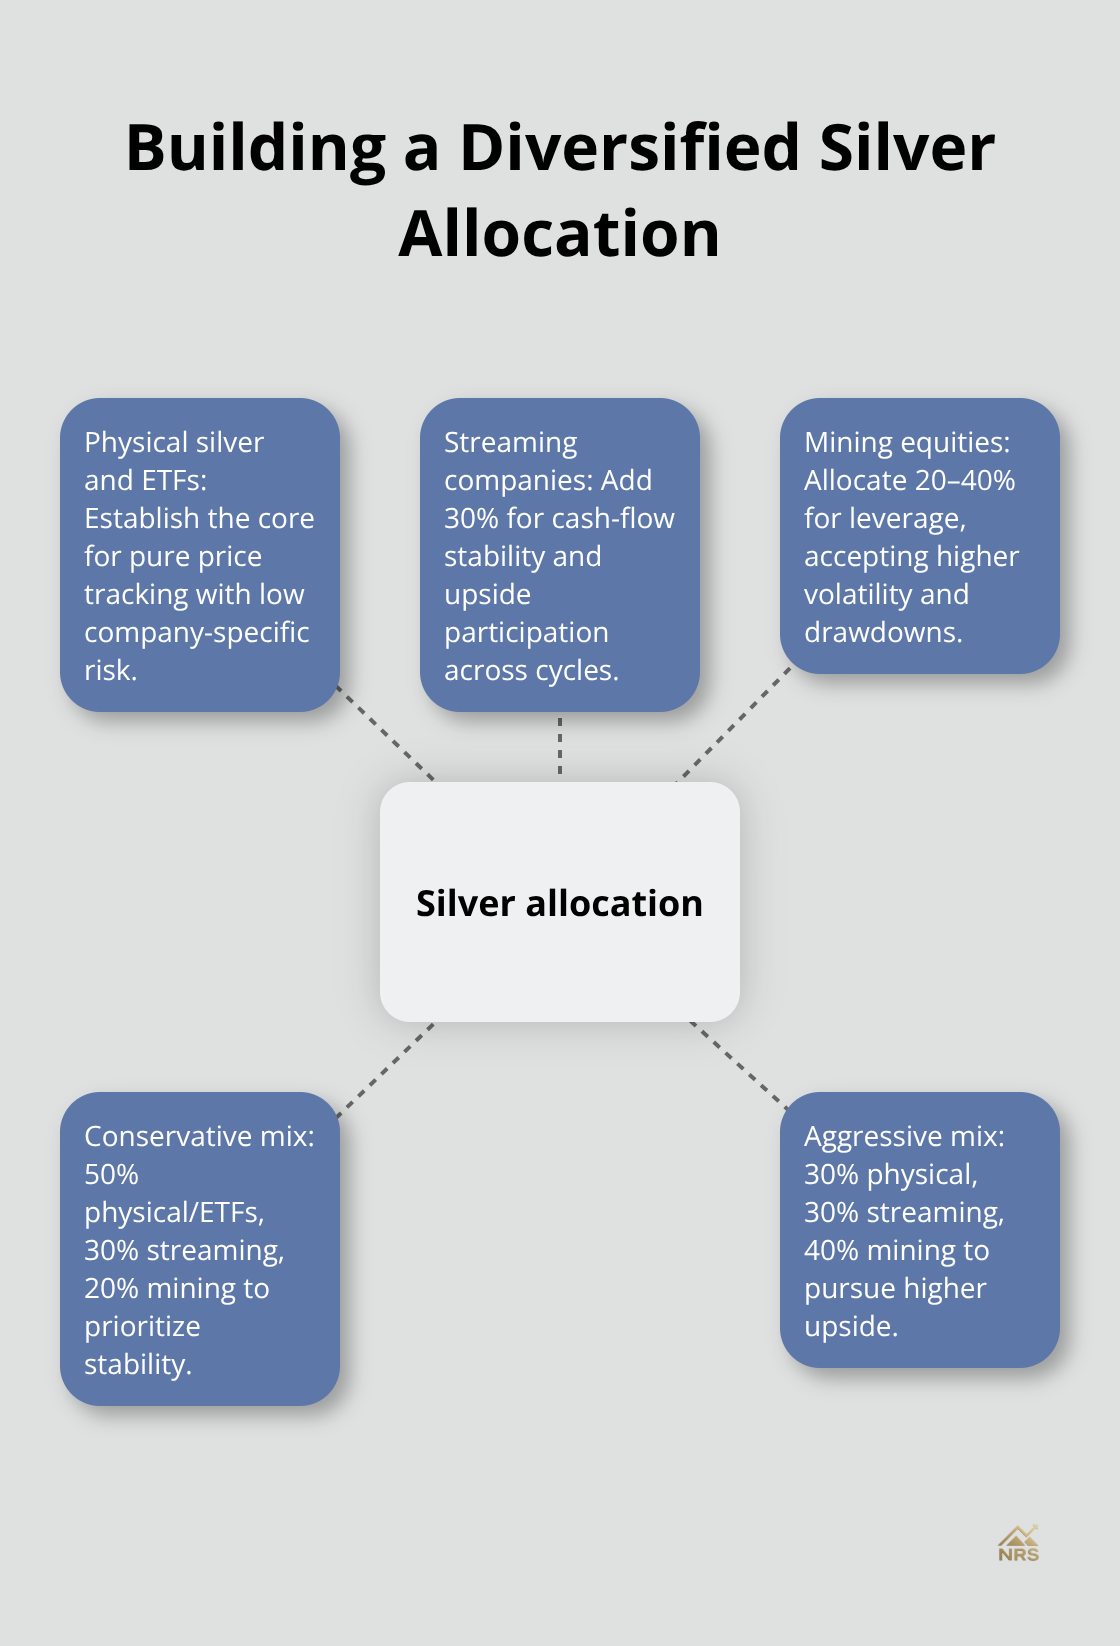
Building a Diversified Silver Allocation
Your actual strategy should combine all three exposure types based on risk tolerance and time horizon. A conservative approach allocates 50 percent to physical silver or silver ETFs for price tracking, 30 percent to streaming companies for cash-flow stability, and 20 percent to mining equities for leverage during rallies. An aggressive approach flips this to 30 percent physical, 30 percent streaming, and 40 percent mining stocks, accepting higher volatility for greater upside participation.
The critical mistake most investors make is chasing the highest leverage without understanding drawdown tolerance. Position sizing matters more than security selection in this environment. Start with a core holding in a broad precious metals ETF that tracks multiple metals, then layer in sector-specific silver exposure through a dedicated silver ETF or streaming company.
Only add mining stocks once you have established this foundation and can afford to hold through 20 to 30 percent declines without panic selling.
Managing Volatility and Monitoring Performance
Stop-loss orders work poorly in silver equities because sharp intraday moves trigger exits at the worst time, so instead set a quarterly review schedule to reassess thesis strength rather than react to daily volatility. Monitor quarterly earnings reports from streaming companies and mining producers to track margins and cash generation, because silver price gains mean nothing if operational costs rise faster than revenues. This disciplined approach prevents emotional decisions that lock in losses at market bottoms.
Final Thoughts
Silver’s structural supply deficit combined with rising industrial demand from solar, electric vehicles, and data centers creates a compelling case for higher prices in 2026. Base-case targets sit around $70 per ounce, with upside potential toward $100 if industrial adoption accelerates as expected. This silver stock price forecast reflects a fundamental shift: solar capacity growth, EV electrification, and AI infrastructure expansion represent persistent demand that won’t evaporate when monetary conditions shift, while Mexico’s production constraints and Russia’s geopolitical risk add supply pressure independent of safe-haven sentiment.
Silver offers multiple exposure paths, each with distinct risk-return profiles. Physical silver and ETFs provide pure price participation without company-specific risk, streaming companies deliver cash-flow stability alongside meaningful upside, and mining equities amplify both gains and losses, requiring disciplined position sizing and quarterly monitoring rather than daily price watching. Your allocation should match your drawdown tolerance and time horizon, not chase the highest leverage available.
What matters most moving forward is monitoring three specific drivers: US macro data and Fed rate-cut expectations, which influence real yields and dollar strength; industrial demand trends from solar installations and EV production, which anchor the long-term price floor; and supply disruptions in Mexico and Russia, which can trigger sharp price spikes. These factors interact constantly, creating both volatility and opportunity, and Natural Resource Stocks provides the market analysis and expert commentary you need to navigate this environment with confidence.