


Gold prices hit record highs in 2024, making strategic selection of investment partners more important than ever. The right gold investment companies can provide exposure to physical gold, mining stocks, and streaming opportunities.
We at Natural Resource Stocks analyzed the top performers across different categories. This guide examines leading mining companies, investment platforms, and evaluation criteria to help you build a strong gold portfolio.
Which Gold Mining Giants Offer the Best Investment Returns?
Barrick Gold Corporation’s Global Operations
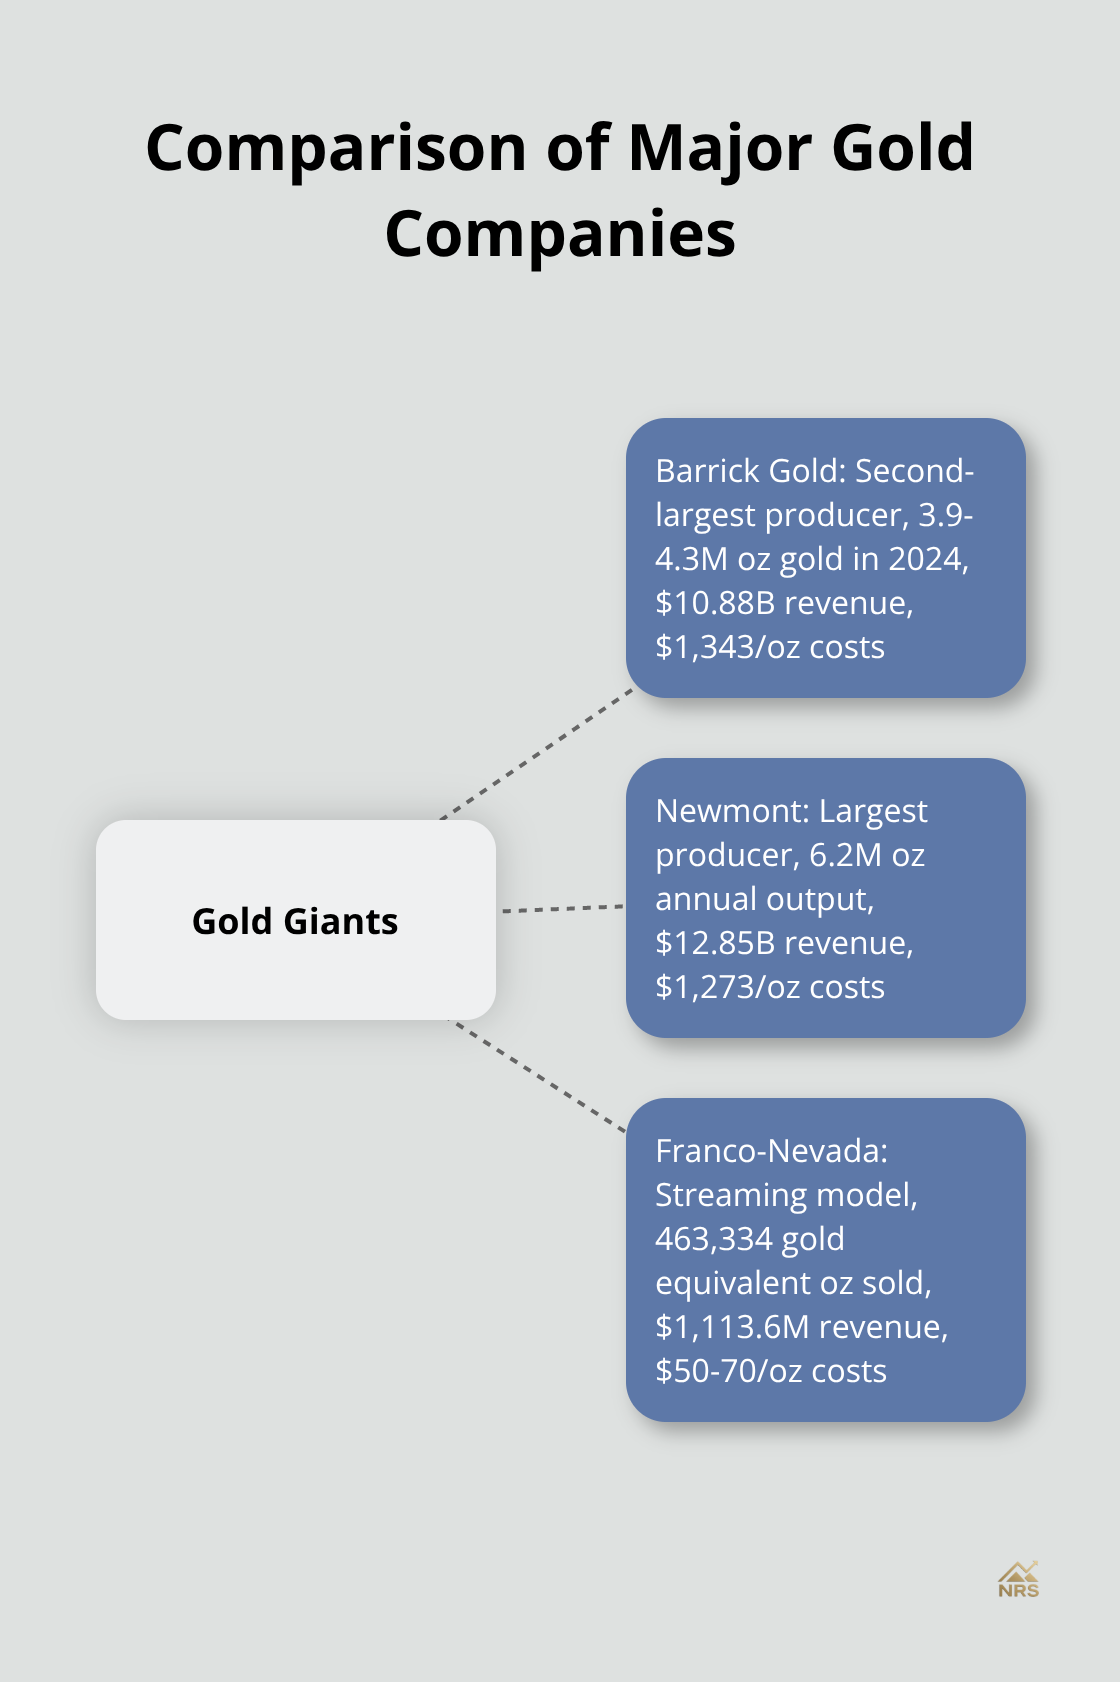
Barrick Gold Corporation operates as the world’s second-largest gold producer with facilities across five continents and 16 mines. The company expects to produce between 3.9 and 4.3 million ounces of gold in 2024. The company achieved $10.88 billion in revenue for 2023 with all-in costs of $1,343 per ounce, which positions it among the most cost-efficient operators in the sector. Barrick’s Tier One assets (including the Nevada Gold Mines joint venture with Newmont) deliver over 500,000 ounces annually with mine lives that exceed 10 years. The company maintains $4.2 billion in cash and liquid assets while it pays a dividend yield of 2.1%.
Newmont’s Market Leadership Position
Newmont Corporation holds the title of world’s largest gold producer with annual output that reaches 6.2 million ounces across operations in North America, South America, Africa, and Australia. The company reported $12.85 billion in revenue for 2023 with all-in costs that average $1,273 per ounce. Newmont’s portfolio includes 12 Tier One assets that generate over 85% of total production, with reserves that total 68.5 million ounces and a 14-year average mine life. The company completed its acquisition of Newcrest for $17.8 billion in 2023, which added high-quality assets in Australia and Papua New Guinea while it strengthened its position in copper-gold operations.
Franco-Nevada’s Streaming Success Model
Franco-Nevada operates the largest precious metals streaming and royalty business with a portfolio of over 400 assets. The company’s 2024 revenue reached $1,113.6 million with 463,334 gold equivalent ounces sold and net income of $552.1 million. The company receives metal deliveries at predetermined prices (typically 20-30% below market rates) from operations without operational risks or capital expenditure requirements. The model provides exposure to multiple projects while it maintains minimal costs of $50-70 per equivalent ounce compared to traditional miners’ costs that exceed $1,200 per ounce.
These three companies represent different approaches to gold investment, but investors also need access to reliable platforms and services to execute their strategies effectively.
How to Access Gold Investment Markets
Gold investors need reliable platforms to execute their strategies beyond individual company selection. Physical gold dealers like APMEX and JM Bullion offer direct metal ownership with secure storage solutions at IRS-approved depositories. APMEX requires minimum orders of $2,000 and charges storage fees that start at $12 monthly for segregated accounts, while JM Bullion provides no minimum investment requirements and competitive premiums over spot prices. Both companies maintain buyback programs that guarantee liquidity when you need to sell.
Physical Gold Storage Solutions
Storage costs typically range from 0.5% to 1% annually of your holdings’ value, which makes smaller positions less cost-effective than larger allocations. Segregated storage keeps your metals separate from other investors’ holdings (at higher fees), while pooled storage reduces costs but mixes your gold with other accounts. Most dealers partner with Delaware Depository Service Company and Brink’s Global Services for secure vault storage that meets IRS requirements for precious metals IRAs. Learn how to invest in physical gold and silver with proper storage strategies for long-term security.
Exchange-Traded Funds Provide Market Access
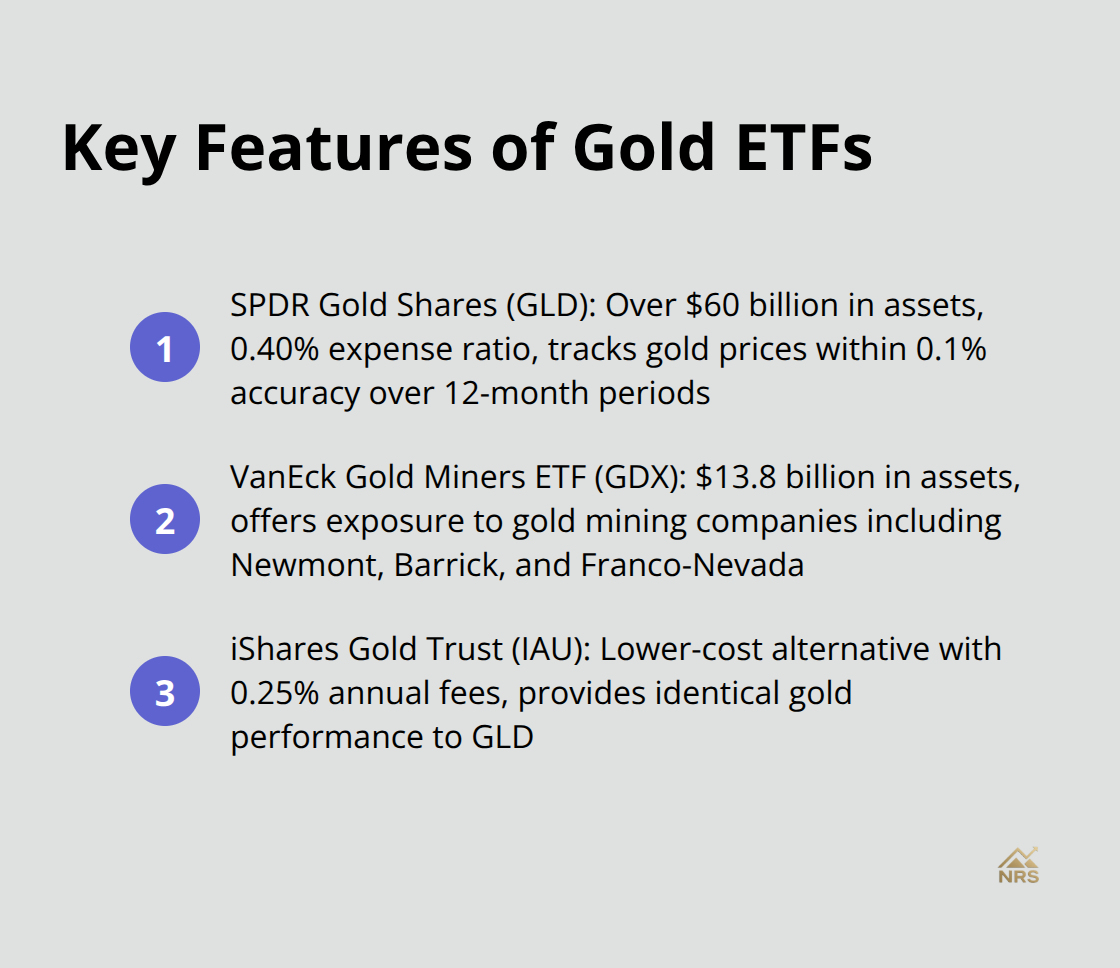
Gold ETFs eliminate storage headaches while they provide immediate market exposure. SPDR Gold Shares (GLD) holds over $60 billion in assets with an expense ratio of 0.40% and tracks gold prices within 0.1% accuracy over 12-month periods. VanEck Gold Miners ETF (GDX) offers exposure to companies with $13.8 billion in assets and includes holdings in Newmont, Barrick, and Franco-Nevada. iShares Gold Trust (IAU) provides a lower-cost alternative with 0.25% annual fees and identical gold performance to GLD. How to invest in Gold ETFs requires selecting the right brokerage platform with competitive fees.
Brokerage Platforms Enable Comprehensive Strategies
Major brokers like Charles Schwab, Fidelity, and TD Ameritrade offer commission-free trades on gold ETFs and stocks with research tools that analyze production costs and reserve estimates. Interactive Brokers provides access to international gold markets that include London and Hong Kong exchanges with margin rates that start at 1.83% for leveraged positions. These platforms integrate gold investments with broader portfolio management tools while they offer real-time data and technical analysis capabilities that traditional gold dealers cannot match.
The success of your gold investment strategy depends heavily on how well you evaluate these companies and platforms before you commit your capital.
How Do You Evaluate Gold Investment Companies
Production Costs Reveal Operational Excellence
All-in sustaining costs per ounce separate efficient operators from struggling competitors. Companies with costs below $1,300 per ounce maintain healthy profit margins when gold trades above $2,000. Barrick Gold achieves $1,343 per ounce while Newmont operates at $1,273 per ounce, which positions both companies well above industry medians of $1,450 per ounce. Companies that report costs above $1,500 per ounce face margin pressure during price volatility. Reserve replacement ratios above 100% indicate companies add more gold than they extract annually, which extends mine life and protects future production. Debt-to-equity ratios below 30% signal financial stability, while ratios that exceed 50% suggest potential cash flow problems during commodity downturns.
Management Track Record Determines Long-Term Success
Executive teams with 15-plus years in operations typically navigate market cycles more effectively than newcomers. CEOs who previously managed major acquisitions or mine development projects bring proven experience to complex operational challenges. Companies led by executives with geology or engineering backgrounds often make better technical decisions than those with purely financial backgrounds. Board composition matters significantly – independent directors with experience provide better oversight than generic corporate directors. Management compensation tied to production targets and cost control aligns executive interests with shareholder returns better than stock-option-heavy packages that encourage short-term decisions.
Geographic Spread Reduces Political and Operational Risks
Operations across multiple jurisdictions protect against single-country political upheaval or regulatory changes. Companies with assets in stable regions like Canada, Australia, and Nevada face lower sovereign risk than those concentrated in emerging markets. However, emerging market exposure can provide higher returns – Ghana and Peru offer attractive geology despite elevated political risks. Mine life diversity matters equally – portfolios that mix long-life assets (15+ years) with shorter-term, higher-grade operations provide both stability and near-term cash flow. Companies that operate in water-stressed regions face increased environmental compliance costs, which makes geographic water availability a material factor in long-term viability assessments.
Financial Health Metrics Matter Most
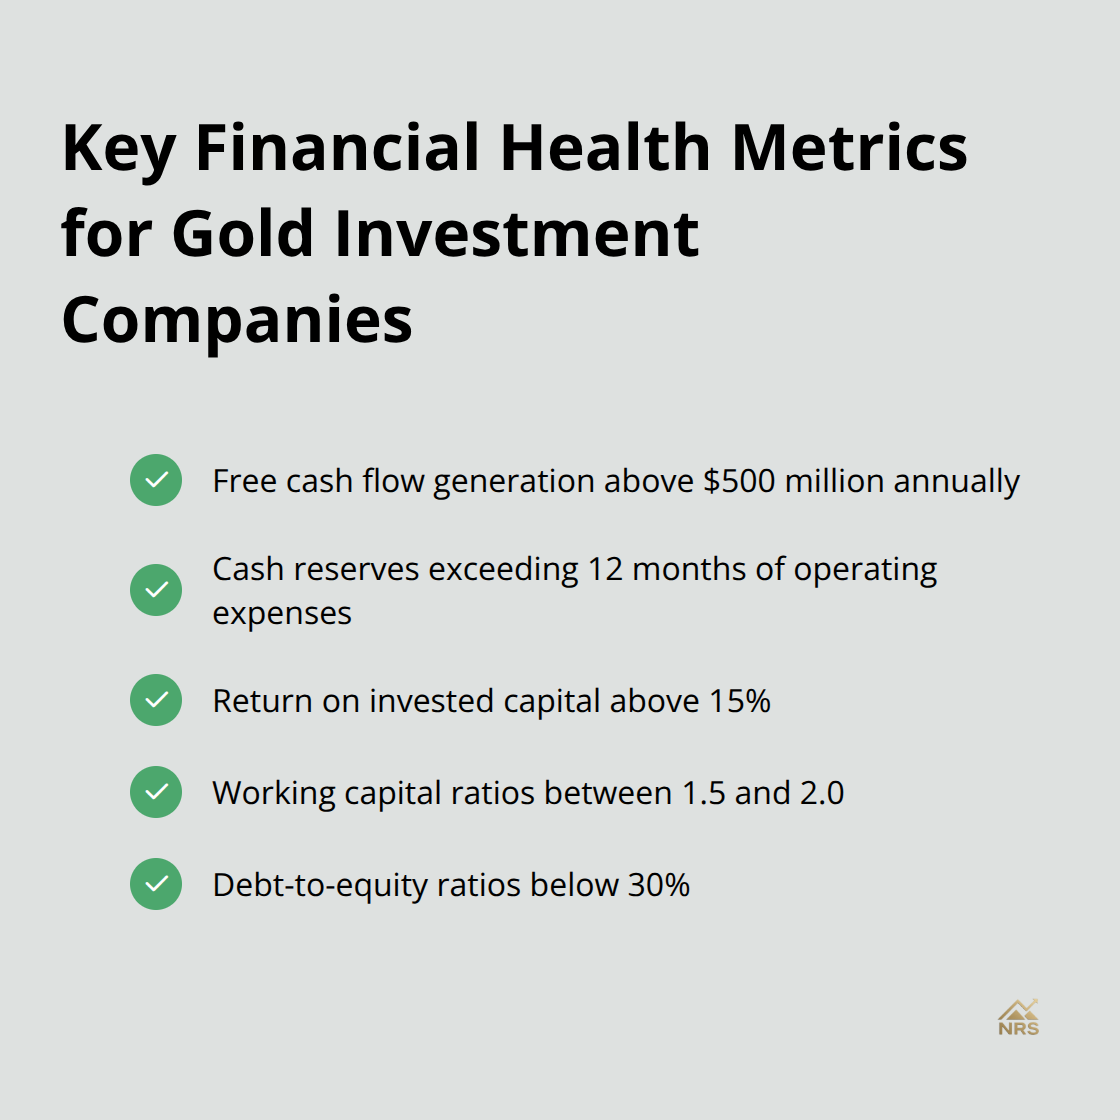
Free cash flow generation above $500 million annually demonstrates a company’s ability to fund operations and return capital to shareholders. Companies that maintain cash reserves exceeding 12 months of operating expenses weather commodity price downturns more successfully. Return on invested capital above 15% indicates efficient capital allocation, while returns below 8% suggest management destroys shareholder value. Working capital ratios between 1.5 and 2.0 provide optimal liquidity without excess cash that earns minimal returns (companies with ratios below 1.0 face potential operational constraints during market stress).
Final Thoughts
Barrick Gold Corporation leads traditional mining with $10.88 billion revenue and efficient $1,343 per ounce costs. Newmont dominates production at 6.2 million ounces annually while Franco-Nevada excels in streaming with minimal operational risks and $552.1 million net income. Physical dealers like APMEX and JM Bullion provide direct ownership with secure storage, while ETFs such as GLD offer immediate market access without storage concerns.
The best gold investment companies maintain all-in costs below $1,300 per ounce, debt-to-equity ratios under 30%, and operations across stable jurisdictions. Management teams with 15-plus years of operational experience navigate market cycles more effectively than newcomers. Interactive Brokers and major platforms enable comprehensive strategies across multiple gold investment vehicles.
A balanced gold portfolio combines physical holdings, mining stocks, and streaming companies based on your risk tolerance and investment timeline. Companies with strong cash flow above $500 million annually and return on invested capital exceeding 15% provide the best long-term value (focus on these metrics when evaluating potential investments). We at Natural Resource Stocks offer expert analysis and market insights to help you identify the strongest opportunities across metals and energy sectors for informed investment decisions.