


Commodity prices swing dramatically based on global economic conditions, geopolitical tensions, and policy shifts. At Natural Resource Stocks, we’ve seen investors miss significant opportunities simply because they didn’t understand macroeconomic commodity cycles.
This guide shows you how to read these cycles, identify when to enter and exit positions, and adjust your portfolio as conditions change. You’ll learn concrete strategies that work across metals, energy, and other natural resource sectors.
How Commodity Cycles Actually Work
Commodity cycles follow predictable patterns driven by the interaction between global demand surges and supply constraints. A true commodity cycle spans years or even decades, moving through distinct phases where prices climb as demand outpaces supply, peak when investment floods in, then decline as new capacity comes online. The World Gold Council reported that gold prices surged with the average Q4 price reaching a record US$4,135/oz (+55% y/y) in 2025, driven by central bank diversification, geopolitical risk, and safe-haven demand, while global gold supply rose only 16% since 2010 to reach 5,002 tonnes in 2025. This mismatch between rapid price appreciation and sluggish supply growth defines how cycles operate. Industrial metals show similar patterns-copper reached record highs in January 2026, briefly exceeding USD 14,500 per tonne due to persistent supply bottlenecks from low ore grades, underinvestment, and permitting delays, creating a deficit of less than 1% of demand or roughly 225 kilotonnes according to Wood Mackenzie. Silver climbed 14% year-to-date with continued strength from energy transition demand, particularly solar installations. These moves reflect structural imbalances where supply cannot keep pace with demand shifts.
Why Supply Constraints Matter More Than You Think
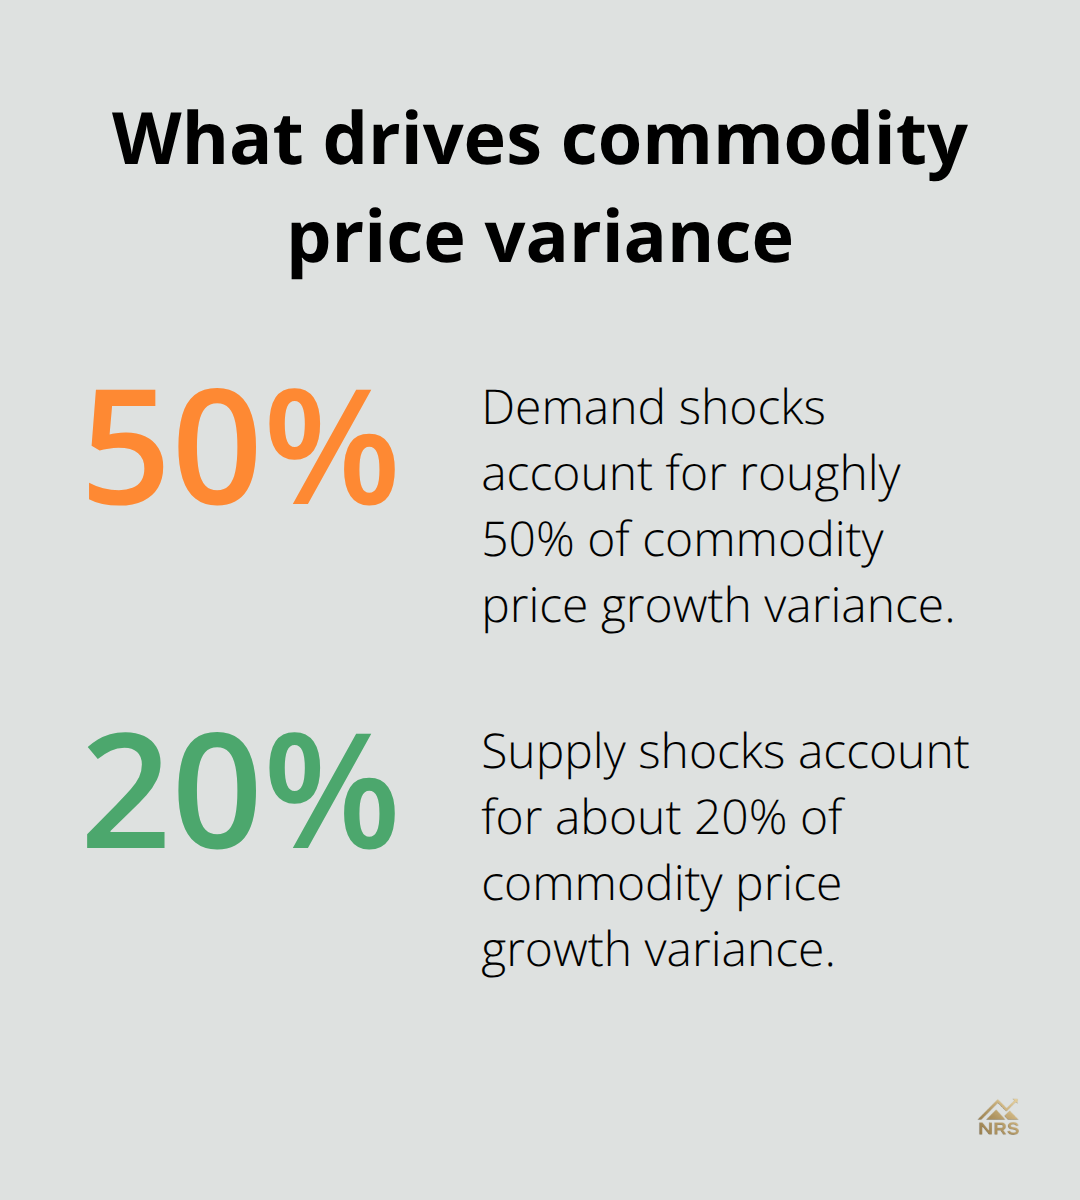
Supply responsiveness determines cycle length and intensity. Energy markets have roughly 108 million barrels per day of global production capacity, about 5% above current demand, according to the U.S. Energy Information Administration, which gives the sector flexibility to expand. Metals behave differently-mining new capacity takes years, environmental permits face delays, and ore quality decline means higher costs. This inelasticity in metals supply means price floors remain elevated during downturns, while energy prices can collapse when demand weakens. The 2020-2021 commodity surge illustrated this dynamic: widespread supply bottlenecks combined with demand rebound from stimulus pushed prices higher despite economic uncertainty. Global macroeconomic shocks now account for more than two-thirds of variance in commodity price growth, with demand shocks contributing roughly 50% and supply shocks about 20% of overall volatility. This shift from commodity-specific disruptions toward global macro factors means investors must track GDP growth, central bank policy, and geopolitical risk rather than focus narrowly on individual commodities. Understanding this hierarchy prevents chasing short-term noise and positions you for structural moves.
Reading the Current Cycle
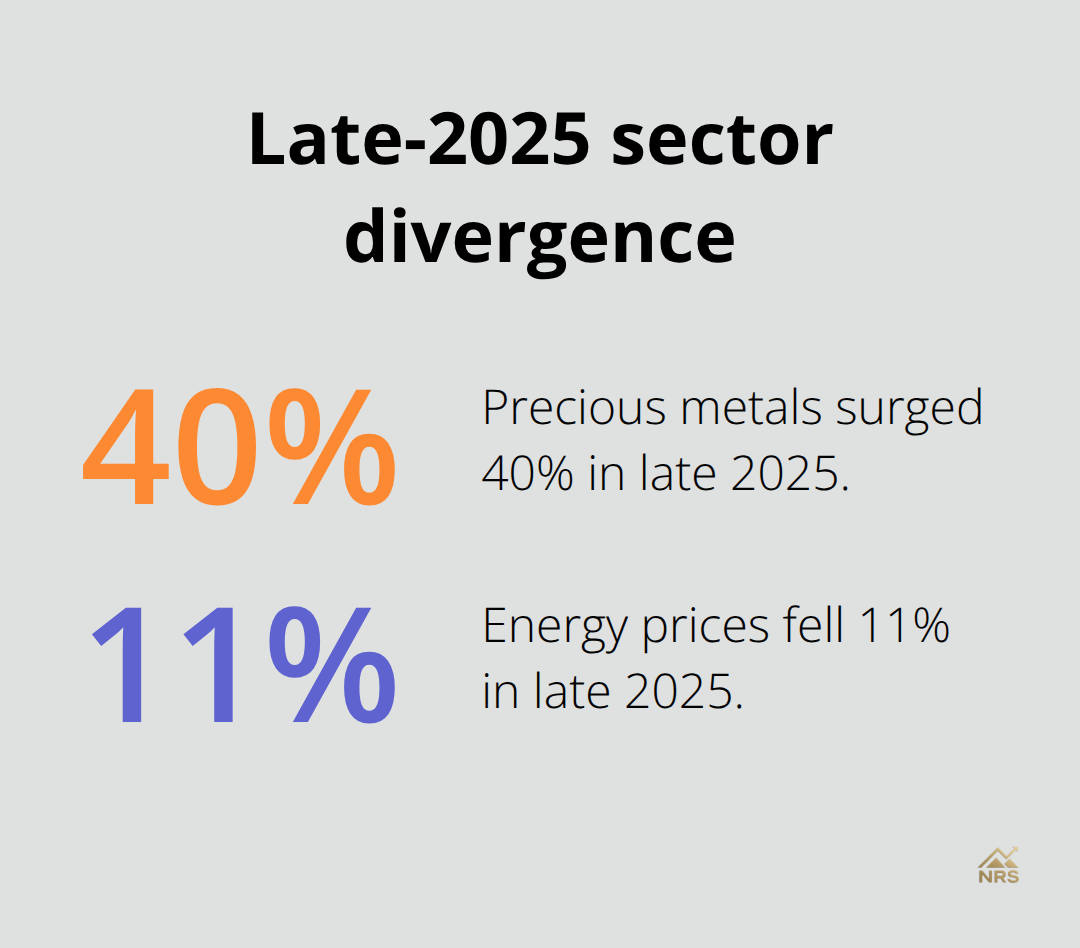
Divergence across commodity sectors demands differentiated exposure. Precious metals led the late-2025 rally with the Bloomberg Precious Metals Subindex rising over 40% from June through year-end, while industrial metals gained roughly 10% and energy fell 11%, according to Bloomberg. This crocodile cycle pattern-where metals rise while energy resets lower-reflects underlying structural shifts toward electrification and energy transition. Copper faces supply constraints from mining underinvestment over the past decade, supporting higher prices as electricity grid expansion accelerates globally. Silver benefits from both solar panel manufacturing and industrial demand, making it less vulnerable to demand destruction than oil. Energy weakness despite geopolitical risk premiums signals softer demand relative to ample supply capacity, creating opportunities for selective positioning rather than broad commodity exposure.
What This Means for Your Portfolio Strategy
Blanket commodity allocations no longer work in this environment. You need exposure to green metals like copper, lithium, and nickel that benefit from structural demand, combined with precious metals for inflation protection and geopolitical hedging, while remaining selective on energy until supply tightens meaningfully. The practical reality is that commodity sectors no longer move in lockstep-understanding which sectors face genuine supply constraints versus those with excess capacity separates successful investors from those who chase outdated playbooks. As we examine how geopolitical events and policy changes amplify or dampen these cycles, you’ll see why positioning matters far more than timing alone.
How Geopolitical Risk and Policy Shifts Reshape Commodity Markets
Geopolitical tensions and policy decisions reshape commodity markets far beyond creating temporary noise. When the Russia-Ukraine conflict erupted in 2022, energy and fertilizer prices spiked immediately because physical supply routes fractured, not from speculative panic. This distinction matters for your positioning: real supply disruptions from sanctions, regional conflicts, or trade restrictions create sustained price floors that last months or years, while political noise alone produces volatility that reverses quickly.
How Central Bank and Fiscal Policy Amplifies Commodity Demand
Central bank monetary policy amplifies commodity price moves significantly. When central banks tighten rates, they reduce liquidity in commodity futures markets and weaken demand from rate-sensitive sectors like construction and automotive manufacturing. Conversely, fiscal stimulus from government spending programs directly lifts industrial metals demand. Copper consumption accelerates when governments fund infrastructure projects because grid expansion, renewable energy installations, and transportation networks all require substantial copper quantities.
The World Gold Council documented that central bank gold purchases supported prices throughout 2025 as institutions diversified reserves away from currency risk, creating a structural demand floor independent of economic cycles. This means you should monitor central bank policy statements and fiscal spending announcements as closely as you track commodity price charts, because policy decisions often precede price moves by weeks or months.
Supply Chain Fragmentation and the Crocodile Cycle
The crocodile cycle pattern gains intensity during periods of geopolitical fragmentation. When supply chains fragment due to sanctions or regional conflicts, metals prices strengthen because alternative sourcing takes time and costs more. Energy prices can weaken if demand destruction outpaces supply concerns-exactly what happened in late 2025 when precious metals surged 40% while energy fell 11% despite ongoing Middle East tensions.
This divergence reveals that not all geopolitical risk impacts commodities equally. Energy markets respond to immediate supply disruption fears from conflict zones, but those fears evaporate if demand weakens elsewhere.
Metals markets respond to longer-term supply chain uncertainty and currency devaluation fears from geopolitical instability. Trade restrictions and sanctions create the most durable price impacts because they eliminate entire supply regions permanently or semi-permanently. When the U.S. and allies restricted access to Russian nickel and aluminum, prices for those metals jumped because substitution takes years.
Positioning for Geopolitical Supply Constraints
Your practical response should involve maintaining overweight exposure to metals facing genuine geopolitical supply constraints while staying selective on energy until structural supply tightness emerges-the opposite of traditional diversification logic. Government stimulus programs targeting green energy and infrastructure spending directly support metals like copper, lithium, and aluminum, making these sectors less dependent on general economic growth and more tied to policy commitment.
Track government capex budgets in infrastructure and renewable energy, not just GDP forecasts, because policy spending often accelerates commodity demand during periods when business investment lags. This approach positions you to benefit from the structural shifts that policy decisions create, rather than reacting to headlines after prices have already moved. Understanding how geopolitical events and policy changes interact with supply constraints allows you to identify which commodity sectors offer genuine opportunity versus which ones face headwinds-a critical distinction as we examine the specific investment strategies that work across different phases of commodity cycles.
How to Position Entries and Exits Across Commodity Phases
Timing Entry Points Before Supply Constraints Hit Prices
Commodity cycles reward investors who match their entry and exit timing to structural supply-demand imbalances rather than chasing price momentum. The critical insight from recent market behavior is that entry points emerge when supply constraints become visible but prices haven’t yet reflected the full magnitude of the shortage. Copper exemplifies this pattern: prices reached record highs above USD 14,500 per tonne in early 2026 after years of mining underinvestment created a deficit of roughly 225 kilotonnes according to Wood Mackenzie. Smart investors positioned into copper during 2024 when supply concerns appeared in industry reports but prices remained below USD 10,000 per tonne. They didn’t wait for headlines to confirm the shortage.
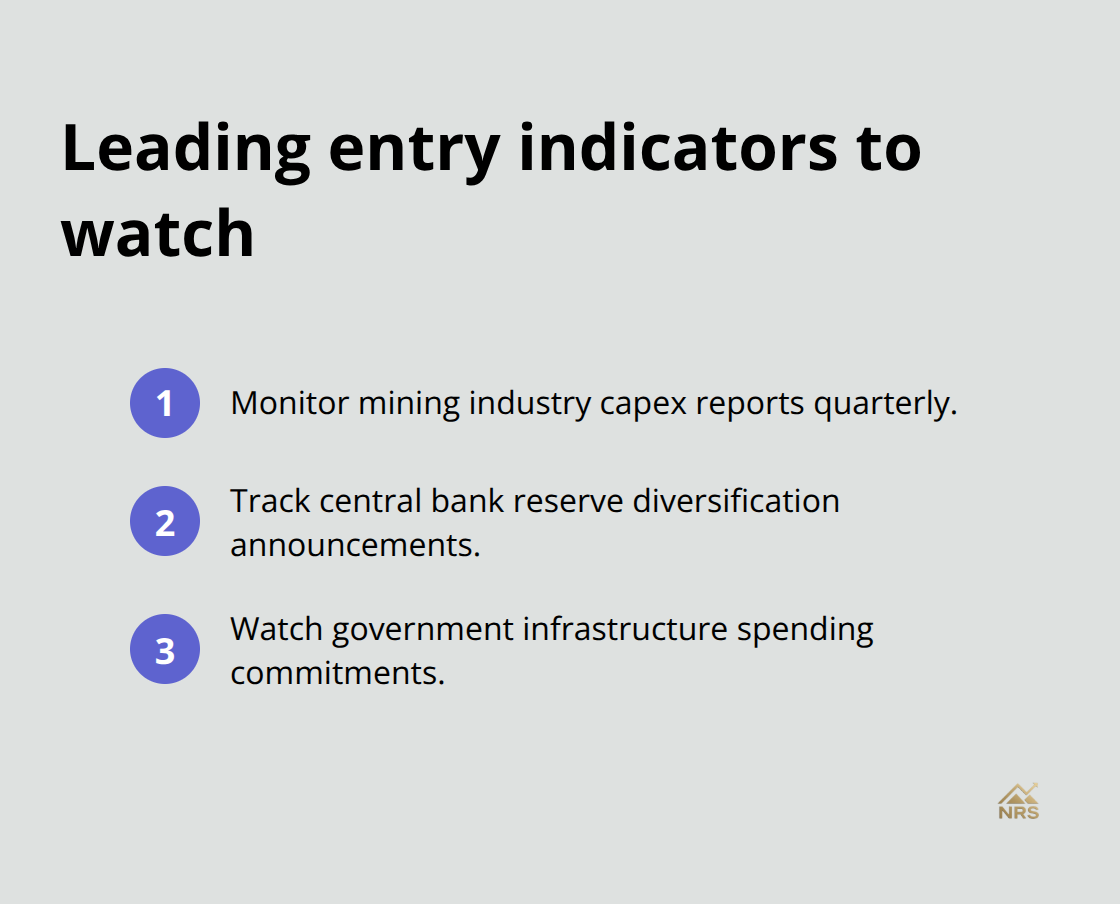
Monitor mining industry capex reports quarterly, track central bank reserve diversification announcements, and watch government infrastructure spending commitments. These indicators lead price moves by weeks or months, giving you actionable entry windows before the market reprices.
The Bloomberg Precious Metals Subindex gained over 40% from June through December 2025, but this rally reflected accumulating central bank purchases and geopolitical risk premiums that had been building for quarters. Investors who entered during the 2023-2024 consolidation phase captured substantially higher returns than those chasing the final 40% gain in late 2025.
Recognizing When to Exit Positions
Exit timing works inversely: when new supply capacity announcements accelerate, when capex budgets for exploration expand significantly, or when demand indicators weaken noticeably, those are your signals to reduce exposure. Supply responsiveness determines how long price floors remain elevated. Energy markets have roughly 108 million barrels per day of global production capacity, about 5% above current demand according to the U.S. Energy Information Administration, which gives the sector flexibility to expand rapidly. Metals behave differently-mining new capacity takes years, environmental permits face delays, and ore quality decline means higher costs. This inelasticity in metals supply means price floors remain elevated during downturns, while energy prices can collapse when demand weakens.
Watch for capex acceleration in mining regions where permitting has previously blocked expansion. When governments approve major new mining projects or when exploration budgets jump significantly, supply will eventually increase and prices will compress. Your practical action is to establish exit rules before you enter positions: reduce exposure when supply capacity utilization tightens materially or when new production announcements suggest the shortage will resolve within 18-24 months.
Abandoning Traditional Diversification Weights
Effective diversification across metals and energy requires abandoning proportional weighting in favor of structural conviction. The divergence in late 2025 where precious metals surged 40% while energy fell 11% demonstrates that sector performance no longer correlates. Overweight copper, lithium, and silver based on electrification demand and supply constraints from permitting delays and ore grade decline. Underweight or avoid oil exposure until global production capacity utilization tightens materially from the current 5% surplus according to the U.S. Energy Information Administration.
Gold serves as your portfolio stabilizer, particularly during geopolitical spikes and currency devaluation concerns, not as your primary growth driver. Central bank purchases supported gold throughout 2025, creating a structural demand floor, but this doesn’t mean gold will outperform metals with genuine supply shortages and industrial demand acceleration. This allocation directly contradicts traditional commodity diversification frameworks that weight sectors equally, but it aligns with how commodity cycles actually operate in 2026 where structural forces matter far more than statistical correlation assumptions.
Building Conviction-Based Allocations
Try a portfolio structure that reflects actual supply-demand dynamics rather than historical correlations. Allocate 40-50% to green metals with supply constraints (copper, lithium, nickel), 30-40% to precious metals for inflation and geopolitical hedging, and 10-20% to energy positioned only when specific supply disruption signals emerge. This weighting acknowledges that metals face genuine supply inelasticity while energy capacity can expand quickly. Your allocation should shift as cycle phases change-when energy supply tightens from geopolitical disruption or when metals supply suddenly increases from new capacity, rebalance accordingly.
The practical reality is that commodity sectors no longer move in lockstep. Understanding which sectors face genuine supply constraints versus those with excess capacity separates successful investors from those who chase outdated playbooks. Track the specific supply indicators for each commodity class rather than treating them as a unified asset category. Copper supply tightness operates independently from oil supply dynamics, and silver demand from solar installations follows different patterns than gold demand from central bank diversification.
Final Thoughts
Reading macroeconomic commodity cycles successfully requires abandoning the assumption that all commodities move together and instead tracking the specific supply-demand dynamics that drive each sector. Gold prices surged 55% year-over-year in Q4 2025 while copper faced supply deficits and energy weakened despite geopolitical tensions, proving that cycle phases operate independently across metals and energy. Your competitive advantage comes from recognizing these divergences early and positioning accordingly, not from reacting after prices have already moved.
Establish conviction-based allocations rather than proportional weights by overweighting green metals facing genuine supply constraints from permitting delays and ore grade decline, maintaining precious metals for inflation protection and geopolitical hedging, and staying selective on energy until production capacity utilization tightens from the current 5% surplus. This structure acknowledges that metals supply remains inelastic while energy capacity can expand quickly, creating fundamentally different risk profiles. Monitor government capex budgets in infrastructure and renewable energy, central bank reserve diversification announcements, and mining industry capex reports quarterly, as these indicators lead price moves by weeks or months and give you actionable entry windows before headlines confirm supply constraints.
Global macroeconomic shocks now account for more than two-thirds of variance in commodity price growth, with demand shocks contributing roughly 50% and supply shocks about 20%, meaning you must track GDP growth, policy decisions, and geopolitical risk alongside traditional commodity metrics. Commodity sectors no longer follow historical correlation patterns, so understanding which sectors face genuine supply constraints versus those with excess capacity separates successful investors from those chasing outdated playbooks. Natural Resource Stocks provides expert analysis on how macroeconomic commodity cycles reshape markets, helping you identify which sectors offer genuine opportunity.