
























The metals market outlook 2026 is shifting fast. Central banks are buying gold, green energy is driving silver demand, and rare earth elements are becoming geopolitical flashpoints.
We at Natural Resource Stocks break down what’s happening in each metal sector and what it means for your portfolio this year.
Gold Market Outlook: Price Drivers and Investment Opportunities
Central Banks Are Buying Gold at Scale
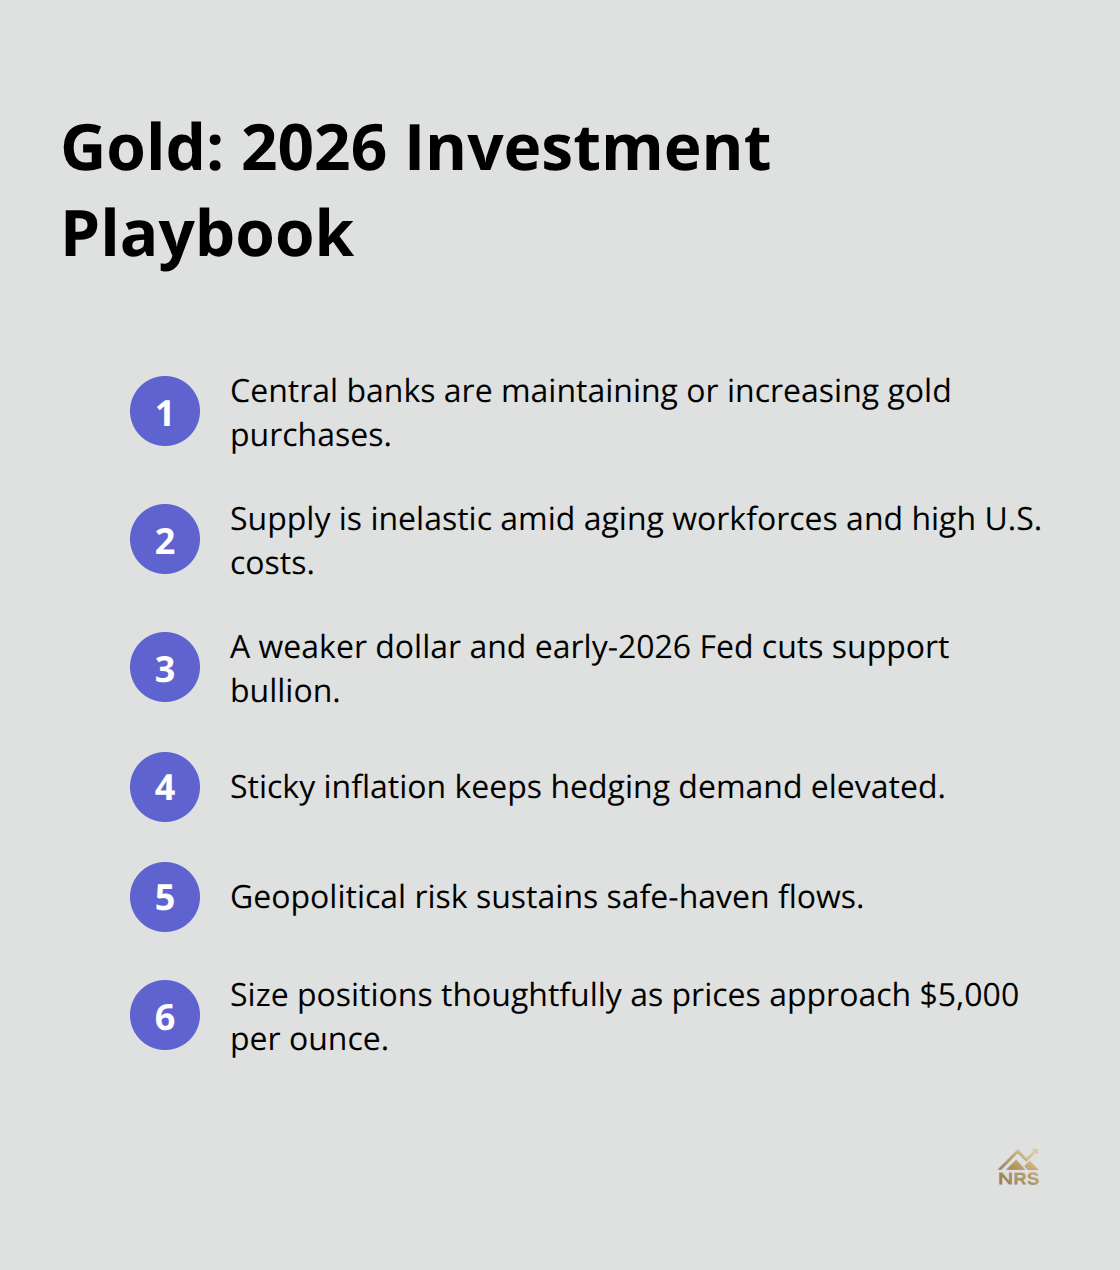
Central banks are not slowing down their gold purchases, and that matters more than most investors realize. J.P. Morgan forecasts gold will average around $4,753 per ounce in 2026 and finish the year near $5,000 per ounce, according to Natasha Kaneva, Head of Base and Precious Metals at J.P. Morgan. Central banks will maintain or increase their gold purchases through 2026 and 2027, providing direct structural support for prices. Governments view gold as the ultimate hedge against currency instability and debt concerns. Investor demand remains robust as well, with gold ownership expanding into 2026 and 2027. This dual demand from both official and private buyers creates a powerful floor under prices.
Supply Constraints Tighten the Market
Gold supply remains relatively inelastic, meaning mine output won’t spike just because prices rise. Copper grades have fallen roughly 40% since 1991, and US production costs run higher than major competitors, according to Deloitte Insights. Mining companies face aging workforces-more than half of the US mining workforce will retire by 2029, representing about 221,000 workers-while graduate pipelines sit at decade lows. These constraints mean gold supply will struggle to keep pace with demand, a dynamic that historically pushes prices higher. The supply-demand imbalance favors investors holding bullion.
Macroeconomic Tailwinds Support Gold Strength
The US dollar is expected to weaken in 2026, which typically supports non-dollar priced assets like gold, according to Meera Chandan, Co-Head Global FX Strategy at J.P. Morgan. Fabio Bassi, Head of Cross-Asset Research at J.P. Morgan, identifies three forces defining 2026: unaltered monetary policy in many regions, the ongoing AI supercycle, and increasing market polarization-collectively creating a favorable environment for gold as a portfolio ballast. The Federal Reserve will cut rates in early 2026, and a broader easing impulse will help risk sentiment and bullion demand. Sticky inflation persists despite policy easing, making gold’s role as an inflation hedge more valuable than ever.
Geopolitical Risk Reinforces Safe-Haven Demand
Persistent investor anxiety around debt sustainability and broader financial stability concerns reinforce gold’s safe-haven role into 2026. Geopolitical tensions add another layer of support for bullion prices. When markets face uncertainty, investors rotate into gold to protect their capital. This pattern has held across multiple market cycles and shows no signs of reversing in 2026.
What Investors Should Monitor
Track central bank gold purchases and Fed policy cues closely throughout 2026. Monitor the dollar trajectory in early 2026, as currency weakness typically correlates with gold strength. If you’re building a portfolio for 2026, gold exposure should be non-negotiable given the confluence of central bank demand, investor hedging flows, supply constraints, and macroeconomic tailwinds. With gold prices potentially reaching $5,000 per ounce by year-end, the question shifts from whether to own gold to how much exposure fits your risk profile-a decision that depends on your portfolio’s current allocation and your outlook for the broader metals complex.
Silver and Industrial Metals: Demand From Green Energy Transition
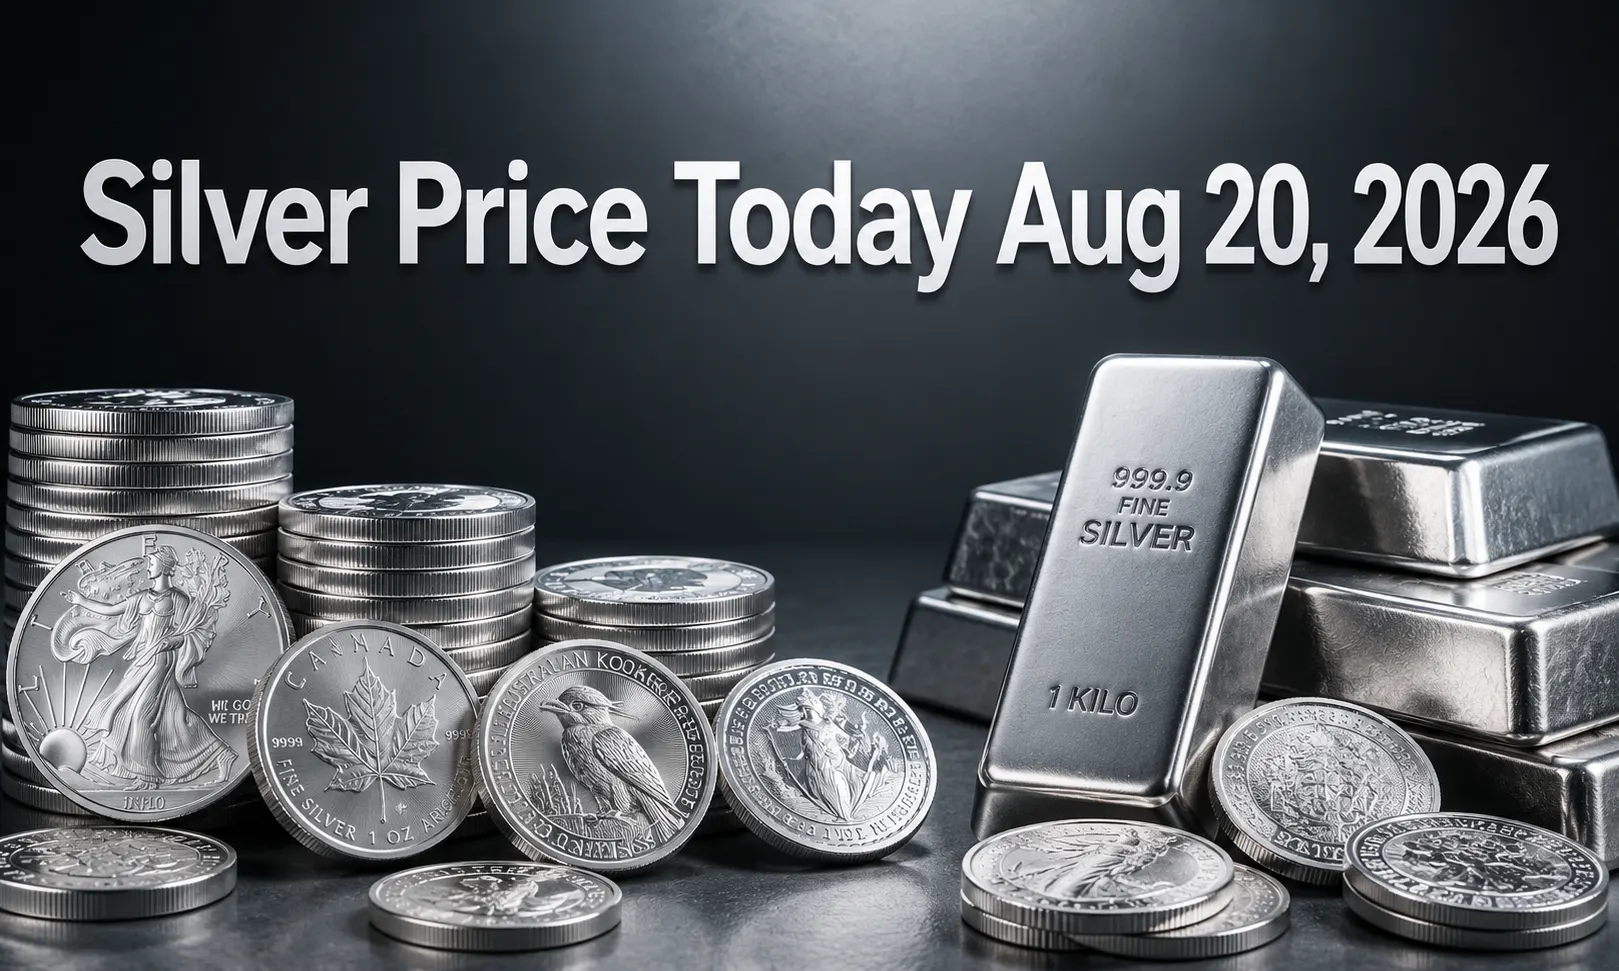
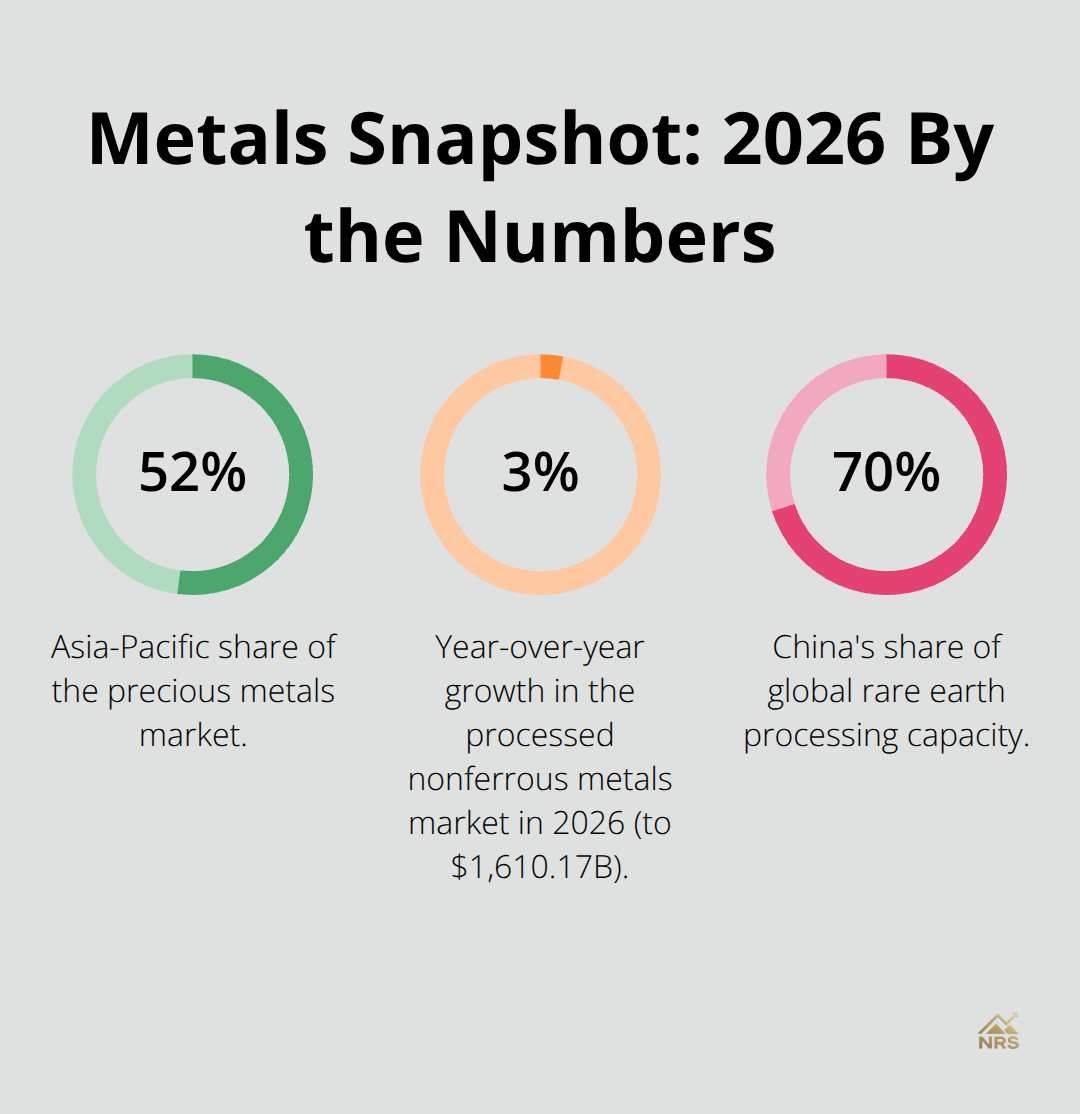
Silver demand splits into two distinct streams in 2026, and investors who recognize this division will position portfolios more effectively than those pursuing generic metals exposure. J.P. Morgan forecasts silver will average around $81 per ounce in 2026 and reach approximately $58 per ounce by Q4, according to Gregory Shearer, Head of Base and Precious Metals Strategy. This upside stems from two separate demand engines: industrial consumption tied to the energy transition and investment flows driven by safe-haven dynamics. Solar panel manufacturing consumes silver, and as global solar capacity additions accelerate to meet renewable targets, silver consumption from this sector alone will climb substantially. Battery production for electric vehicles and stationary energy storage similarly demands silver for solder and conductive adhesives, creating a structural bid for the metal that won’t disappear if macroeconomic conditions soften. The processed nonferrous metals market reached $1,562.78 billion in 2025 and is projected to hit $1,610.17 billion in 2026, a 3.0 percent year-over-year increase driven significantly by renewable energy infrastructure and EV supply chains. What separates silver from other industrial metals is its dual identity: industrial demand provides a floor while investment demand from inflation-conscious investors provides an upside catalyst. This means silver offers both downside protection and appreciation potential in 2026, making it substantially more attractive than single-purpose industrial metals.
Electric Vehicles Drive Direct Silver Consumption
Each EV contains roughly 40 to 50 grams of silver across connectors, switches, and conductive pastes in battery packs. As EV production targets climb globally and supply chains solidify, silver consumption will grow in tandem. This direct linkage between vehicle production and silver demand creates a measurable, transparent demand stream that investors can track through automotive industry reports and production announcements. The automotive sector’s commitment to electrification means silver demand from this channel will accelerate regardless of broader economic cycles.
Renewable Energy Infrastructure Anchors Industrial Demand
Renewable energy infrastructure-particularly solar installations and grid modernization projects-consumes silver in electrical contacts and conductive applications. Electronics and semiconductor manufacturing continue to absorb silver for circuit board fabrication and photovoltaic applications, with AI data center expansion adding marginal but meaningful incremental demand. Unlike rare earth elements or lithium, silver’s industrial applications are already proven and scaled, which means demand will materialize without waiting for speculative technology adoption to occur.
Geographic Diversification Reduces Concentration Risk
Asia-Pacific accounts for approximately 52 percent of the precious metals market and is the fastest-growing region, with China and India driving both industrial consumption and jewelry demand that supports baseline silver prices. North America is also highlighted as one of the fastest-growing regions, propelled by automotive and electronics manufacturing alongside increased mining and infrastructure activity. This geographic diversification of demand means silver benefits from growth across multiple regions rather than concentrating risk in a single market.
The infrastructure buildout required for the energy transition will span continents, which provides multiple demand centers that support silver prices through 2026 and beyond.
Rare Earth Elements Present the Next Supply Challenge
While silver addresses near-term energy transition needs, rare earth elements represent a more complex supply story that demands separate analysis. These materials power the magnets, catalysts, and specialized alloys that enable advanced technologies across defense, automotive, and renewable sectors.
Rare Earth Elements: Critical Supply Dynamics in 2026
China’s Processing Dominance Creates Strategic Vulnerability
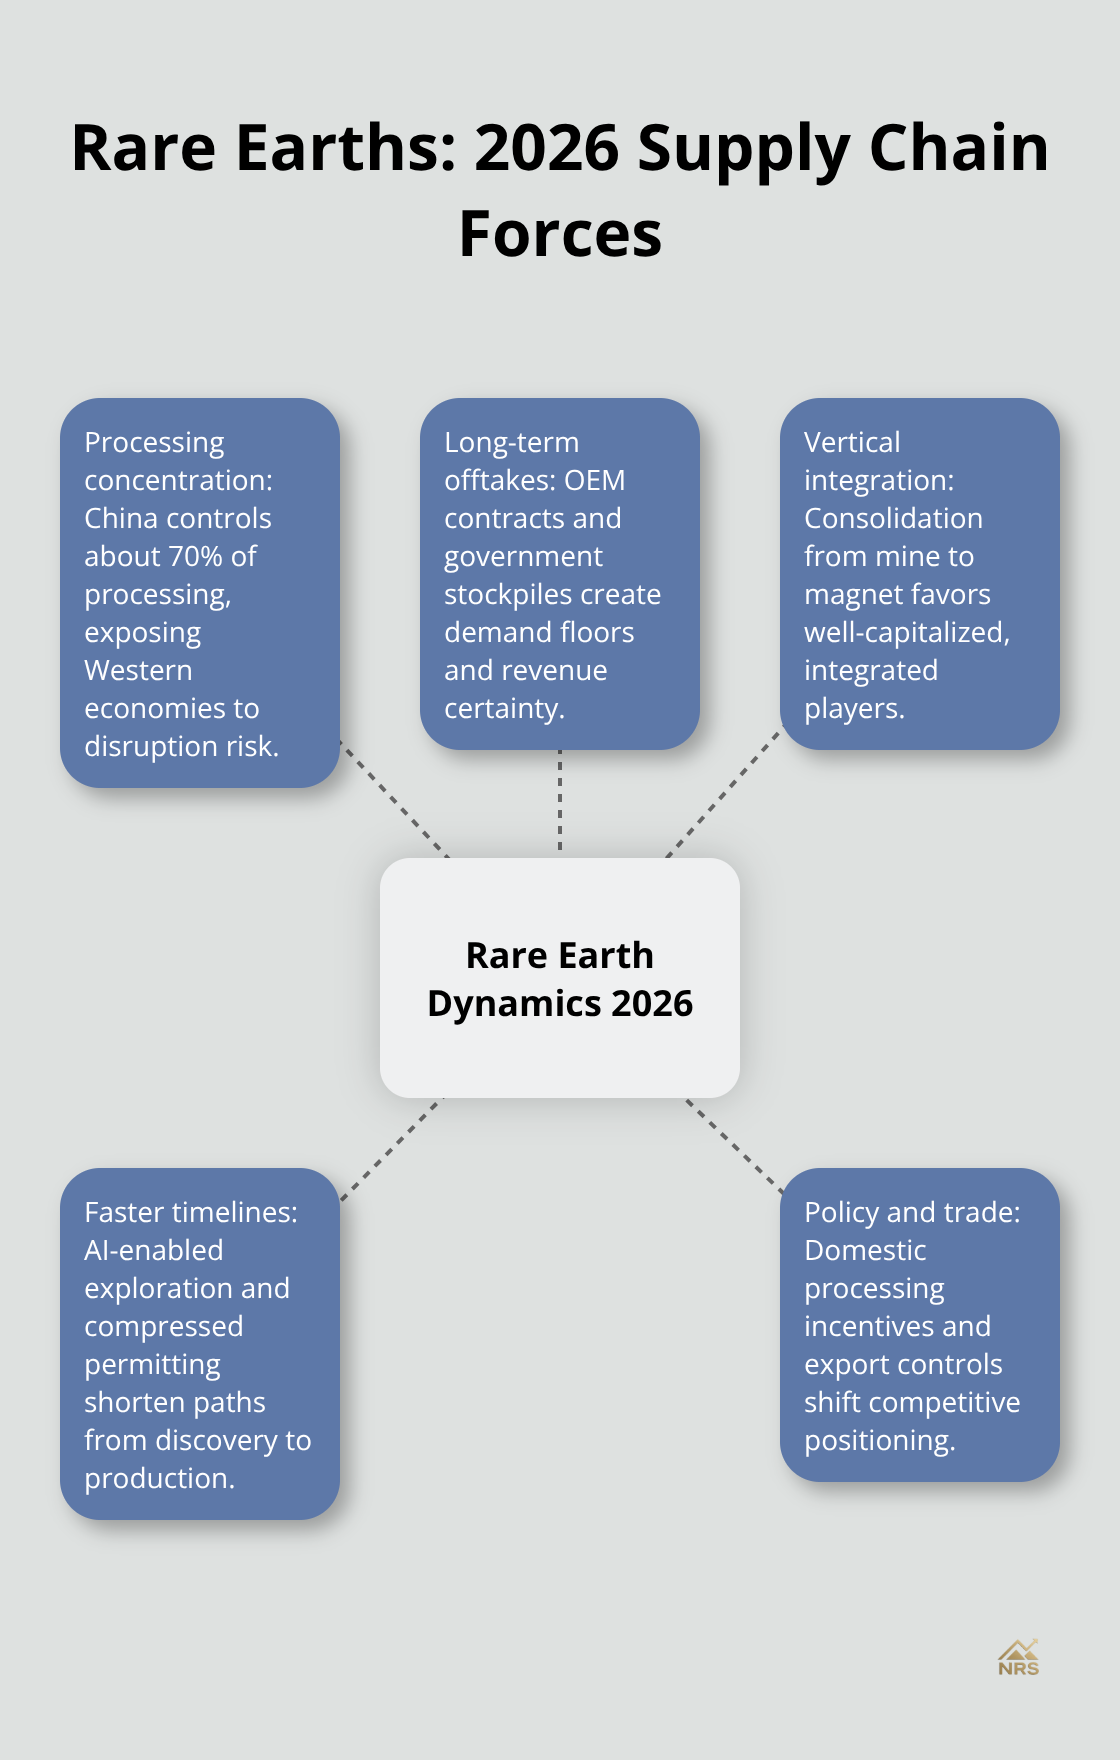
China controls roughly 70 percent of global rare earth processing capacity, a concentration that exposes Western economies to supply disruption risk if geopolitical tensions escalate. This structural imbalance means that even if mining capacity expands outside China, processing bottlenecks will persist unless Western nations invest heavily in downstream infrastructure. The US Department of the Interior and initiatives like Project Vault are accelerating domestic rare earth projects through compressed permitting timelines, with NEPA reviews now completing in approximately 28 days compared to historical multi-year cycles. This policy shift creates near-term bankability for projects with clear delivery paths and phased developments, fundamentally altering project economics for companies positioned to capitalize on faster approvals.
Long-Term Contracts Lock in Demand
OEMs across automotive, battery, magnet, technology, and aerospace sectors actively secure tier-2 and tier-3 supply chains through long-term contracts and joint ventures, signaling that demand for rare earth elements will remain structurally strong regardless of short-term price volatility. Government stockpiling programs and public procurement initiatives meaningfully impact project economics in 2026, essentially creating demand floors that support pricing for neodymium, dysprosium, and other critical rare earths tied to defense applications and renewable energy infrastructure. These contractual commitments provide revenue certainty that commodity-dependent peers lack, making them substantially more attractive to investors than speculative positions.
Vertical Integration Reshapes the Competitive Landscape
The rare earth value chain experiences accelerated venture-style deals and vertical integration linking upstream resources to downstream magnet and end-use production, which suggests consolidation will concentrate supply among fewer, better-capitalized players. This consolidation trend favors established miners with capital access over smaller explorers lacking financial resources to fund processing infrastructure. Companies that control both mining and processing assets will command premium valuations as supply chains prioritize reliability over cost optimization.
Technology Acceleration Shortens Project Timelines
AI-enabled exploration and remote sensing technologies improve efficiency and enable faster decision cycles, which means newer projects reach production faster than historical timelines allowed. This technological advantage compounds the impact of compressed permitting, creating a window where first-movers capture market share before competitors mobilize. Track which rare earth producers have locked in long-term contracts with automotive and defense manufacturers, as these agreements provide the revenue certainty that separates winners from losers in 2026.
Policy and Trade Measures Drive Competitive Positioning
Investors should monitor government policy announcements around domestic rare earth processing capacity and tariff structures, since geopolitical risk and export controls rapidly alter pricing baselines and competitive positioning for established miners versus emerging domestic producers. The processed nonferrous metals market projected $1,610.17 billion in 2026, with rare earth elements embedded throughout advanced manufacturing and energy-transition supply chains, ensuring demand persistence even if macroeconomic growth slows. Positioning in 2026 means favoring rare earth companies with clear offtake agreements, government backing, or proximity to US or allied processing infrastructure rather than speculating on commodity price appreciation alone.
Final Thoughts
The metals market outlook 2026 hinges on three converging forces that reshape how investors should position portfolios. Central bank demand anchors precious metals, industrial consumption from the energy transition drives base and battery metals, and geopolitical supply constraints elevate rare earth elements. Gold will likely reach $5,000 per ounce by year-end, supported by currency weakness and inflation persistence, while silver captures dual demand from solar manufacturing and EV production that positions it as both an industrial and investment asset.
Your 2026 positioning should reflect this sector-by-sector reality rather than treating metals as a monolithic asset class. Gold serves as portfolio ballast against macroeconomic uncertainty and debt concerns, while rare earth elements reward investors who identify companies with clear delivery paths and processing infrastructure over those betting on price appreciation alone. The processed nonferrous metals market will grow 3.0 percent year-over-year in 2026, driven by renewable energy infrastructure and EV supply chains that won’t reverse regardless of short-term economic cycles.
Watch Federal Reserve policy announcements and rate-cut timing closely, since monetary easing directly supports bullion demand, and monitor central bank gold purchases that provide the structural bid separating 2026 from previous commodity cycles. Follow government policy on domestic rare earth processing and tariff structures, as geopolitical risk rapidly reshapes competitive positioning for established miners. Explore expert analysis and market insights at Natural Resource Stocks to refine your positioning based on real-time macroeconomic developments and policy shifts that reshape metals pricing throughout the year.