





















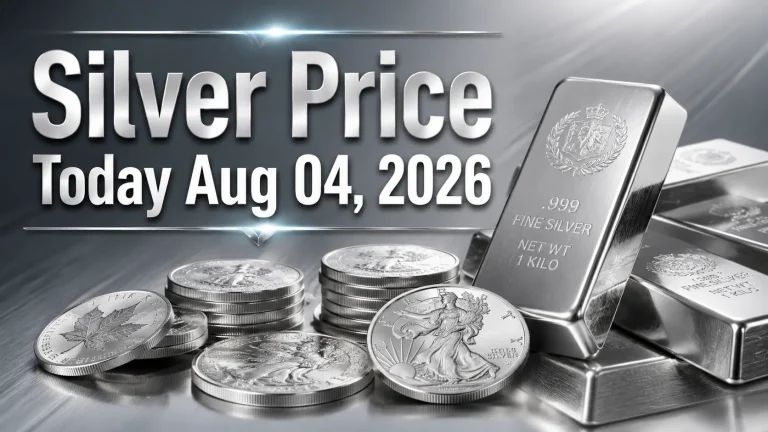
As of Aug 04, 2026, at 1:30 AM EDT, the live Silver spot price for 1 ounce of Silver in U.S. dollars (USD) is $59.67, 1 gram of Silver is $1.92, and 1 kilogram of Silver is $1,918.35. The silver spot price can fluctuate by the second, driven by investment supply and demand and other factors.
Silver Spot Prices
Silver Price | Price | Change |
Silver Price Per Ounce | $59.67 | +$1.08 |
Silver Price Per Gram | $1.92 | +$0.03 |
Silver Price Per Kilo | $1,918.35 | +$34.77 |
Live Metal Spot Prices (24 Hours) — Last Updated: 08/04/2026 at 1:30 AM EDT
Silver Price Today at a Glance – Aug 04, 2026
The current Silver price Aug 04 2026 sits at $59.67 per troy ounce, a gain of +$1.08 (+1.84%) against the prior session close of $58.59. That move puts silver back into the upper half of the tight consolidation band that has defined trade for the past several weeks, and it comes on the back of a geopolitical re-rating that has quietly reshaped the entire precious metals market heading into August.
Here is the full snapshot as of 12:41 AM EDT on August 4, 2026:
Metric | Value (as of 12:41 AM EDT, Aug 04, 2026) |
Silver spot price (USD/oz) | $59.67 |
Daily change | +$1.08 (+1.84%) |
Previous close | $58.59 |
Silver price per gram | $1.92 (+$0.03) |
Silver price per kilogram | $1,918.35 (+$34.77) |
Immediate support | $57.00 |
Immediate resistance | $59.50 |
200-period SMA | $61.39 |
RSI (14) | 49.21 – neutral |
52-week range | $36.96 – $121.79 |
Quick answer: The silver spot price per ounce Aug 04 2026 is $59.67 USD, up +$1.08 on the day. Silver is trading just under the $59.50 resistance shelf that has capped four separate rally attempts, with structural 2026 supply deficits underpinning the medium-term outlook.
For continuously refreshing quotes throughout the session, bookmark our live silver price chart and the wider commodities dashboard.
Silver Price Aug 04 2026 USD Per Ounce: Converting the Spot Price
Silver is quoted globally in U.S. dollars per troy ounce (31.1035 grams), not the standard avoirdupois ounce. That distinction matters when you are pricing physical bullion, scrap, or industrial lots. Using today’s silver price Aug 04 2026 usd per ounce of $59.67, here is what the metal costs across the units traders and buyers actually deal in:
Unit | Weight | Value at $59.67/oz (Aug 04, 2026, 12:41 AM EDT) |
1 troy ounce | 31.1035 g | $59.67 |
1 gram | 1 g | $1.92 |
10 grams | 10 g | $19.18 |
1 tola | 11.6638 g | $22.38 |
1 troy pound | 373.24 g | $716.04 |
100 oz bar | 3,110.35 g | $5,967.00 |
1 kilogram | 1,000 g | $1,918.35 |
1 metric tonne | 1,000,000 g | $1,918,350 |
Remember that the current silver spot price Aug 04 2026 is the benchmark for unfabricated metal only. Retail coins and bars trade at a premium over spot — typically 6% to 18% depending on product, mint, and dealer inventory — while refiners bid below spot for scrap.
Silver Price Drivers Aug 04 2026: What Is Actually Moving the Market
Four forces are dictating the silver price drivers Aug 04 2026 narrative. They pull in different directions, which is precisely why the metal has coiled rather than trended.
1. The U.S.–Iran Diplomatic Thaw Cut the Risk Premium — Then Handed It Back
The single biggest swing factor over the last week has been the headlines from the U.S.–Iran negotiating track. When a formal deal looked imminent, the market executed a textbook risk-on rotation out of precious metals: silver (XAG/USD) fell -1.68% to $56.69 while gold slipped -0.44% to $4,024. The logic was mechanical — a diplomatic breakthrough removes the geopolitical risk premium that has been embedded in commodity pricing since March 2026, and the Strait of Hormuz (roughly 21 million barrels a day, about 21% of global seaborne supply) stops being a tail-risk headline.
Then President Trump signalled that peace negotiations would resume rather than conclude, easing fears of a prolonged conflict without delivering the clean de-escalation bulls had priced. Silver rebounded hard, trading up 2.26% (+$1.306) to $59.163 in that session before settling into today’s $59.67 handle.
The takeaway for anyone tracking the silver price rally 2026 Aug precious metals market: this is a headline-driven tape. Analysts covering the file have been explicit that negotiations remain fragile, and that a collapse in talks would produce “an equally sharp reversal” — oil snapping back, and safe-haven bids returning to metals within hours.
2. Lower Oil, Softer Inflation Expectations, Softer Dollar
Cheaper crude has cut through to inflation expectations, and that has been a net positive for silver in an unusual way. Falling oil reduced the inflationary headwind that had been pressuring precious metals via the rate-expectations channel — when the market fears an oil-driven CPI spike, it prices more Fed tightening, and higher real yields are the classic enemy of a non-yielding asset like silver.
At the same time, a softer U.S. dollar has made dollar-denominated commodities cheaper for international buyers, adding a second layer of support beneath the silver spot price Aug 04 2026. Dollar weakness is one of the most reliable near-term correlations in the metals complex, and it is currently working in silver’s favour.
3. The Federal Reserve Held — But the Dissents Are Loud
The Federal Reserve’s decision to keep interest rates steady removed a major downside catalyst and provided technical support for the metal. The complication is the composition of the vote: dissenting members favoured rate increases, which caps how far silver can run on a dovish-Fed thesis alone.
That split is the reason silver has failed four times at $59.50 rather than breaking cleanly. Rate-hike uncertainty is a genuine ceiling on speculative positioning, even while the physical market tightens. Traders looking for the next leg of the move are watching Fed communications as closely as they are watching Tehran.
4. The Structural Deficit Is the Real Story
Strip out the headlines and one number dominates the medium-term case. The silver market is projected to run a deficit of roughly 46 million ounces in 2026 — the sixth consecutive year of undersupply.
That is not a cyclical wobble; it is a structural imbalance. Above-ground inventories have been drawn down year after year to plug the gap, and each successive deficit year makes the buffer thinner. Industrial demand — solar photovoltaics, electrification, electronics, brazing alloys — is inelastic in the short run, and mine supply cannot respond quickly because roughly 70% of silver comes out of the ground as a by-product of copper, lead, zinc, and gold operations. Silver miners do not simply drill more when the price rises.
For long-horizon investors, that deficit is the floor beneath every pullback. For a broader look at how these dynamics interact across the complex, see our analysis of gold and silver trends and our recurring breakdown of key market drivers moving gold and silver.
Silver Technical Outlook: A $2.50 Range Waiting to Break
Technically, silver is in one of the cleanest coiling patterns of the year. The metal has been compressing inside a $57.00–$59.50 band, a $2.50-wide range, and the structure is roughly 80% complete by the standard measure of consolidation maturity.
Key levels as of Aug 04, 2026:
Level | Price | Significance |
Macro low | $55.00 | Second downside target on a breakdown |
Range floor / major support | $57.00 | Defended on three separate bounces |
No-trade zone | $58.00 – $59.00 | Chop territory; analysts advise avoiding |
Range ceiling / major resistance | $59.50 | Rejected four times |
200-period SMA | $61.39 | First upside objective on a confirmed breakout |
Momentum readings are conspicuously flat, which is exactly what you expect at the end of a consolidation:
- RSI (14): 49.21 — dead-centre neutral, no directional bias
- MACD: hovering near zero — momentum stalled
- ADX: below 20 — trend strength is weak
- Ichimoku: price sits just beneath the cloud, a mildly bearish overhead structure
A doji candle printed on August 3 right at resistance, signalling genuine indecision at the top of the range. Declining volume through the pattern raises the risk of a whipsaw trap — a false break that reverses before follow-through arrives.
The playbook analysts are running:
- Bullish trigger: a volume-confirmed close above $59.50 opens $61.40 (the 200 SMA) as the first meaningful objective.
- Bearish trigger: a break below $57.00 targets $55.00, the macro low.
- In between: patience. The $58.00–$59.00 pocket is explicitly flagged as a no-trade zone, and the consensus recommendation is to wait for volume confirmation before committing capital in either direction.
At $59.67, silver has poked its head above the range ceiling — but until volume confirms, this remains a test, not a breakout.
Silver Price Rally 2026 Aug: Precious Metals Market Context
Zoom out and the 2026 tape has been extraordinary. Silver’s 52-week range spans $36.96 to $121.79, with a one-year change that has run into triple digits at points. The metal blew through historic highs earlier in the year, then retraced violently — which is why the current $57–$60 zone, extreme by any pre-2026 standard, now reads as a consolidation shelf rather than a spike.
The silver price rally 2026 Aug precious metals market setup has three legs:
- Monetary: a Fed on hold with a divided committee, a softening dollar, and real yields that have stopped rising.
- Geopolitical: an Iran negotiation that can add or subtract several dollars of risk premium on a single headline.
- Physical: a sixth straight annual deficit that no amount of paper positioning can wish away.
Gold is telling a compatible story at roughly $4,024/oz. The gold-to-silver ratio at current levels sits near 67:1 — historically rich compared to silver’s long-run average, but dramatically compressed versus the 90:1-plus readings seen in earlier cycles. Ratio compression is a classic marker of silver outperformance, and it is one of the reasons allocators have been rotating from gold into silver on pullbacks. Track the counterpart move on our live gold price chart and the latest gold price today update.
What to Watch Next
Between now and the next session, these are the catalysts most likely to move the current silver price Aug 04 2026 off its current handle:
- U.S.–Iran negotiation headlines. Fragile talks. A collapse sends safe-haven bids straight back into metals; a signed framework knocks the risk premium out again.
- Fed speakers and inflation prints. With the committee split, every hawkish comment tightens the ceiling on silver.
- The dollar index. Continued softness is a tailwind; a reversal caps the rally quickly.
- Volume at $59.50. The single most important technical tell. A high-volume close above it changes the character of the market; a low-volume poke does not.
- Industrial demand data. Solar installation and electronics order data feed directly into the deficit math.
Frequently Asked Questions
What is the silver spot price today, Aug 04 2026?
The silver spot price Aug 04 2026 is $59.67 per troy ounce, up +$1.08 on the session, as of 12:41 AM EDT. Per gram it is $1.92, and per kilogram it is $1,918.35.
What is the silver price Aug 04 2026 in USD per ounce?
$59.67 USD per troy ounce. The silver price Aug 04 2026 usd per ounce reflects a +1.84% gain over the prior close of $58.59.
Why is silver rising today?
The main silver price drivers Aug 04 2026 are the easing of U.S.–Iran conflict fears after President Trump signalled negotiations would resume, lower oil prices reducing inflationary headwinds, a softer U.S. dollar, and the Federal Reserve holding rates steady. Underpinning it all is a projected 46-million-ounce supply deficit for 2026.
What are silver’s key support and resistance levels right now?
Support sits at $57.00 (three confirmed bounces) with a macro floor at $55.00. Resistance is $59.50 (four rejections), with the 200-period SMA at $61.39 as the next upside target.
Is the current silver spot price Aug 04 2026 a good entry point?
Silver is mid-range with RSI at 49.21 and ADX below 20 — a neutral, low-conviction technical setup. Analysts covering the pattern advise avoiding the $58.00–$59.00 “no-trade zone” and waiting for volume confirmation of a break above $59.50 or below $57.00. This is market commentary, not investment advice; do your own research and consider your risk tolerance.
How is the silver price per gram and per kilo calculated?
Divide the spot price per troy ounce by 31.1035 to get the gram price ($59.67 ÷ 31.1035 = $1.92). Multiply the gram price by 1,000 for the kilo price ($1,918.35).
Why does silver move more sharply than gold?
Silver is a smaller, less liquid market with a substantial industrial demand component — roughly half of annual consumption. That combination of thin liquidity and cyclical demand makes silver structurally more volatile in both directions, which is why it typically outperforms gold in metals bull markets and underperforms in risk-off deleveraging.
Bottom Line
The current silver price Aug 04 2026 of $59.67 per ounce (+$1.08, +1.84%) as of 12:41 AM EDT captures a market caught between two clocks. In the short run, silver is a headline-trading instrument tied to Iran diplomacy, Fed rhetoric, and the dollar. In the long run, a sixth consecutive annual supply deficit — 46 million ounces in 2026 alone — is quietly removing the metal’s inventory cushion.
The $57.00–$59.50 range has held for weeks and is now roughly 80% through its typical lifespan. Something gives soon. Whether it resolves toward $61.39 or back to $55.00 will likely be decided by a headline rather than a chart — but the chart will tell you the moment it happens.
Follow the tape in real time on our silver price chart, compare against yesterday’s silver update, and browse all metal charts for the full complex.