
























Gold prices are moving in response to major shifts in interest rates, geopolitical instability, and currency movements. At Natural Resource Stocks, we’re tracking the gold market trends 2026 that matter most to active traders.
This guide breaks down the forces driving gold valuations, examines supply and demand dynamics, and outlines practical strategies for positioning your portfolio. Whether you’re considering physical gold, ETFs, or mining stocks, understanding these trends is essential for making informed decisions this year.
What’s Moving Gold Prices Right Now
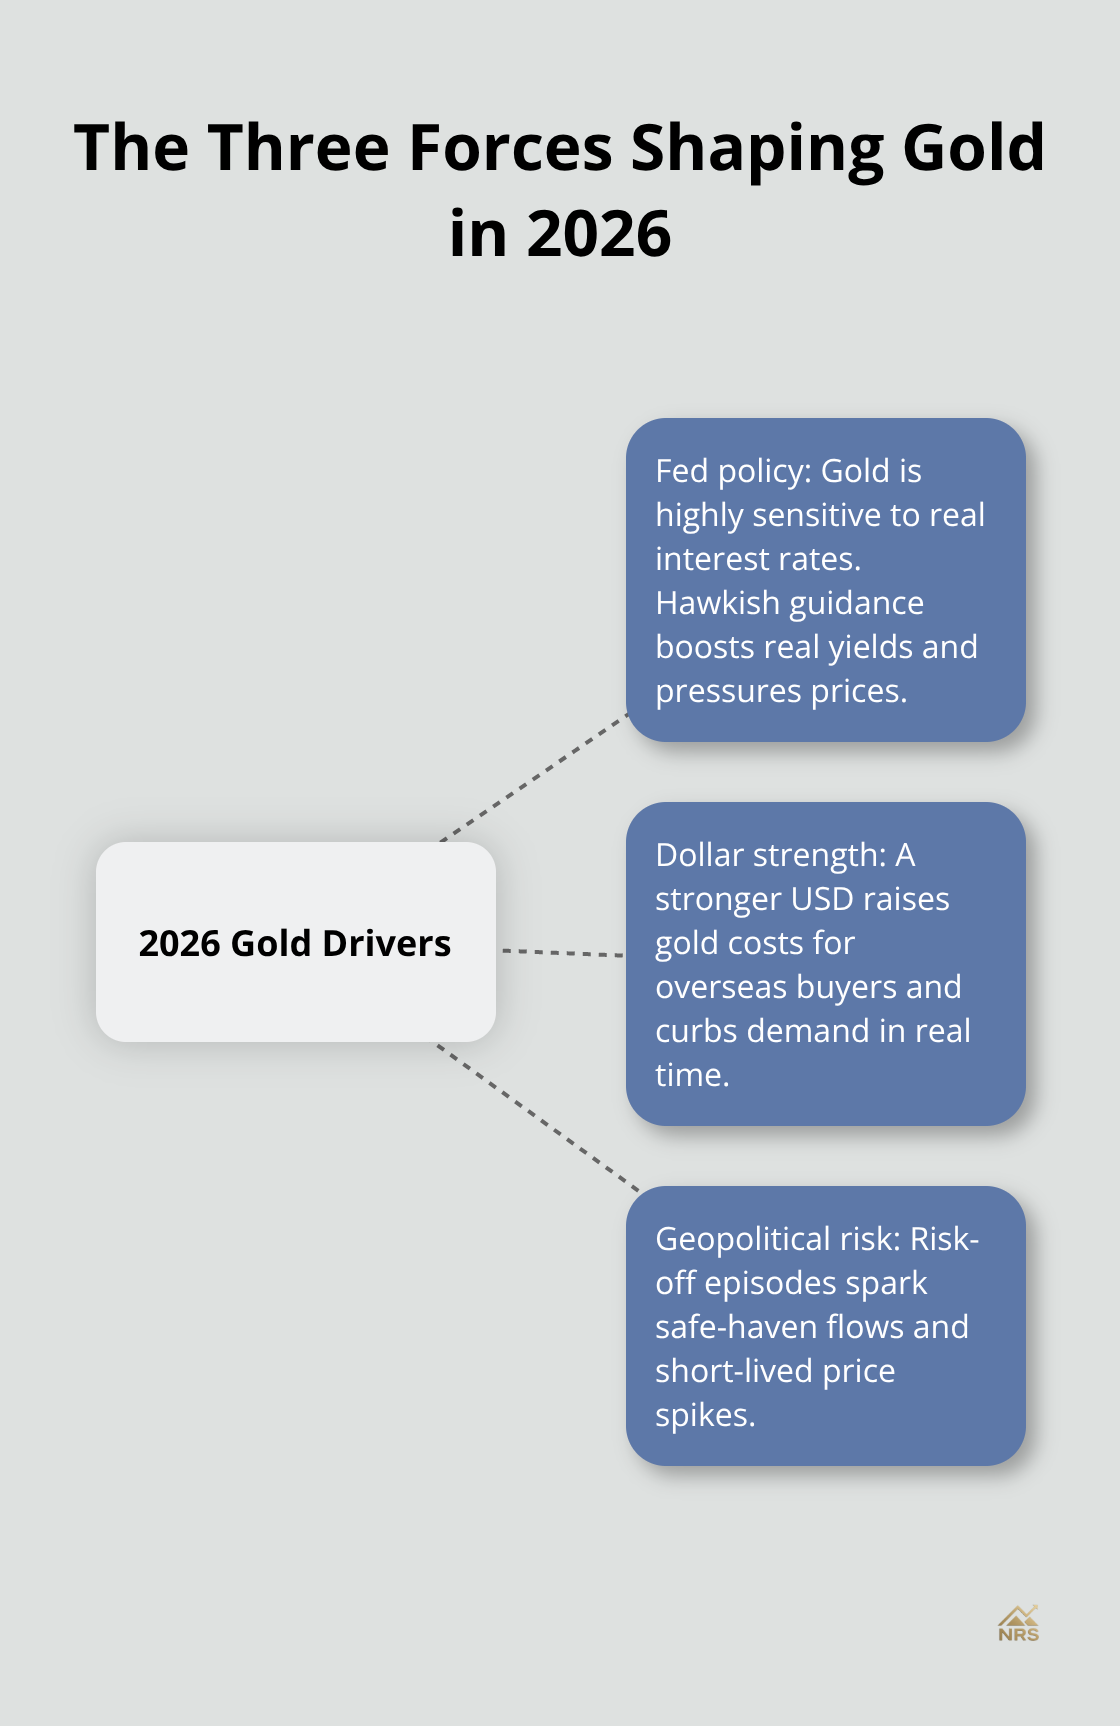
The Federal Reserve’s stance on interest rates stands as the single most important factor determining gold’s direction in 2026. On June 19, 2026, the Fed left rates unchanged but signaled a hawkish outlook, with 9 of 19 policymakers expecting at least one rate hike this year. Markets currently price roughly a 70% chance of a Fed rate hike by September. This matters because gold produces no yield, making it extremely sensitive to real interest rates. When the Fed signals higher rates, the opportunity cost of holding gold rises immediately-and that’s exactly what happened.
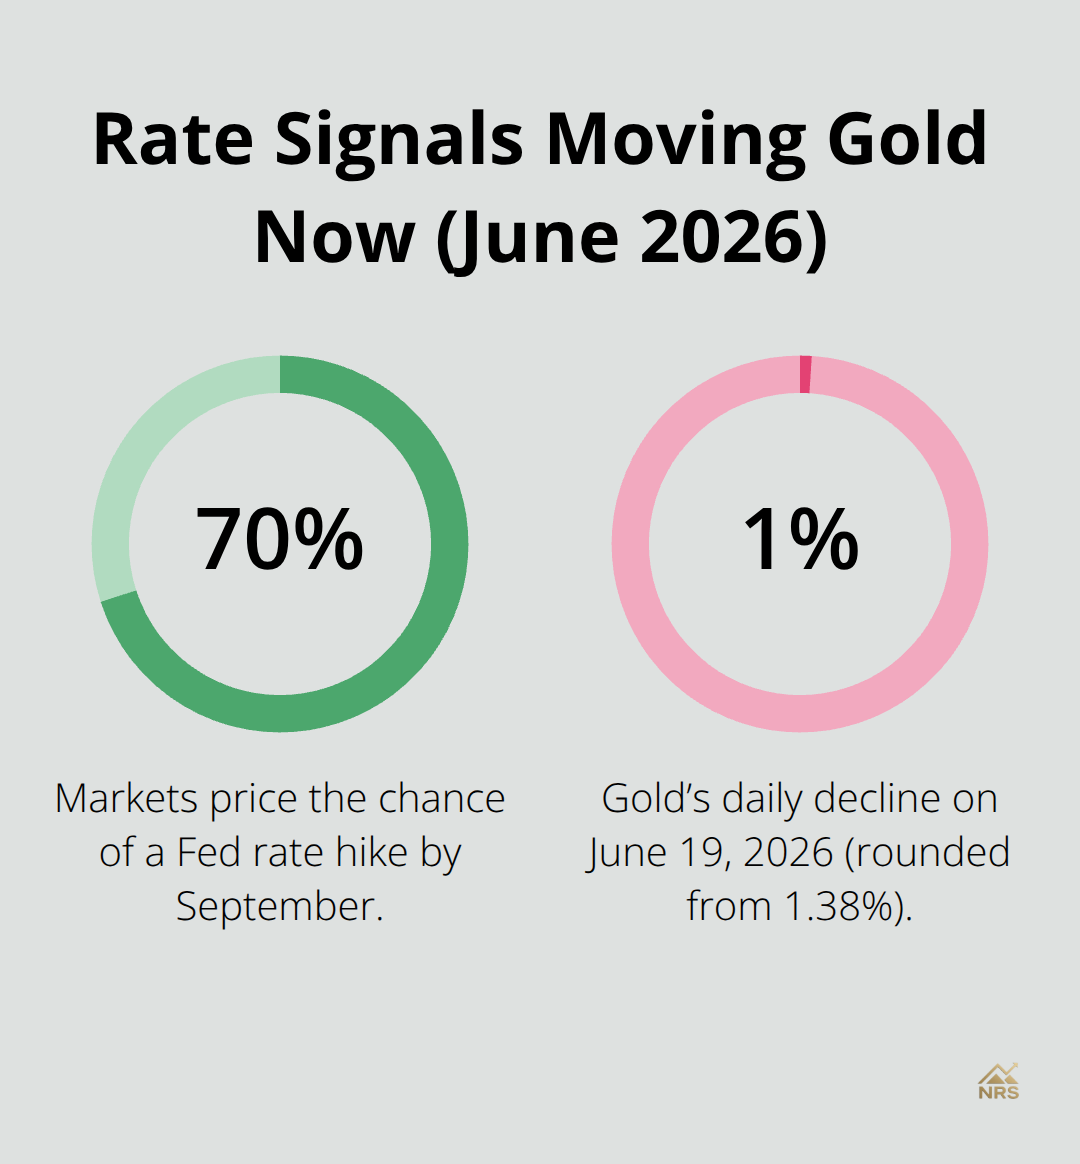
Gold fell to 4,151.74 USD per troy ounce on June 19, down 1.38% that day. Goldman Sachs lowered its year-end forecast to 4,900 USD/oz from 5,400, reflecting this hawkish tilt. If you trade gold in 2026, stop tracking nominal price targets and start monitoring Fed speakers’ language and rate-hike probability shifts. The real yield on US Treasuries serves as your leading indicator. When real yields rise, gold weakens. When real yields fall, gold strengthens.
The Dollar Crushes Gold Valuations
The US dollar’s strength acts as the second major headwind. Gold traded down 8.52% over the past month largely because the dollar index (DXY) rose to about 100.85, a one-year high. A stronger dollar makes gold more expensive for international buyers, which reduces demand. This happens in real time-it’s not theoretical. The dollar’s strength reflects expectations of higher US rates relative to other central banks, which ties directly back to Fed policy. Your practical move: align your gold positions with the Fed cycle and USD trajectory. Try buying opportunities near 4,100–4,200 if the dollar stays strong, but only with tight risk controls. Don’t fight the dollar trend.
Geopolitical Risk Provides Counterweight
Geopolitical tensions offer the only meaningful counterweight to rising US rates. Iran–Israel–US tensions remain elevated, and a World Gold Council analysis shows that tail-risk events are rising in frequency. When risk-off episodes occur, gold spikes as investors seek safe havens. Gold’s all-time high this year was 5,608.35 USD per troy ounce in January 2026, driven largely by geopolitical uncertainty. The problem is that geopolitical premium proves unstable-it can evaporate quickly if tensions ease.
Central Banks Support Gold From Below
Central bank reserve diversification also supports gold in the background. China imported about 317 tonnes in Q1 2026, and the People’s Bank of China lifted official purchases to 8 tonnes in April, diversifying reserves away from dollars. Emerging market central banks hold gold reserves well below those of advanced economies, so any policy shift toward reserve rebalancing could provide structural support. Watch central bank activity closely-it acts as a floor under prices during downturns but not as a reliable rally driver.
These three forces-Fed policy, dollar strength, and geopolitical risk-create the trading environment for 2026. Understanding how they interact helps you position ahead of supply and demand shifts that will shape gold’s path forward.
Supply and Demand Dynamics Shaping Gold’s 2026 Path
Mining Production Sets the Baseline
Mining output remains relatively stable globally, but supply constraints matter less than demand shifts in 2026. China, Australia, the United States, South Africa, Russia, Peru, and Indonesia produce the bulk of the world’s gold, yet their combined output cannot respond quickly to price spikes. Gold mining takes years to ramp up, so production acts as a baseline rather than a price driver. What matters far more is where gold flows after extraction-jewelry consumption, investment demand, or industrial use. This split between jewelry and investment demand creates the real trading opportunity.
Investment Demand Overwhelms Mining Output
Investment demand surges during geopolitical risk or currency weakness, spiking prices regardless of mining output. Global gold ETFs attracted approximately 77 billion dollars in inflows during 2025, adding over 700 tonnes to holdings. This institutional momentum shapes near-term price action far more than mining production levels. When jewelry demand weakens due to economic slowdowns in key markets like India or China, total demand falls even if central banks buy aggressively. The World Gold Council’s quarterly reports track these flows, and you should monitor them closely.
Central Banks Create Structural Price Support
Central bank reserve accumulation acts as the structural floor under gold prices. China’s central bank purchased 8 tonnes in April 2026 alone, continuing a diversification strategy away from dollar-denominated assets. Emerging market central banks hold gold reserves substantially below those of advanced economies, meaning they have room to buy without creating supply shocks. The World Gold Council estimates central bank purchases averaged around 225 tonnes per quarter from 2021 to 2025, though 2026 activity cooled to about 16 tonnes in Q1 after Turkey sold 60 tonnes. This volatility proves the point: central bank flows swing sharply and create unpredictable support or resistance.
Retail Demand Responds to Uncertainty
Retail investors seeking physical gold bars and coins add another layer of demand that rises during uncertainty. When dollar weakness combines with inflation fears, retail buyers enter the market within days, not weeks. Monitor central bank reserve changes through official announcements and the World Gold Council’s quarterly reports. When official purchases accelerate, gold finds support near recent lows. Conversely, when central banks pause buying, expect downside pressure unless investment demand compensates.
The Real Trading Opportunity Emerges From Demand Cycles
Jewelry demand remains price-sensitive while central bank and investment demand operate on different cycles. A slowdown in Indian jewelry consumption during high-price periods coincides with institutional buying during geopolitical stress, creating trading ranges rather than sustained rallies or crashes. Understanding these overlapping demand patterns positions you to recognize when supply tightness actually matters versus when demand shifts dominate price action. This distinction becomes critical as you evaluate which investment vehicles-physical gold, ETFs, or mining stocks-align with your 2026 strategy.
How to Position Gold Investments Across Asset Classes
Physical gold, ETFs, and mining stocks each respond differently to the 2026 trading environment. Physical gold offers direct ownership and acts as a true inflation hedge, but storage costs run 0.5% to 1% annually and create security burdens. Gold ETFs eliminate storage hassles and let you trade within minutes, making them ideal for capturing short-term moves driven by Fed policy shifts or geopolitical spikes. The challenge is that ETF premiums can widen during volatile markets, occasionally pushing your entry costs higher than spot prices warrant. Mining stocks amplify gold’s upside during rallies but magnify losses during downturns because operational leverage compounds price moves. If gold rises 10%, quality miners might gain 15% to 20%, but if gold falls 10%, expect 15% to 20% declines in mining equities.
Allocate Your Gold Exposure Strategically
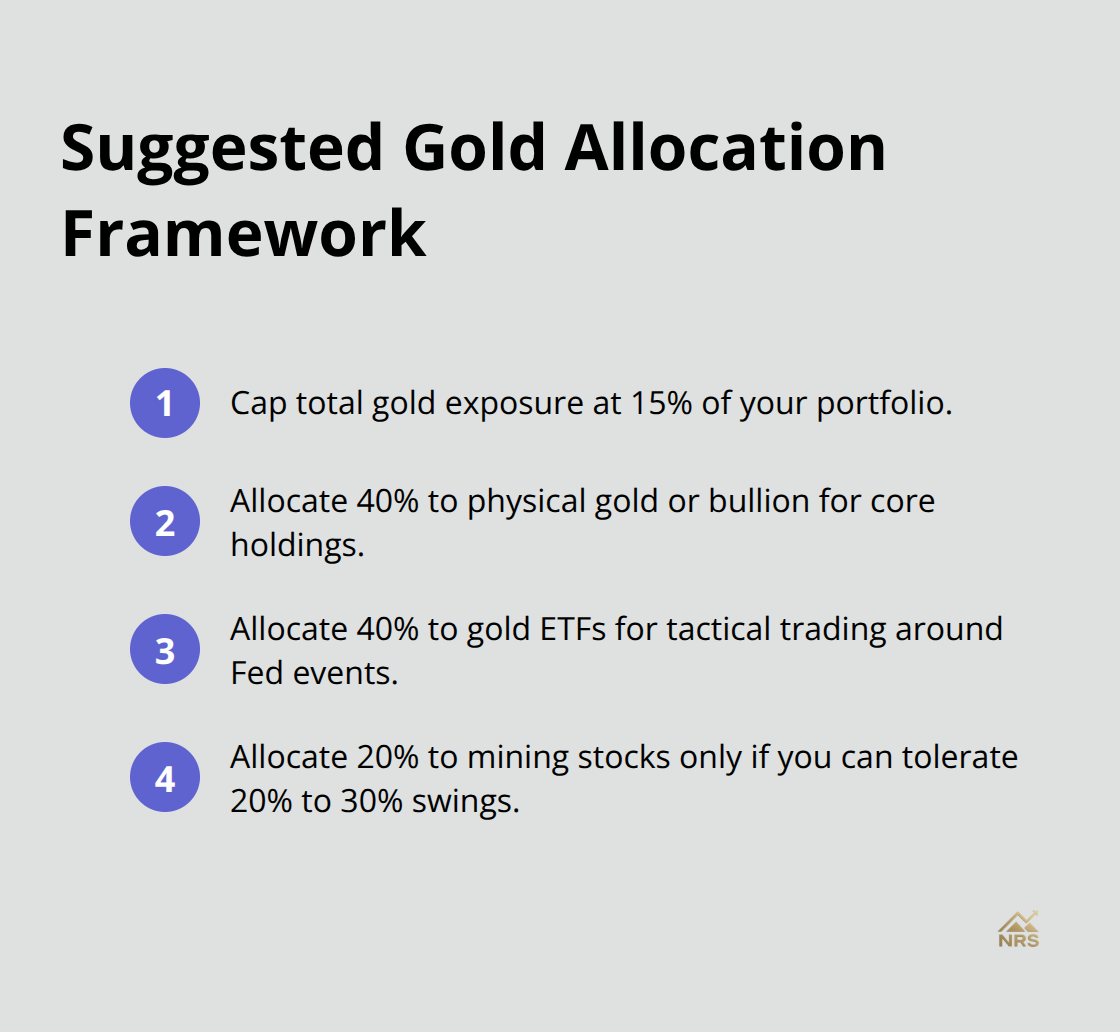
Morningstar recommends capping gold exposure at 15% of your total portfolio to avoid overweighting a non-yielding asset. This means a 1 million dollar portfolio should hold no more than 150,000 dollars across all gold vehicles combined. A practical split allocates 40% into physical gold or bullion for core holdings, 40% into gold ETFs for tactical trading around Fed decision dates and technical levels, and 20% into mining stocks only if you can tolerate 20% to 30% swings.
This structure lets you maintain a strategic position while capturing tactical opportunities without excessive concentration risk.
Execute Entry and Exit Discipline
Your entry and exit discipline matters far more than which vehicle you choose. Gold currently trades near 4,100 to 4,200 USD per ounce after falling from January’s 5,608 high, with the 200-day moving average sitting around 4,340. Technical traders should view 4,100 to 4,200 as a buy zone if the dollar remains strong, since this range represents solid support before deeper weakness. Set stop-losses at 3,950, which provides a 3% cushion below current support without trapping you in a failed position. For exits, take profits at the 50-day moving average near 4,730 if you’re trading a short-term bounce, or hold core positions until either the Fed signals rate cuts or geopolitical tensions escalate sharply.
Separate Core and Tactical Positions
Establish your core 15% allocation once, then use a separate 5% tactical allocation for trading around Fed meetings and dollar index extremes. When the DXY breaks above 101, gold weakness typically accelerates, so reduce tactical positions. When the DXY drops below 100, geopolitical premium tends to expand, making tactical gold long positions more attractive. Monitor central bank announcements monthly through official reports, since shifts in official purchasing patterns can shift the entire price floor upward or downward by 2% to 3% within weeks. This disciplined split between core and tactical positioning prevents emotional overtrading while preserving your ability to capitalize on the overlapping demand cycles and policy shifts that dominate 2026’s gold market.
Final Thoughts
Gold market trends in 2026 boil down to three competing forces: Fed policy tightening, dollar strength, and geopolitical risk. The first two currently dominate, pushing prices lower despite gold’s 23% gain over the past year. The third remains a wildcard that can reverse sentiment within days, so you must recognize which force shifts at any given moment rather than predict which one wins long-term. Structural support from central bank reserve diversification and institutional ETF demand provides a floor near 4,100 to 4,200 USD per ounce, yet this support evaporates if the Fed hikes rates faster than markets currently expect.
Your practical path forward involves discipline over conviction. Maintain your 15% core gold allocation as portfolio insurance against currency devaluation or geopolitical escalation, then use a separate 5% tactical allocation to trade around Fed meetings and dollar index extremes. Monitor central bank activity monthly and adjust positions when official purchases accelerate or pause, setting entry points near technical support levels and exiting at resistance without waiting for perfect confirmation. The risks cut both ways: a sustained Fed hiking cycle could push gold toward 3,800 to 4,000 USD/oz, while a synchronized global slowdown or major geopolitical event could trigger a 15% to 30% rally within weeks.
At Natural Resource Stocks, we track the gold market trends 2026 and provide the analysis you need to position ahead of major shifts. Visit our platform for real-time market analysis and community insights that sharpen your trading edge in this year’s volatile gold market.