

























Commodity prices don’t move randomly. They follow patterns shaped by economic cycles, policy shifts, and supply constraints that repeat across decades.
At Natural Resource Stocks, we’ve built this guide to help you read the macro commodity cycle and position ahead of major price moves. You’ll learn which signals matter most and which tools separate successful timing from costly guesses.
What Drives Commodity Price Cycles
Four Structural Forces Reshaping Demand
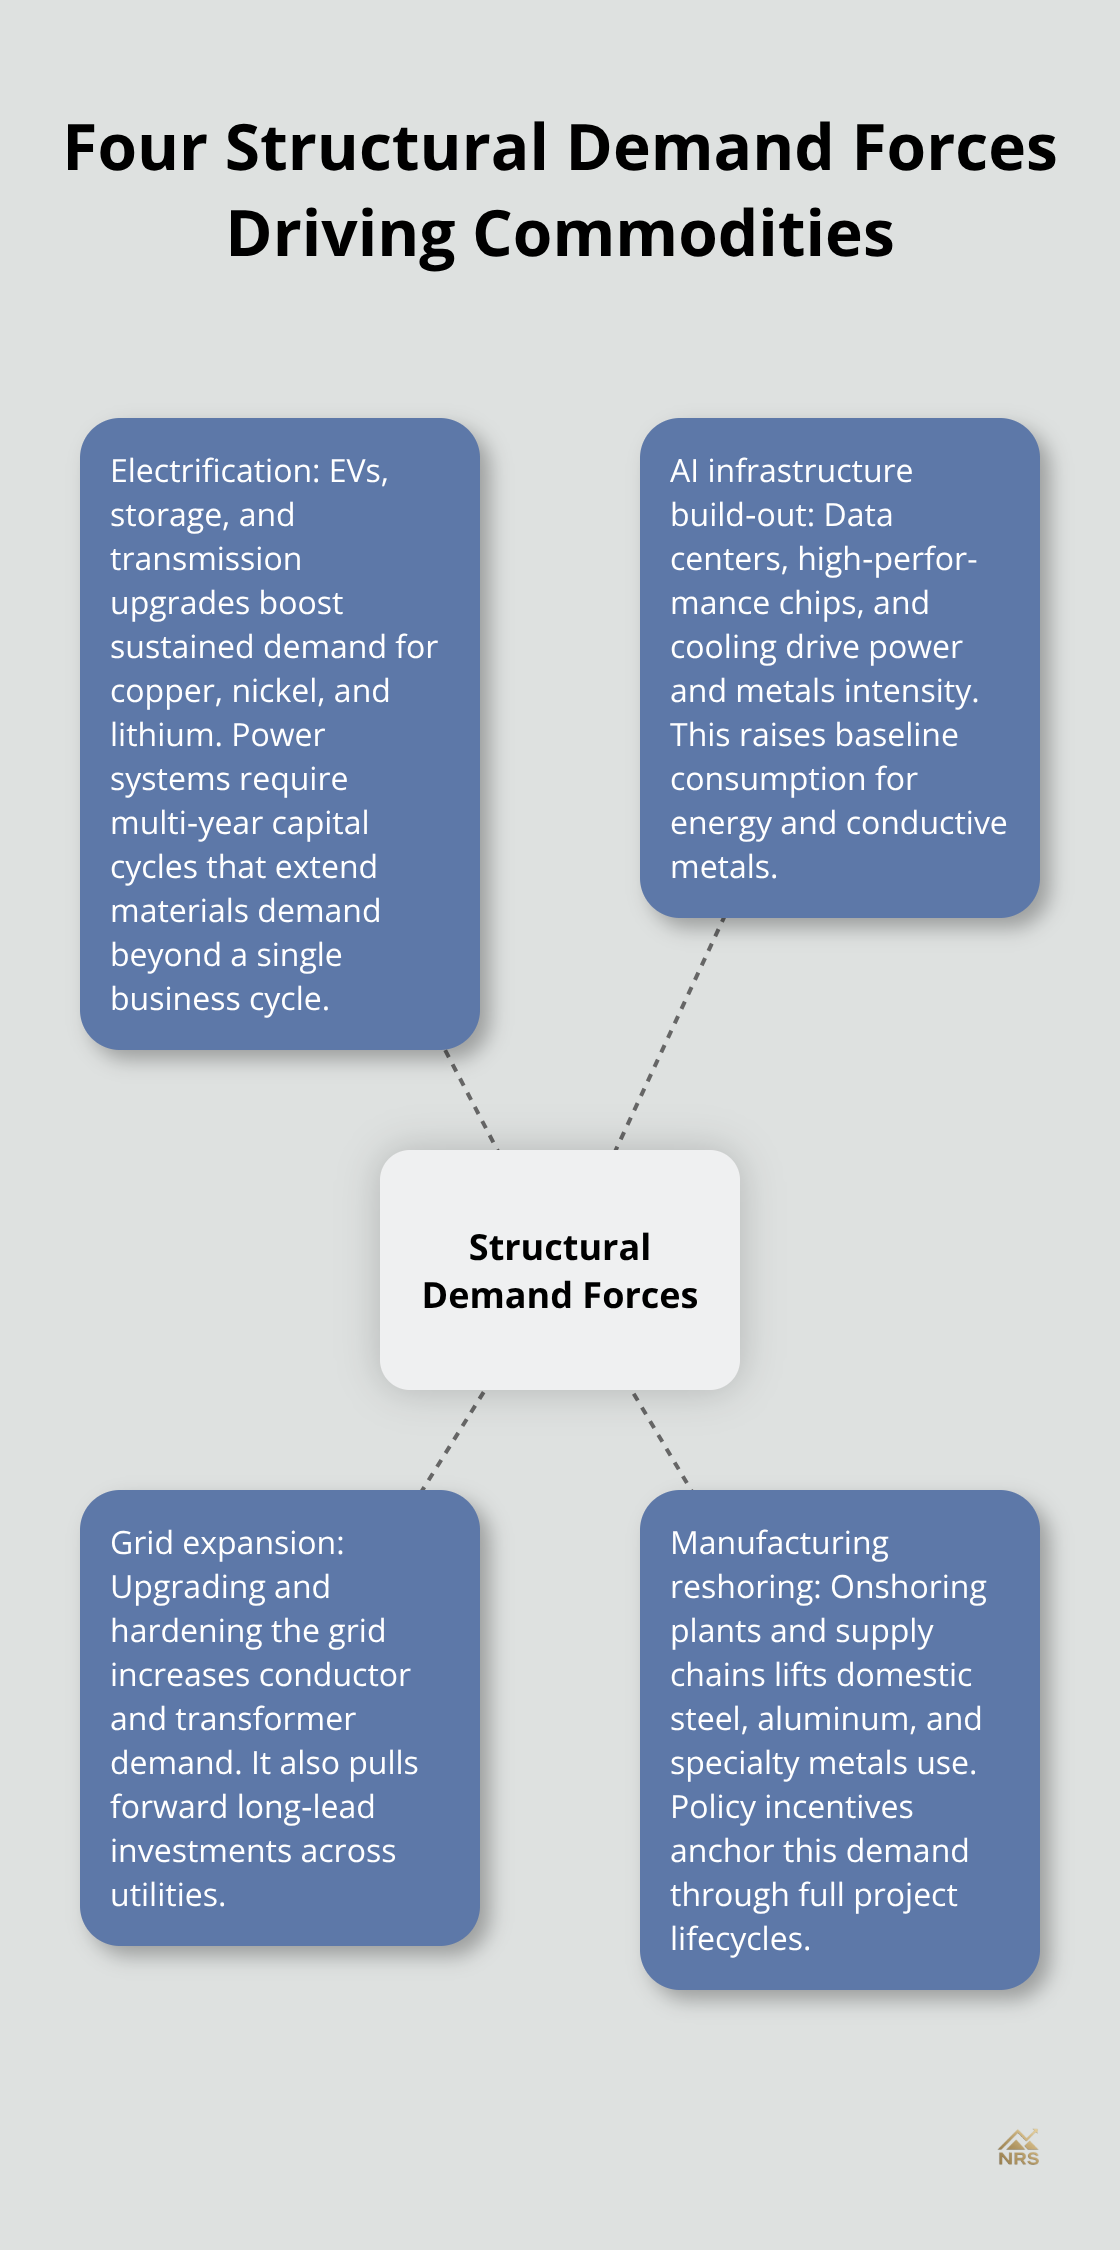
The current commodity cycle sits at an inflection point shaped by four structural demand forces that will dominate the next decade. Electrification, AI infrastructure build-out, grid expansion, and manufacturing reshoring represent a fundamental shift in how global economies consume raw materials. These forces are not temporary boosts-they will sustain commodity demand across multiple economic cycles.
Bloomberg data shows the Bloomberg Commodity Index gained roughly 24% since early 2025, with precious metals leading the advance. Gold climbed approximately 92% since the start of 2025, while silver surged roughly 150% over the same period. This dispersion across commodity types reveals the real mechanics at work: demand isn’t uniform, and neither are the supply constraints feeding price moves.
Central Bank Demand Anchors the Precious Metals Complex
Central bank gold purchases added 1,037 tonnes in 2023, the second highest annual purchase in history, combined with ETF holdings rising about 20% to over 3,000 tonnes, shows that the cycle’s foundation rests on structural buyer commitment, not speculation alone. The regime has shifted away from dollar-denominated reserves toward physical gold, anchoring the entire precious metals complex. This shift reflects a deliberate policy choice by central banks to diversify reserves, creating a price floor that persists regardless of short-term volatility.
Supply Deficits Collide with Structural Demand
Supply disruptions amplify these structural tailwinds into volatile price moves. Copper faces expected supply challenges by 2030, while 2025 supply disruptions at mines like Grasberg tightened markets further. China accounts for approximately 60% of refined copper demand, making inventory levels in London Metal Exchange and COMEX warehouses critical signals of price direction. Platinum presents an even tighter setup: supply concentration in South Africa, lease rates above 20%, and catalytic-converter demand create a supply-constrained environment ripe for price acceleration.
Geopolitical Risk and the Oil Cycle
Oil carries meaningful upside optionality in 2026 due to geopolitical risk, particularly around Iran and Strait of Hormuz constraints, with bearish positioning leaving room for sharp moves if tensions persist. These aren’t theoretical scenarios-they represent tangible supply gaps colliding with demand that refuses to ease. The transition to a more fragmented global economy has shifted policy toward supply security and strategic stockpiling, supporting commodity demand even during slower growth phases.
Why Cyclical Weakness No Longer Means Price Declines
This structural demand backdrop means that cyclical weakness no longer translates into sustained price declines the way it did in previous decades. Investors who time the next phase of this cycle must track which commodities face the tightest supply constraints and which demand drivers remain price-insensitive. The signals that separated winners from losers in past cycles have shifted, requiring a fresh approach to reading market direction.
Reading Market Signals That Actually Predict Price Moves
Central Bank Purchases Trump Interest Rate Moves
Central bank policy matters far less for commodity prices than most investors assume. What matters is the policy shift itself. The Federal Reserve’s pivot toward lower rates in 2025 created immediate tailwinds for commodities, but the real signal came from central banks rotating reserves away from dollar holdings into physical gold. This wasn’t a temporary trade-it represents a structural reallocation that will persist across multiple rate cycles. Track the World Gold Council’s quarterly central bank purchase data, not Fed meeting calendars. When central banks accumulate 800+ tonnes annually, rate cuts become secondary.
Credit Conditions Signal Commodity Strength Faster Than Rate Announcements
The Baa spread, which measures corporate credit conditions, transmits global financial shocks into commodity prices faster than any interest rate announcement. A tightening Baa spread signals looser credit conditions and higher export prices for commodity-dependent economies, which translates into sustained demand pressure on metals and energy. Monitor this spread weekly through Bloomberg terminals or financial news services. When it compresses below historical averages, commodity strength persists even if growth data weakens.
Oil’s Geopolitical Premium Offers the Sharpest Price Moves
Geopolitical risk pricing in oil deserves your constant attention because it’s the only commodity where supply gaps spike prices 20% overnight. The Strait of Hormuz disruptions earlier this cycle demonstrated that bearish positioning leaves room for violent upside moves. Real-time maritime tracking and asset intelligence reveal actual shipping flows and inventory changes across crude, LNG, and refined products before official data releases. This data advantage matters: you’ll spot supply tightness in COMEX crude inventories three to five days before the Energy Information Administration reports numbers.
Inventory Levels Reveal Hidden Deficits in Industrial Metals
For copper and precious metals, focus on China’s inventory levels in Shanghai Futures Exchange warehouses and LME holdings. When LME copper stocks fall below 100,000 tonnes, the market enters acute deficit territory where any production disruption triggers sharp rallies. Currency strength operates as a hidden signal that most commodity investors ignore. Dollar weakness in 2025 directly supported commodity prices by making physical metals cheaper for overseas buyers. The renminbi’s trade surplus and potential appreciation could accelerate this trend, but a sudden dollar rally would reverse it fast. Watch the US dollar index against a basket of emerging market currencies, not just the euro. When the dollar index drops below 102, commodity exporters gain pricing power and commodity demand strengthens globally.
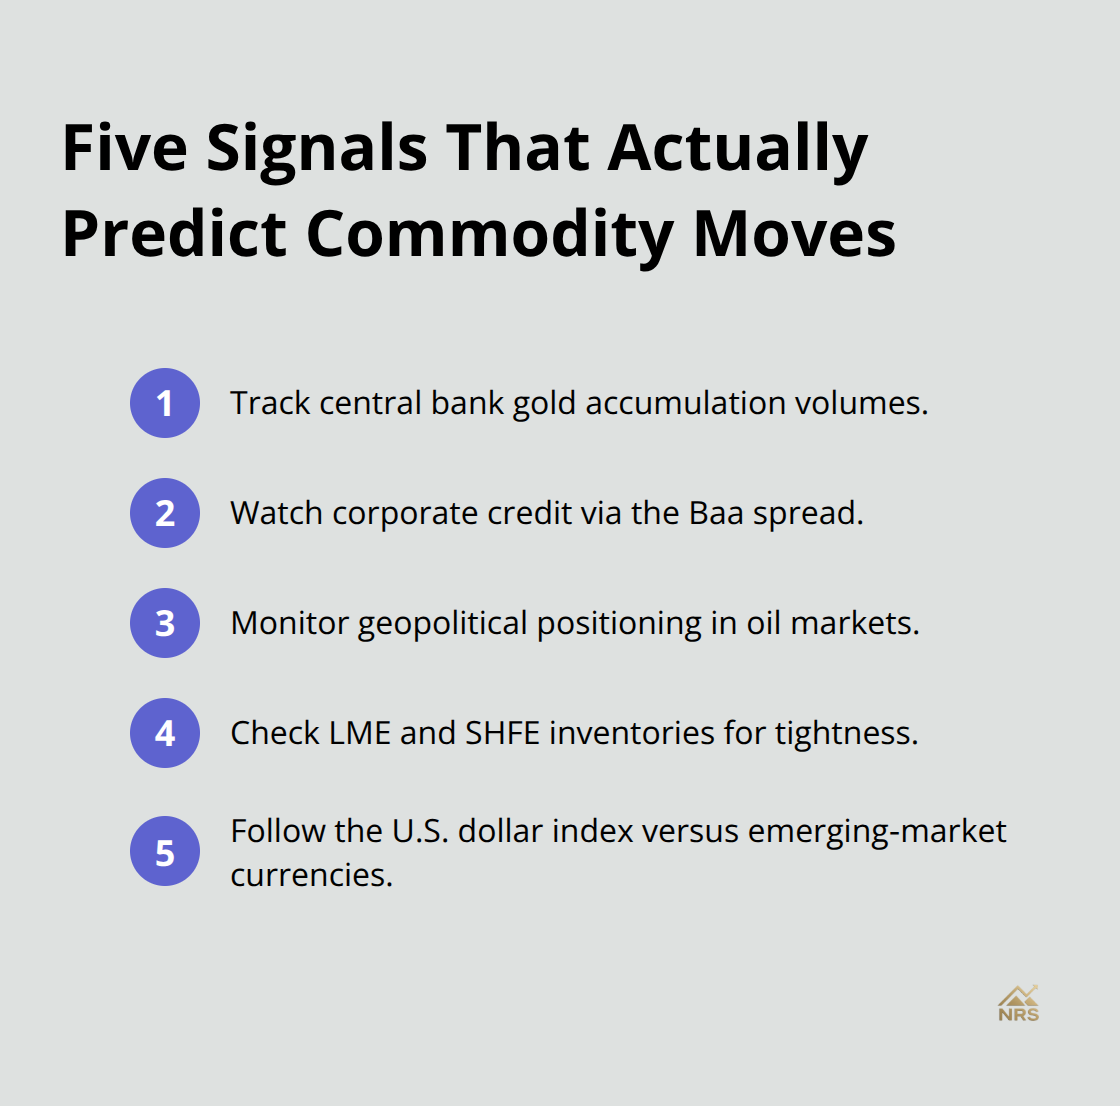
These signals-central bank accumulation, credit spreads, geopolitical positioning, inventory tightness, and currency moves-form the foundation for timing entries and exits. The next section reveals which tools separate investors who profit from cycle turns from those who chase prices after major moves have already occurred.
Tools That Actually Work for Timing Commodity Entries
Technical Analysis Reveals Cycle Peaks and Troughs
Technical analysis applied to commodity charts reveals cycle peaks and troughs with far greater precision than most investors realize, but only when combined with volume and open interest data that confirm institutional conviction. The Bloomberg Commodity Index broke above its 200-day moving average in early 2025 and held that level for six consecutive months, a signal that preceded the 24% rally that followed. For individual metals, watch the relationship between price and volume. When gold rallies 2% on triple-average volume, institutional buyers have committed capital. When it rallies 2% on thin volume, the move lacks conviction and reverses within days.
LME copper prices peaked in May 2024 when open interest hit 600,000 contracts, the highest level in three years, signaling that speculators had reached maximum length. Within weeks, a production disruption at Grasberg created supply tightness, but the market had already priced in the move. The lesson is stark: peaks form when positioning reaches extremes, not when fundamentals look strongest.
Open Interest Data Exposes Speculative Extremes
Track open interest data through the Commodity Futures Trading Commission’s Commitments of Traders report, released every Friday. When large speculators hold more than 150,000 net-long contracts in crude oil, the market sits vulnerable to sharp reversals. This positioning data moves faster than inventory reports and fundamentals, giving you a three-to-five-week window to adjust before the crowd repositions.
Institutional conviction shows up in the numbers before it shows up in prices. A spike in open interest combined with price strength signals that money managers have committed serious capital. A spike in open interest combined with price weakness signals that the move lacks staying power and reverses quickly.
Inventory Trends Expose Physical Supply Tightness
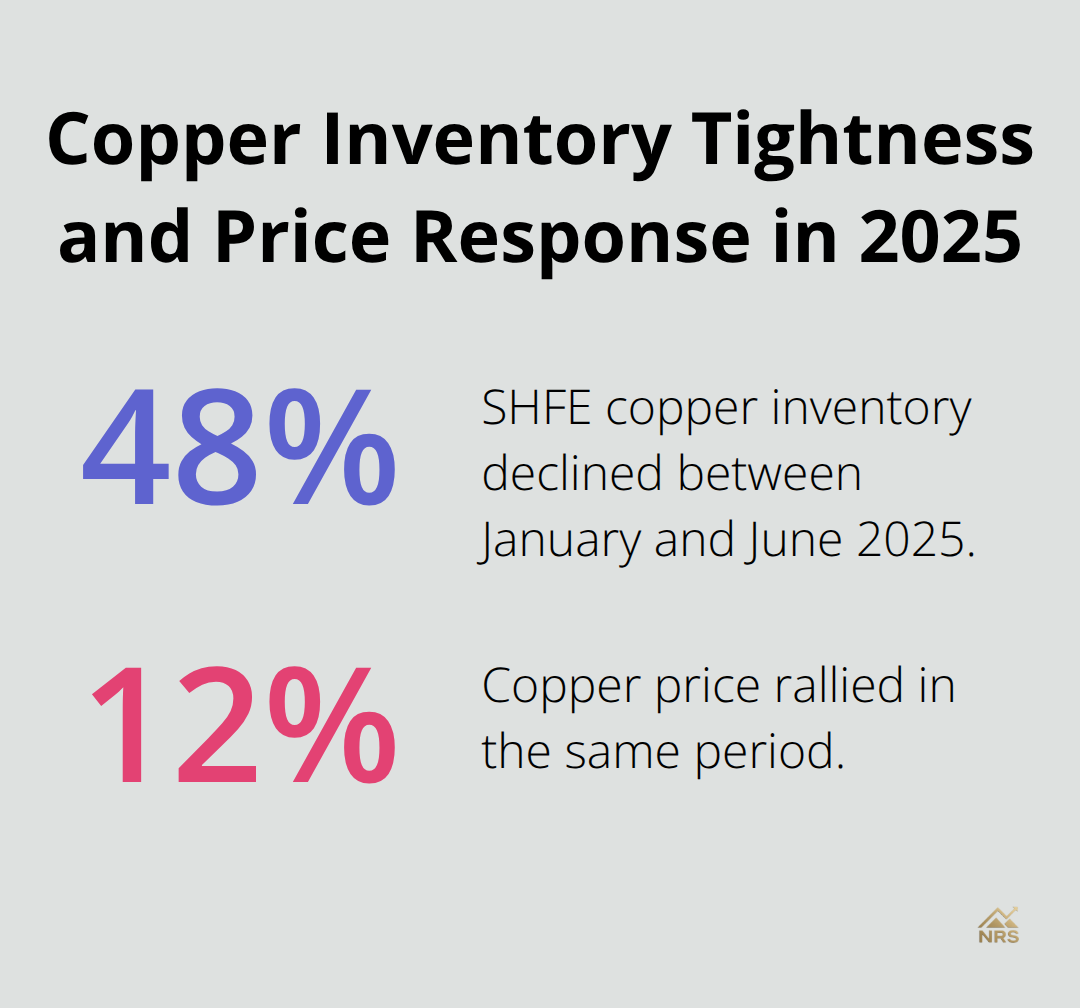
Inventory levels across major commodities operate as your most reliable early-warning system for price direction shifts. Shanghai Futures Exchange copper inventory fell from 280,000 tonnes in January 2025 to 145,000 tonnes by June, a 48% decline that preceded a 12% price rally in the same period. This matters because Chinese inventory tightness signals global supply stress before it appears in London or New York warehouses.
LME copper stocks below 100,000 tonnes indicate acute deficit conditions where any production hiccup triggers sharp rallies. For precious metals, focus on allocated versus unallocated gold held in LME vaults. When allocated gold holdings decline, it signals central banks are rotating into physical ownership rather than paper claims, a structural shift that supports prices. Monitor these inventory changes weekly through the LME’s official data portal and Shanghai Futures Exchange reports rather than waiting for monthly consensus estimates.
Currency Strength Determines Commodity Demand Globally
The currency dimension matters equally. Dollar weakness in 2025 made physical metals cheaper for foreign buyers, directly supporting demand. A sudden dollar rally would reverse this immediately. Track the US dollar index against emerging market currencies weekly, and when it breaks below 102, commodity exporters gain pricing power that translates into sustained demand strength globally.
These three tools work together: technical signals show you when positioning reaches extremes, open interest data reveals institutional conviction levels, and inventory trends expose physical supply tightness before official reports confirm it.
Final Thoughts
The macro commodity cycle has shifted into a phase where structural demand forces now override traditional cyclical weakness. Central banks continue accumulating physical gold at rates above 800 tonnes annually, electrification and AI infrastructure demand remain price-insensitive, and supply constraints in copper, platinum, and oil have tightened faster than most investors anticipated. These conditions persist across multiple economic cycles because they reflect fundamental changes in how global economies consume raw materials.
The tools that separate profitable investors from those who chase prices after major moves have already occurred work together seamlessly. Technical analysis combined with volume confirmation, open interest positioning data from the CFTC, and real-time inventory tracking from Shanghai Futures Exchange and LME warehouses reveal when the market reaches extremes. Central bank purchases trump interest rate announcements, credit spreads transmit global financial shocks faster than official data releases, and geopolitical risk in oil creates the sharpest price moves-patterns backed by eighteen months of Bloomberg data and positioning reports.
Copper faces a structural deficit by 2030 while 2025 supply disruptions have already tightened markets, platinum’s supply concentration in South Africa combined with lease rates above 20% creates conditions for sharp rallies, and oil’s geopolitical premium offers the sharpest upside if tensions around Iran or the Strait of Hormuz escalate. Visit our platform to access expert commentary on geopolitical impacts, policy shifts, and the commodity fundamentals that drive prices in real time.