



























Natural resources investing demands more than picking individual stocks. Spreading your capital across metals, energy, and rare earth elements protects you from the volatility that comes with betting on a single commodity.
At Natural Resource Stocks, we’ve seen portfolios collapse when investors ignored diversification. This guide walks you through practical natural resources portfolio ideas that actually work in volatile markets.
Why Diversification Protects Your Natural Resources Investments
Concentration in a single commodity or sector exposes you to catastrophic losses when that market turns. In 2015, oil prices collapsed from $107 per barrel to $26, wiping out portfolios loaded entirely into energy stocks. Investors who held nothing but copper positions watched their holdings fall 30% in 2022 as demand fears spread. These weren’t hypothetical scenarios-they happened to real investors who ignored diversification. Spreading capital across metals, energy, and rare earth elements isn’t optional; it’s the difference between surviving downturns and losing significant wealth. Research shows that natural resource equities have historically exhibited low correlation with traditional equities and fixed income, meaning they move independently from stocks and bonds. This independence matters enormously when markets shake. A portfolio holding both gold miners and oil producers performs differently than one betting everything on a single commodity. Gold tends to rise during crises while oil can fall, creating a natural hedge within your natural resources allocation.
The Volatility Reality of Single-Commodity Bets
Natural resource markets are inherently volatile, but volatility concentrates dramatically when you lack diversification. Agricultural commodities swing wildly based on weather patterns and crop cycles. A severe drought in Argentina or Brazil can crater corn and soybean prices within weeks. Energy markets respond to geopolitical shocks-OPEC decisions, sanctions, or regional conflicts can move crude oil 20% in days. Metals face demand swings tied to manufacturing activity and construction cycles. Instead of absorbing these shocks across multiple uncorrelated assets, a concentrated position amplifies losses. The practical solution involves allocating roughly 30% to metals, 40% to energy, and 30% to emerging opportunities like rare earth elements and uranium. These percentages aren’t fixed rules but starting points based on macroeconomic outlook. When inflation expectations rise, increase metals exposure. When energy demand strengthens from AI data center expansion, add energy allocations.
Geographic Diversification Reduces Political Risk
Geographic diversification matters equally to sector allocation. A portfolio holding Canadian uranium producers, Australian copper miners, and Middle Eastern oil companies faces different political and regulatory risks than one concentrated in a single region. Resource nationalism, export restrictions, and tax policy changes hit different countries at different times. Spreading your holdings across continents protects you from sudden policy shifts in any one jurisdiction. When one government tightens mining regulations or raises royalty rates, your other geographic positions continue operating under stable conditions. This approach also hedges against currency fluctuations-holdings in multiple countries reduce exposure to any single currency’s weakness.
Rebalancing Maintains Your Risk Profile
Markets move faster than most investors react. A commodity that represented 25% of your portfolio can balloon to 40% when prices spike, suddenly creating the concentration risk you worked to eliminate. Rebalancing quarterly or semi-annually forces discipline-you sell positions that have risen too far and buy those that have lagged. This systematic approach removes emotion from decisions and locks in gains. Monitor the correlations between your holdings actively. When copper and crude oil correlations spike above 0.7, your diversification benefits shrink, signaling you need geographic or sector shifts. When correlations drop near zero, your hedge works properly. Track these relationships using data from commodity exchanges or analysis tools that track rolling correlations.
How Commodity Relationships Shift Over Time
A portfolio that worked perfectly three years ago may need restructuring today as global demand patterns shift. The energy transition is rewriting commodity relationships-copper now correlates more with renewable infrastructure spending than with traditional energy demand, while uranium correlates with grid modernization rather than oil markets. These shifting dynamics mean your allocation strategy must adapt. What protected you in 2020 may leave you exposed in 2026. Monitoring how your holdings move relative to each other reveals when structural changes demand portfolio adjustments. The next section covers how to construct a balanced portfolio that accounts for these evolving relationships and positions you to capitalize on emerging macroeconomic trends.
How to Structure Your Sector and Geographic Mix
The theoretical allocation of 30% metals, 40% energy, and 30% rare earth elements works fine in textbooks, but real portfolios demand flexibility based on current macroeconomic conditions. Start by assessing where global demand is actually growing. AI data center expansion is driving structural electricity demand that favors natural gas producers and uranium companies right now-this argues for overweighting energy exposure above the 40% baseline. Copper faces a supply deficit as electrification accelerates and existing mines deplete faster than new capacity comes online. According to S&P Global, primary mined supply could increase from 23 million metric tons in 2025 to a peak of 27 million in 2030, making copper-focused positions attractive within your metals allocation. When inflation expectations spike above 5%, gold and silver deserve larger positions because precious metals historically protect purchasing power during extended inflationary periods.
Adjust Allocations Based on Macroeconomic Signals
The key is adjusting your allocation quarterly based on three factors: inflation expectations from Treasury yields, energy demand growth rates from IEA projections, and supply-side constraints in specific commodities. These three inputs tell you where to shift capital within your natural resources sleeve.
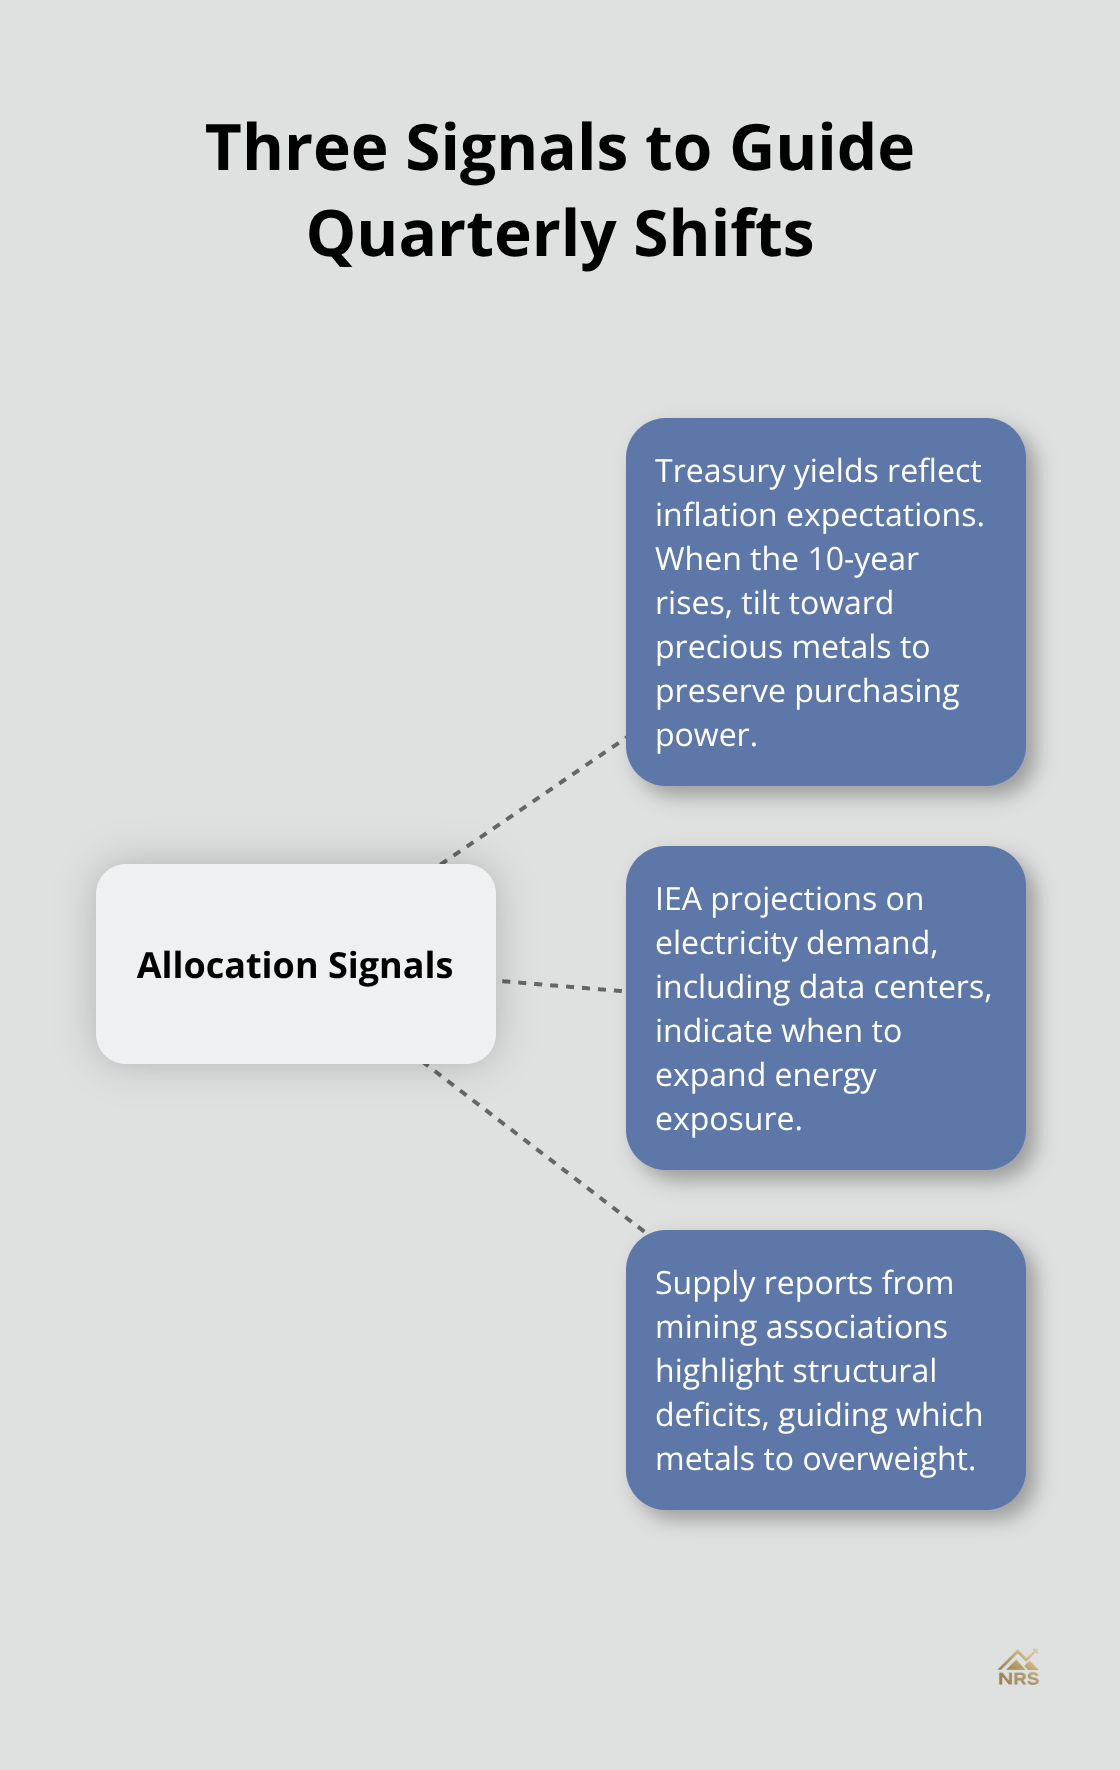
Rising Treasury yields signal inflation expectations-when the 10-year yield climbs above 4%, increase your precious metals weighting. IEA data on electricity demand from data centers shows you whether energy allocations should expand. Supply reports from mining associations reveal which metals face structural deficits. This data-driven approach replaces guesswork with measurable market signals.
Large-Cap Stability Versus Emerging Upside
Large-cap mining companies like Rio Tinto or energy majors like Shell provide stable cash flows and dividends, making them suitable for 60-70% of your natural resources allocation. These established producers have hedged operations, diversified geographies, and proven management teams that weather commodity cycles better than smaller operators. They trade at lower volatility because their cash generation is predictable and their dividends provide downside support. A major oil company paying 4-5% dividend yield creates a floor under share prices during downturns.
Junior miners and emerging producers should occupy only 20-30% of your natural resources sleeve because they lack the financial buffers of majors and can face total loss if exploration efforts fail. However, junior positions offer asymmetric upside when commodity prices rise sharply-a junior copper explorer might return 500% during a supply crisis while Rio Tinto returns 50%. Emerging producers offer no dividends and trade on pure commodity price exposure, meaning they can collapse 70% when commodity prices fall.
Geographic Spread Protects Against Policy Shocks
Geographic concentration in any single country creates unacceptable risk. If your portfolio holds 40% Canadian exposure, you’re betting heavily on Canadian tax policy and regulatory stability. Spread your holdings across Australia (major copper and iron ore), Canada (uranium and oil), Chile (copper and lithium), and emerging markets like Peru and Indonesia where resource nationalism remains a constant threat. This geographic spread means when one jurisdiction imposes stricter environmental regulations or raises royalty rates, your other positions continue generating returns unaffected.
Layer Core and Satellite Positions
The practical approach allocates your core position to majors through diversified ETFs that hold large-cap natural resource companies across metals and energy. This core position should represent 65-70% of your natural resources allocation and provide steady returns with acceptable volatility. Overlay this core with targeted positions in junior explorers or single-commodity specialists that align with your macroeconomic view. If you believe copper will face structural supply deficits, a 15% position in a junior copper explorer makes sense. If you expect uranium demand to accelerate, allocating 10% to an emerging uranium producer captures that upside. This layered approach prevents juniors from dragging down your entire portfolio during commodity downturns while maintaining exposure to multi-bagger returns when commodities spike.
The next section covers how to monitor and adjust these positions as market conditions shift, ensuring your portfolio remains aligned with the macroeconomic trends driving natural resource demand.
Turning Data Into Allocation Decisions
Your sector weights mean nothing without a system to adjust them as markets shift. The practical approach starts with three monthly data points: the 10-year Treasury yield, copper futures prices, and natural gas spot prices. These three indicators tell you everything about whether your current allocation matches macroeconomic reality. When the 10-year yield rises above 4.5%, inflation expectations are climbing and precious metals deserve larger positions within your metals allocation. When copper trades above $4.50 per pound while global manufacturing indices show weakness, you’re seeing supply constraint pricing rather than demand-driven strength, signaling an opportunity to increase exposure. Natural gas prices above $3.50 per MMBtu indicate energy scarcity and justify overweighting energy producers against your baseline 40% allocation. These aren’t arbitrary numbers; they represent inflection points where market structure shifts.
Track Three Core Indicators Weekly
Track these three data points weekly on commodity exchanges or through Bloomberg terminals if you have access. Most investors ignore this discipline and rebalance only when they remember, which means they’re perpetually misaligned with current conditions. Your portfolio will drift as markets move, but systematic rebalancing forces you to sell strength and buy weakness-this is how disciplined investors outperform. The 10-year Treasury yield signals inflation expectations directly. Copper futures reveal supply constraints versus demand weakness. Natural gas spot prices show energy market tightness. Together, these three metrics eliminate guesswork from allocation decisions.
Monitor Correlations to Preserve Diversification
Correlation monitoring is where most natural resources investors fail completely. You can hold perfectly diversified sector weightings while your holdings move in lockstep, eliminating all diversification benefits. Check rolling three-month and twelve-month correlations monthly between your major holdings or sector ETF positions. When correlations exceed 0.7 across your metals and energy positions, you’ve lost the hedge you designed into your portfolio.
The solution involves shifting geographic exposure rather than sector exposure. If North American copper and North American energy are highly correlated because of regional economic cycles, rotate copper exposure toward Chilean or Peruvian producers whose cycles move differently. Alternatively, add positions in rare earth elements or uranium, which show near-zero correlation to traditional energy during most market cycles. This geographic rotation preserves your diversification benefits when sector correlations spike.
Execute Quarterly Rebalancing on Fixed Dates
Rebalancing forces you to execute these shifts mechanistically. Set calendar dates for quarterly rebalancing on March 31st, June 30th, September 30th, and December 31st. On those dates, calculate whether any position has drifted more than 5 percentage points from its target allocation. If metals were supposed to be 30% and now represent 35%, sell 5 percentage points worth of your best-performing metals position and redeploy that capital into whichever sector or geography has underperformed most. This approach prevents winners from consuming your portfolio while locking in gains.
The discipline matters more than the specific percentages. Investors who rebalance quarterly outperform those who rebalance annually or irregularly because they systematically buy dips and sell rallies rather than chasing performance. Fixed rebalancing dates remove emotion from decisions and align your portfolio with macroeconomic signals that shift monthly.
Final Thoughts
Diversification in natural resources investing isn’t theoretical-it’s the difference between surviving commodity downturns and watching your wealth evaporate. The natural resources portfolio ideas we’ve covered throughout this guide rest on three pillars: spreading capital across uncorrelated sectors, balancing large-cap stability with emerging upside, and adjusting allocations based on measurable macroeconomic signals rather than guesswork. Your portfolio succeeds when you treat it as a living system that responds to changing market conditions, monitoring Treasury yields, copper prices, and natural gas spot prices monthly, then rebalancing quarterly to maintain alignment with current economic reality.
The correlation monitoring we discussed matters equally to your sector allocation. A portfolio that looks diversified on paper but moves in lockstep provides no protection during downturns, so geographic rotation and sector shifts preserve the hedge you’ve built into your allocation. Quarterly rebalancing forces you to sell strength and buy weakness-the mechanical discipline that separates consistent performers from investors who chase performance. This data-driven approach replaces emotion with discipline and positions you to participate in natural resource upside when commodity cycles turn favorable.
We at Natural Resource Stocks provide the market analysis and macroeconomic insights you need to make these allocation decisions with confidence. Start with your core allocation to large-cap producers through diversified ETFs, layer in targeted junior positions aligned with your macroeconomic outlook, and commit to quarterly rebalancing on fixed calendar dates. Access our expert analysis and market commentary to stay informed as you implement your diversified natural resources strategy.