

























Platinum prices move for specific reasons, and understanding them matters if you’re tracking natural resource investments. At Natural Resource Stocks, we’ve identified the key forces reshaping platinum price trends in 2026-from mine production shifts to geopolitical tensions.
Supply constraints, macroeconomic conditions, and policy changes are colliding in ways that directly impact your portfolio decisions. This guide breaks down exactly what’s moving platinum prices right now.
Supply and Demand Dynamics Shape Platinum Prices in 2026
South Africa’s Stranglehold on Global Supply
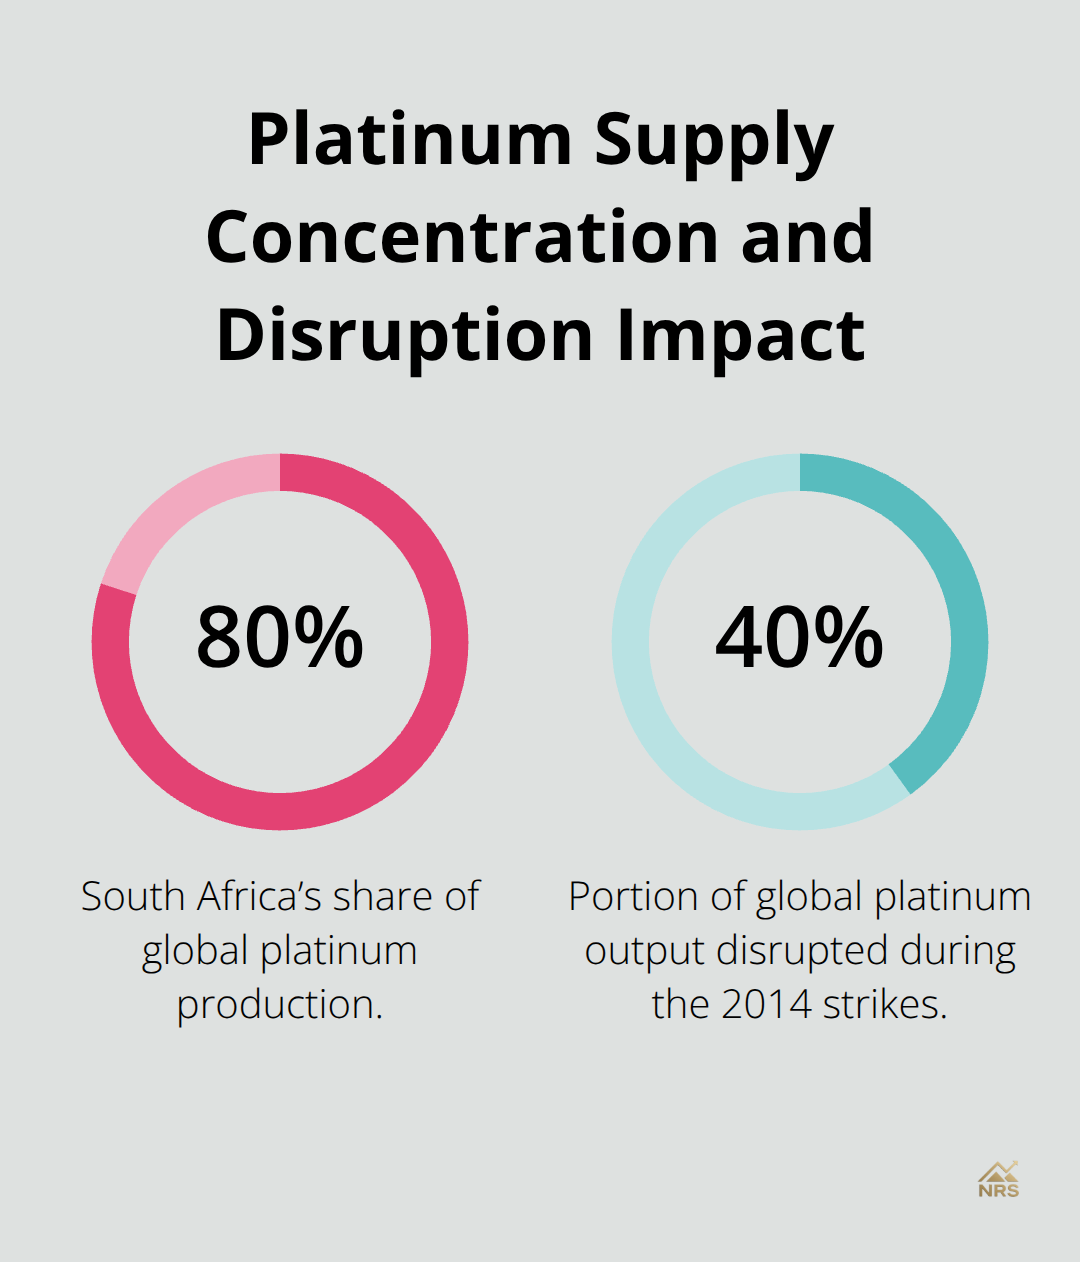
South Africa controls roughly 80 percent of global platinum production, and this concentration creates a structural price floor that protects investors during market weakness. When South African mines face disruptions-power cuts, labor disputes, or maintenance shutdowns-platinum prices spike because no quick alternative supply exists. The World Platinum Investment Council forecasts a structural deficit averaging 331,000 ounces annually through 2030, meaning supply will consistently fall short of demand. This isn’t theoretical; it’s happening now. In 2026, platinum has already experienced supply tightness that pushed prices above 1,750 USD per troy ounce in mid-August despite broader precious metals volatility.
Russia and North America produce smaller volumes, but geopolitical tensions around Russian sanctions add another layer of supply risk that keeps prices elevated. Declining ore quality at existing mines means production costs rise even without wage increases, forcing producers to maintain higher price levels just to justify operations. Recycling currently can’t fill the gap-recycling growth in 2026 has fallen short of expectations, limiting supply relief even as prices climb.
Automotive Catalysts Drive the Price Foundation
Platinum’s use in automotive catalytic converters represents 36 to 44 percent of total demand according to the World Platinum Investment Council. Stricter emission standards like Euro 6 have locked in platinum requirements for decades, tying prices directly to vehicle production cycles. Fuel cell electric vehicles present a structural upside because they require significantly more platinum than traditional combustion engines, and as hydrogen infrastructure expands in trucks and buses, this demand channel could accelerate rapidly.
Jewelry and Industrial Applications Provide Stability
Jewelry consumption accounts for 24 to 30 percent of demand, with China driving innovation in platinum designs and India showing emerging strength in men’s jewelry segments. Industrial applications-platinum catalysts in nitric acid production, glass manufacturing, and LED screens-comprise 23 to 35 percent of demand and remain resilient across economic cycles. Investment demand swings between minus 8 and plus 14 percent of total demand depending on market sentiment, but it’s the smallest segment and least reliable for price forecasting.
Automotive demand creates a baseline price floor because it won’t disappear, while jewelry and industrial uses provide additional stability that commodity investors rarely find in other metals. These overlapping demand channels mean platinum prices respond to multiple economic signals simultaneously, making macroeconomic conditions the next critical lens for understanding 2026 price movements.
How Macroeconomic Conditions Shape Platinum Prices
The Dollar’s Direct Impact on Platinum Demand
The US dollar’s strength directly suppresses platinum demand because the metal trades in dollars globally. When the dollar strengthens, international buyers face higher effective prices in their home currencies, reducing purchasing power and shrinking orders. In mid-August 2026, softer US inflation data reduced expectations for aggressive Federal Reserve tightening, which weakened the dollar and supported platinum prices above 1,750 USD per troy ounce.
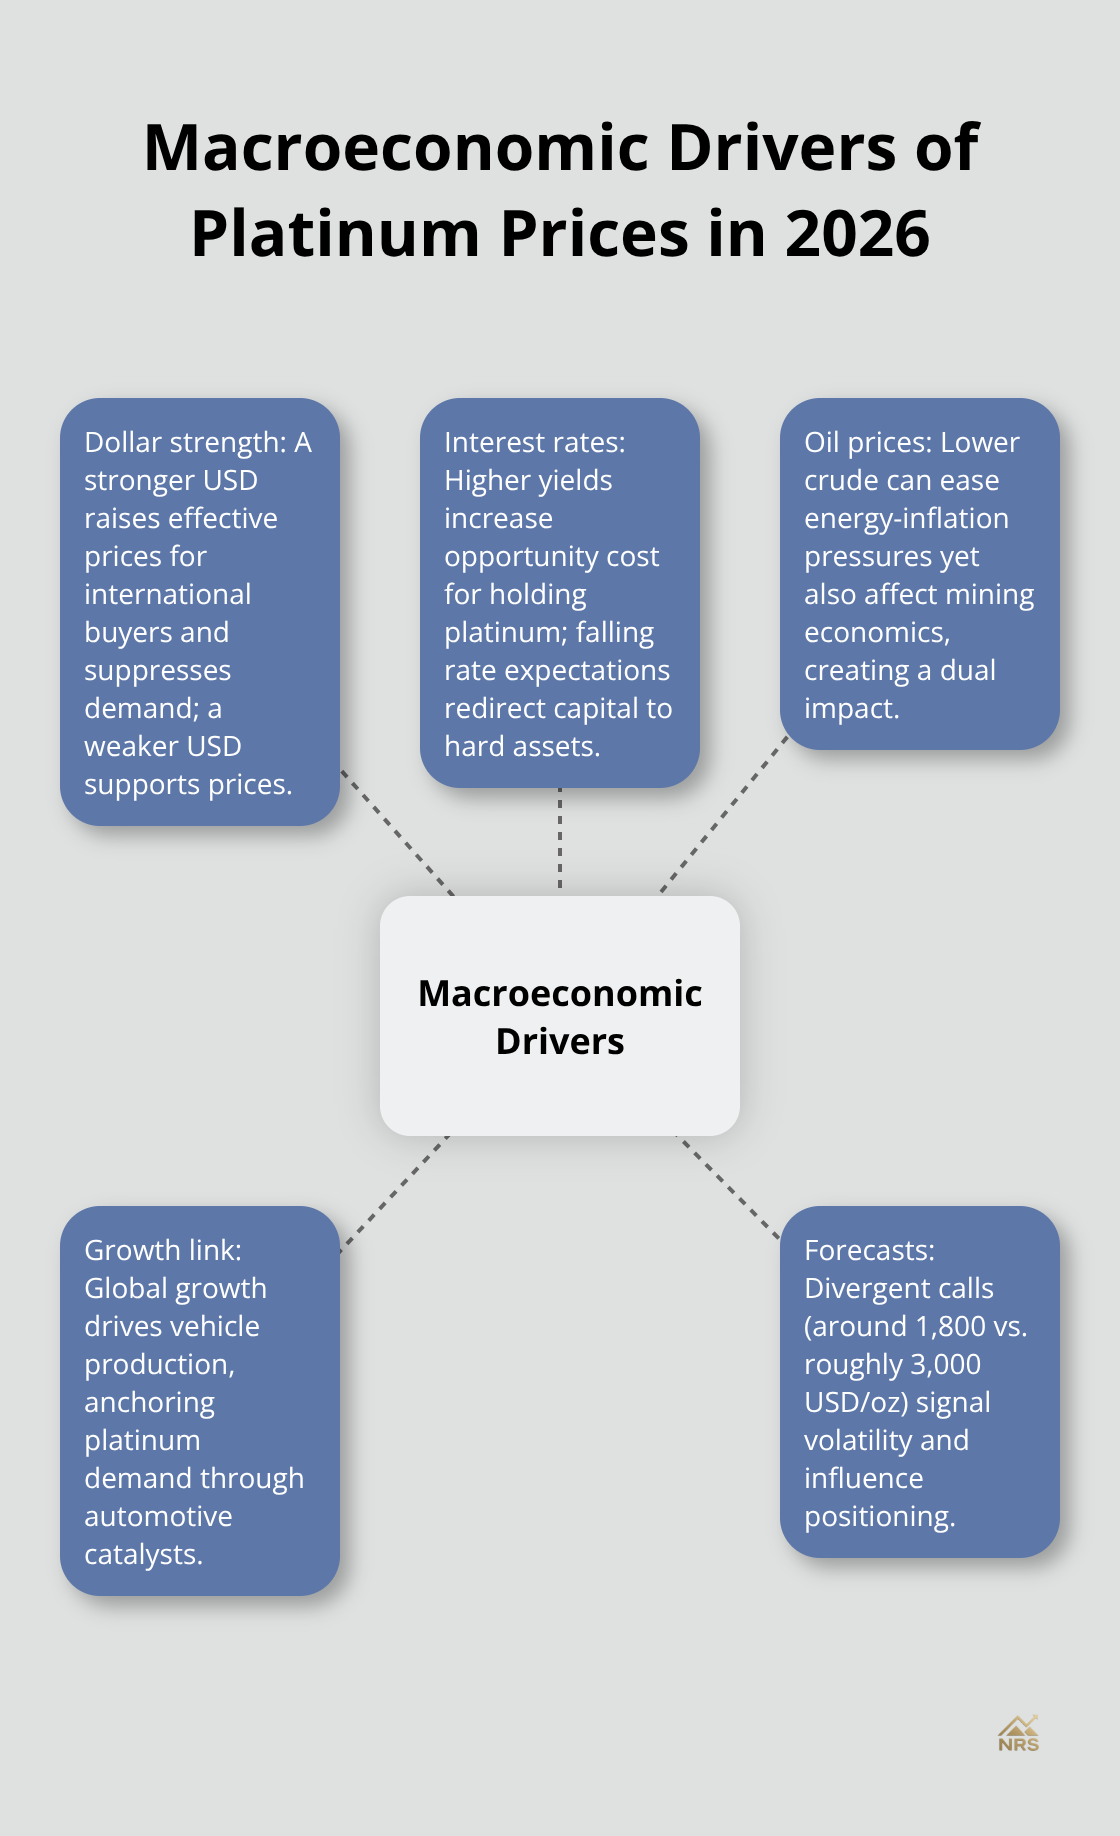
This relationship matters for your timing: watch the US inflation calendar and Fed commentary closely because platinum typically rallies when inflation data disappoints expectations and interest-rate hike odds decline.
Interest Rates and Platinum’s Opportunity Cost
Interest rates affect platinum’s opportunity cost because the metal generates no yield or dividends. Higher rates push investors toward bonds and dividend-paying stocks, draining capital from non-yielding assets like platinum. Conversely, declining rate expectations or recession fears drive capital toward hard assets. Track the 10-year US Treasury yield as a leading indicator: when it drops below 3.5 percent, platinum typically strengthens because investors rotate away from bonds.
Oil Prices and Production Economics
Oil prices influence platinum valuations because energy-intensive platinum production becomes less profitable when crude falls, yet lower oil eases inflation concerns that typically support precious metals. In 2026, declining oil prices helped ease energy-inflation concerns and contributed to a more favorable price environment for platinum despite broader market volatility. This dual effect means oil price movements can cut both ways for platinum investors.
Forecasts Reveal Genuine Disagreement on 2026 Prices
JPMorgan projects platinum averaging around 1,800 USD per troy ounce by year-end 2026, but Bank of America takes a more bullish stance at roughly 3,000 USD per troy ounce in Q4 2026, reflecting genuine disagreement about whether rate cuts or geopolitical demand will dominate. The price gap between these forecasts signals volatility ahead, so position sizing matters more than directional conviction in 2026.
Economic Growth and Automotive Demand Linkage
Global economic growth directly impacts automotive demand, which anchors platinum consumption. Recession risks in major economies like the US, Europe, or China would immediately suppress vehicle production and crash platinum prices, so monitor manufacturing PMI data and corporate earnings guidance for early signals of demand weakness. These macroeconomic forces interact with geopolitical events in ways that amplify or dampen price movements, making the next set of policy risks equally important for investors tracking platinum in 2026.
Geopolitical Events and Policy Changes Affecting Platinum
South Africa’s Supply Dominance Creates Structural Price Support
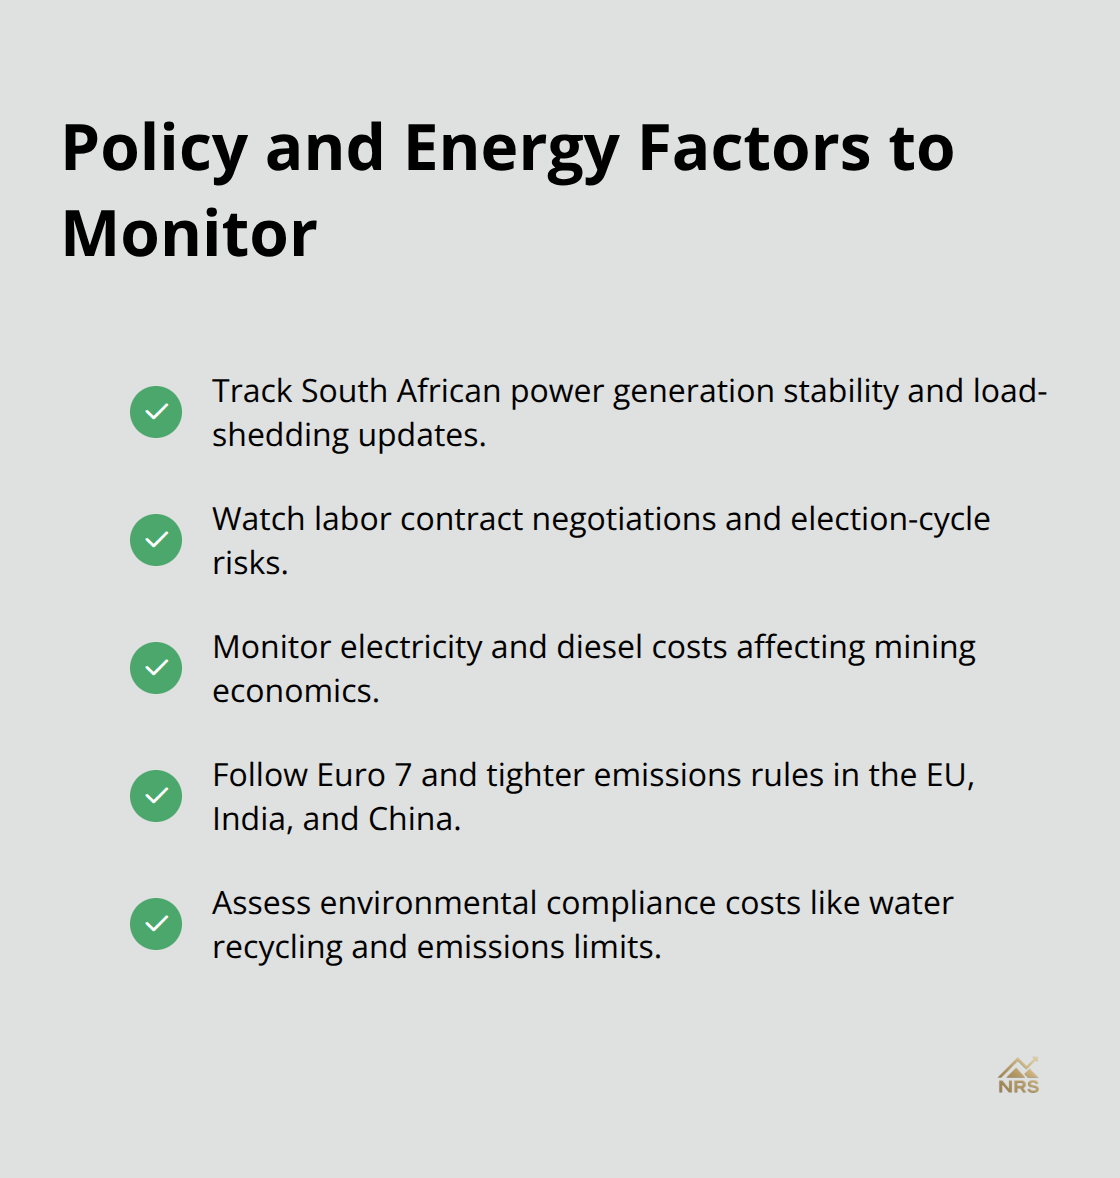
South Africa controls roughly 80 percent of global platinum production, and this concentration creates a structural price floor that protects investors during market weakness. When South African mines face disruptions-power cuts, labor disputes, or maintenance shutdowns-platinum prices spike because no quick alternative supply exists. The 2014 strikes disrupted roughly 40 percent of global platinum output, demonstrating how rapidly supply shocks cascade through prices. Today, South African miners contend with persistent power cuts from state-owned Eskom, water shortages, currency instability, and ongoing labor tensions that make production unpredictable. These aren’t temporary headwinds; they represent structural problems that force mining companies to maintain higher price expectations to justify capital investment.
When the South African rand weakens against the dollar, mining profitability improves because production costs in local currency remain stable while dollar-denominated revenues rise. This natural hedge supports prices during currency volatility. Platinum prices respond sharply to major supply disruptions, so watch South African election cycles and labor contract negotiations closely. The supply concentration that characterizes platinum markets eliminates the possibility of sudden production surges that would crash prices, benefiting investors who hold the metal.
Russian Sanctions and Secondary Supply Risks
Russian sanctions create a secondary supply risk that remains difficult to quantify but increasingly relevant as Western buyers diversify away from Russian palladium and platinum. This geopolitical fragmentation means platinum supply becomes even more concentrated among reliable producers, further tightening global markets. The inability to access Russian supplies forces buyers to compete for South African and North American production, supporting price levels across economic cycles.
Energy Costs Drive Production Economics and Regulatory Compliance
Energy costs represent the largest variable component of platinum production economics, and stricter environmental regulations raise those costs permanently. Platinum mining requires substantial electricity for ore processing and metal concentration, making South African energy prices a direct input to mining profitability. When Eskom implements rolling blackouts, mining companies delay production or shift to lower-grade ore, reducing platinum output and tightening supply further.
Environmental policies mandating water recycling, emissions reductions, and biodiversity protections add compliance costs that smaller producers cannot absorb, consolidating supply among larger operators with deeper capital reserves. India and China implement stricter catalytic converter regulations that lock in platinum demand for the next decade, while the European Union’s Euro 7 standards will require even more aggressive emissions control technology. These regulatory tailwinds create a structural floor under platinum demand that survives economic downturns because compliance is mandatory, not optional.
Regulatory Tightening Limits Supply Expansion
Regulatory tightening and energy constraints make supply expansion nearly impossible, so price appreciation depends on demand sustainability rather than supply growth. Monitor South African power generation data and global automotive emissions standards because these factors directly determine platinum’s long-term price floor. The combination of concentrated supply, rising production costs, and mandatory emissions regulations creates an environment where platinum prices remain supported regardless of short-term economic weakness.
Final Thoughts
Platinum price trends in 2026 hinge on three interconnected forces that will determine whether prices climb toward Bank of America’s 3,000 USD per troy ounce forecast or settle near JPMorgan’s more conservative 1,800 USD estimate. South African production disruptions from power cuts or labor disputes will spike prices faster than any other single factor, while the structural deficit averaging 331,000 ounces annually through 2030 creates a price floor that protects investors during market weakness. US inflation data and Federal Reserve commentary directly influence platinum’s opportunity cost and the dollar’s strength, so when rate-hike odds decline, platinum typically rallies as capital rotates away from bonds.
Automotive production cycles and hydrogen infrastructure expansion represent 36 to 44 percent of consumption and won’t disappear during economic slowdowns, providing a demand foundation that sustains prices across market cycles. Declining ore quality and rising production costs ensure prices remain elevated relative to historical averages, while recycling constraints limit supply relief even as prices climb. The metal’s multiple demand channels across automotive, jewelry, industrial, and investment segments mean platinum won’t collapse if one sector weakens.
Position sizing matters more than directional conviction in 2026 because forecasts diverge sharply and signal volatility ahead. We at Natural Resource Stocks track platinum price trends through expert analysis and market commentary that connects geopolitical events to your portfolio decisions. Visit Natural Resource Stocks to access in-depth analysis on platinum and other metals that matter for your investment strategy.