






















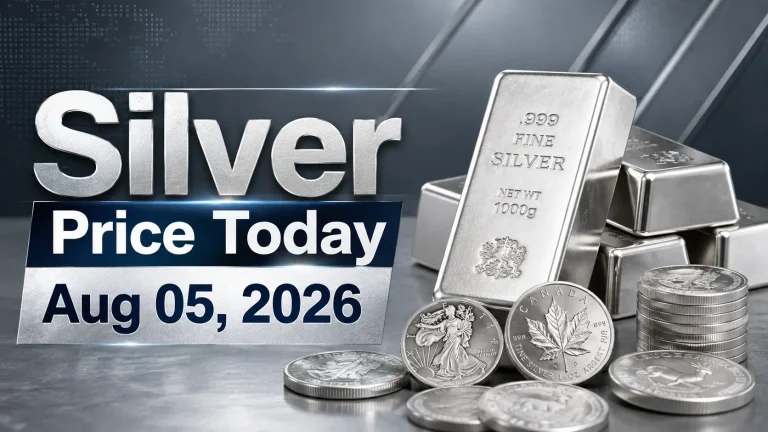
As of Aug 05, 2026, at 3:00 AM EDT, the live Silver spot price for 1 ounce of Silver in U.S. dollars (USD) is $61.45; 1 gram of Silver is $1.98, and 1 kilogram of Silver is $1,975.66. The silver spot price can fluctuate by the second, driven by investment supply and demand, as well as other factors.
Silver Spot Prices
Silver Price | Price | Change |
Silver Price Per Ounce | $61.45 | +$1.94 |
Silver Price Per Gram | $1.98 | +$0.06 |
Silver Price Per Kilo | $1,975.66 | +$62.37 |
Live Metal Spot Prices (24 Hours) Last Updated: 08/05/2026 at 3.00 AM EDT
Current Silver Spot Price Aug 05 2026: Silver Reclaims $60
The current silver spot price Aug 05 2026 has done something it has not managed in weeks — it has punched decisively back through the $60 handle. Silver is trading at $61.45 per ounce in early Wednesday trading, up $1.94, or 3.26%, from Tuesday’s $59.51 close.
This is now a three-session rally. From Monday’s $57.94 close to the current print, silver has added $3.51 an ounce, a gain of 6.06% in three trading days.
Here is the full silver price Aug 05 2026 USD per ounce picture:
Metric | Value (as of 3.00 AM EDT, Aug 05 2026) |
Spot Silver (XAG/USD) | $61.45 / oz |
Daily Change | +$1.94 (+3.26%) |
Previous Close (Aug 04) | $59.51 / oz |
Silver Per Gram | $1.98 |
Silver Per Kilogram | $1,975.66 |
3-Session Gain | +$3.51 (+6.06%) |
52-Week Range | $32.24 – $121.79 |
All-Time High | $121.64 (January 2026) |
Distance From ATH | –49.5% |
Gain vs 52-Week Low | +90.6% |
1-Month Change | –0.95% |
1-Year Change | +62.39% |
Gold-Silver Ratio | ~67.8:1 |
Two numbers deserve emphasis. Silver is now up 62.39% year over year — an extraordinary figure by any historical standard. And it has more than doubled off its 52-week low, sitting 90.6% above $32.24. Yet it remains 49.5% below the January 2026 record of $121.64.
That is the defining tension in the silver price Aug 05 2026 current quote: a market that has delivered generational returns to anyone who bought a year ago, and brutal losses to anyone who bought the January top. Both cohorts are watching the same $60 line.
What Changed Since Yesterday
For readers tracking our daily coverage, the delta between Tuesday and Wednesday is meaningful:
Aug 04 Close | Aug 05 (3.00 AM EDT) | Change | |
Silver | $59.51 | $61.45 | +$1.94 (+3.26%) |
Gold | ~$4,078 | $4,164.53 | +$86.67 (+2.13%) |
Gold-Silver Ratio | ~68.5 | ~67.8 | Compressing |
Silver outperformed gold for a second consecutive session — 3.26% against 2.13%. That relative strength is the single most important technical development on the tape, and it is discussed in detail below.
Silver Price Drivers Aug 05 2026
Four forces are behind the move. Anyone assessing the silver price drivers Aug 05 2026 needs to weigh a genuine macro shift against a still-fragile supply-demand backdrop.
1. Strait of Hormuz Diplomacy Is the Dominant Catalyst
The headline driving Wednesday’s precious metals bid is diplomatic progress on reopening the Strait of Hormuz. Investors are assessing a potential deal that would ease the energy chokepoint that has dominated commodity markets through 2026.
The transmission mechanism is worth spelling out, because it is counterintuitive. A Hormuz reopening lowers oil prices, easing inflation expectations and reducing the probability of near-term Federal Reserve tightening. Lower expected policy rates cut the opportunity cost of holding a non-yielding asset. Silver — which pays no coupons or dividends — is a direct and leveraged beneficiary.
So the metal is rallying on the prospect of peace, not the threat of war. That is an unusual configuration for precious metals, and it tells you this move is being driven by the rates channel, not the safe-haven channel.
2. Fed Rate-Hike Odds Repriced From 67% to 57%
The market has cut the probability of a September Federal Reserve rate hike to roughly 57%, down from 67% in the prior session. That ten-point swing is the cleanest quantifiable driver of the three-day rally.
Real yields do the heavy lifting for silver. Every basis point that comes out of expected policy rates — with inflation expectations falling more slowly — compresses real yields and mechanically supports the metal. This is the same dynamic that carried silver through the first half of 2026, running in reverse from the spring correction.
3. Mine Supply Economics: Puna’s Cost Floor Is Now Far Below Spot
The supply picture, as shown in SSR Mining’s Q2 2026 results, has become materially more favorable as silver has rallied.
At Puna in Argentina — which management describes as Argentina’s largest producing silver mine — the reported Q2 2026 figures were:
Silver production: 1.661 million ounces
Cost of sales: $28.77 per ounce
All-in sustaining cost (AISC): $29.52 per ounce
Full-year 2026 silver guidance: 6.25 – 7.00 million ounces
Full-year cost of sales guidance: $22.30 – $24.30 per ounce
Against a silver spot price per ounce Aug 05 2026 of $61.45, Puna is now clearing approximately $31.93 per ounce of all-in margin — 52.0% of the spot price. Yesterday, that figure was $29.99. A single session’s move added nearly $2.00 an ounce of margin to every ounce the mine produces.
SSR raised Puna’s growth capital guidance from $18 million to $20 million to advance life-of-mine extension work: additional laybacks at the Chinchillas pit, the Melina open-pit target, and continued advancement of the Cortaderas project. The resource backing those decisions is substantial — 18.0 million ounces of silver in mineral reserves across the Chinchillas/Melina opportunity, and 15.7 million ounces of silver plus 248.8 million pounds of zinc in measured and indicated resources at Cortaderas.
The critical caveat, and it connects directly to today’s catalyst: SSR disclosed that a $10-per-barrel increase in oil would add roughly $10 per ounce to costs even with hedges in place. This is the hidden elegance of the Hormuz story for silver miners. A reopening does not just support the metal price through the rates channel — it simultaneously lowers the cost side. Producers get margin expansion from both directions at once. That is a genuinely rare setup, and it is why silver mining equities warrant close attention this week.
For reporting context: SSR uses a fixed 63:1 silver-to-gold conversion ratio effective January 1, 2026, with 2026 production weighted 80% gold and 20% silver. Puna’s 1.661 Moz equated to 26,358 gold-equivalent ounces against consolidated Q2 output of 101,959 GEOs. Company-wide AISC guidance was raised to $2,180–$2,260 per gold-equivalent ounce, reflecting sector-wide cost inflation.
4. Industrial Demand: The Constraint Nobody Is Pricing
Here is the counterweight, and it is the most underappreciated of the silver price drivers Aug 05 2026.
Eastman Kodak’s Q2 2026 presentation flagged “elevated commodity costs, particularly for aluminum and silver,” as a persistent drag on profitability. The company disclosed that inventory rose $37 million during the quarter, “driven partly by silver prices that more than doubled from year-end levels.”
That is not analyst commentary — it is an audited disclosure from a company that physically consumes silver. Management warned that “inflationary pressures across input and operating costs may make it difficult to sustain the margin gains achieved in recent quarters,” while noting that “gross margin expansion may persist if pricing discipline can offset commodity pressures.”
Translate that: a manufacturer is publicly signaling it may not be able to fully pass silver costs to customers. Roughly half of silver demand is industrial — photovoltaics, electronics, brazing, photographic media. When industrial buyers hit their pass-through ceiling, they substitute, thrift, or reduce volumes. That introduces a demand brake that pure monetary metals like gold never face.
It is the reason silver rallies harder than gold and corrects harder. Today it is working in silver’s favour. At some price, it will not.
Silver Price Rally 2026 Aug: Precious Metals Market Context
Framing the silver price rally 2026 Aug precious metals market move correctly is essential to avoid misreading it.
Silver entered 2026 in the low $30s, spiked to an all-time high of $121.64 in January 2026, then gave back more than half that advance through spring and early summer. The current $61.45 print sits:
+90.6% above the 52-week low of $32.24
–49.5% below the January all-time high
+62.39% year over year
–0.95% over the past month
+6.06% over the last three sessions
The August move is a counter-trend recovery inside a larger correction that is now testing whether it can become something more. The $60 reclaim is the first genuine piece of evidence for the bulls in weeks — but one handle does not reverse a 50% drawdown.
Consensus forecasting remains measured. Current projections put silver at approximately $59.66 by the end of Q3 2026 and around $70.87 on a 12-month horizon. Note what that implies: the market expects the current rally to give back some ground near term, then grind higher over the following year. Today’s price is running slightly ahead of the quarter-end consensus.
Silver vs Gold: The Relative Strength Signal
Instrument | Level (Aug 05) | Daily Change |
Spot Gold | $4,164.53 / oz | +2.13% |
Spot Silver | $61.45 / oz | +3.26% |
Gold-Silver Ratio | ~67.8:1 | Compressing |
Silver outperforming gold by 113 basis points on the day, for a second consecutive session, is the tell. Historically, silver leadership during precious-metals advances signals broadening speculative participation rather than narrow safe-haven flow. It is one of the more reliable early indicators that a metals move has genuine breadth. Track how this transmits to producer equities through our gold and precious metals coverage.
Gold-Silver Ratio: Reading the Aug 05 2026 Signal
With gold at $4,164.53 and the current silver spot price Aug 05 2026, at $61.45, the gold-silver ratio stands at roughly 67.8:1, compressed from ~68.5 yesterday.
Historical context:
20th-century average: ~47:1
Post-2000 average: ~65:1
March 2020 pandemic spike: above 120:1
At 67.8, silver is trading marginally above its post-2000 mean and materially below its 20th-century average. The ratio is compressing, meaning silver is gaining on gold. Ratio traders watch the direction as much as the level: sustained compression from here would confirm the rotation into silver that the price action is already implying.
Technical Picture: Key Levels After the $60 Reclaim
Traders monitoring the silver spot price Aug 05 2026 should mark these levels:
Support
$60.00 — the newly reclaimed handle; now the first line of defense. Holding it converts resistance into support and validates the breakout
$59.50 — Tuesday’s close and the breakout base
$57.00 — early-August swing low; a break here invalidates the rally entirely
$50.00 — major structural support
Resistance
$62.00–$63.00 — the late-July consolidation shelf. This is the immediate test and the price is knocking on the door
$70.87 — aligns with the 12-month consensus forecast
$76.00 — the May 2026 breakdown zone and the first genuinely heavy overhead supply
The structure is constructive. Momentum indicators recovered from the deeply oversold readings of the spring washout — RSI printed in the low 20s at the lows — leaving room to run before conditions become stretched. The $62–$63 band is the real test. Clearing it opens a technical vacuum toward the low $70s.
What This Means for Silver Mining Stocks
The spread between the silver price, Aug 05 2026, the current spot quote, and the producer’s all-in sustaining costs is the entire equity thesis.
At $61.45 spot against Puna’s $29.52 AISC, SSR Mining is clearing roughly $31.93 per ounce — a 52.0% margin — on what is, by the company’s own weighting, only 20% of its production profile. Applied to the 6.6 million ounce midpoint of full-year guidance, that spread implies meaningful segment-level cash generation.
Three takeaways for investors tracking natural resource equities:
Operating leverage is extreme and currently favorable. A move from $61.45 to $70 is a 13.9% metal move but a 26.8% margin move for a $29.52-cost operation. This asymmetry is why silver equities routinely outrun the metal.
Today’s catalyst compresses costs and lifts revenue simultaneously. SSR’s own disclosure — $10/bbl of oil equals ~$10/oz of cost — means a Hormuz reopening is a double tailwind for producers. Watch energy prices as closely as the silver tape.
Reserve replacement is being funded from cash flow. The $18M-to-$20M growth capital increase at Puna, targeting Chinchillas laybacks, Melina, and Cortaderas, is a counter-cyclical investment that only happens when margins are genuinely healthy. Structurally bullish for medium-term production — and a mild long-term headwind for prices as new supply arrives.
What to Watch Next
Hormuz deal confirmation or collapse — the entire three-day rally is built on this. A breakdown reverses it fast
September FOMC pricing — currently 57% odds of a hike; every repricing moves real yields and silver with them
Oil prices — the rare variable that moves silver revenue and mining costs in the same direction
The $62–$63 resistance band — a clean break is the technical confirmation bulls need
Industrial user disclosures — more Kodak-style margin warnings would flag demand elasticity engaging
ETF flows — SLV and SIVR holdings remain the cleanest read on Western investment demand
Frequently Asked Questions
What is the current silver price Aug 05 2026?
As of Aug 05, 2026 at 3.00 AM EDT, spot silver is $61.45 per troy ounce, up $1.94 (+3.26%) from Tuesday’s $59.51 close. That equals $1.98 per gram and $1,975.66 per kilogram.
What is the silver spot price per ounce Aug 05 2026 in USD?
The silver price Aug 05 2026 usd per ounce is $61.45, marking a decisive reclaim of the $60 handle and a third consecutive session of gains.
Why is silver rising on Aug 05 2026?
Diplomatic progress on reopening the Strait of Hormuz has eased inflation expectations and cut September Fed rate-hike odds to 57% from 67%. Lower expected real yields reduce the opportunity cost of holding non-yielding silver. Silver’s industrial demand profile amplified the move relative to gold.
How much has silver gained in the August 2026 rally?
The silver price rally 2026 Aug precious metals market move has added $3.51 an ounce over three sessions, a gain of 6.06% from Monday’s $57.94 close. Year over year, silver is up 62.39%.
Is silver still below its record high?
Yes. Silver remains 49.5% below its January 2026 all-time high of $121.64, despite trading 90.6% above its 52-week low of $32.24.
What does it cost to mine silver in 2026?
SSR Mining’s Puna operation in Argentina reported Q2 2026 all-in sustaining costs of $29.52 per ounce, with full-year cost of sales guidance of $22.30–$24.30 per ounce — roughly half the current spot price.
How does the silver price affect industrial companies?
Eastman Kodak’s Q2 2026 filing showed a $37 million inventory build driven partly by silver prices that “more than doubled from year-end levels,” with management warning that recent margin gains may be difficult to sustain. It is a live example of industrial silver cost pass-through pressure.
What is the gold-silver ratio on Aug 05 2026? Approximately 67.8:1, with gold at $4,164.53 and silver at $61.45 — compressed from ~68.1 the prior session, indicating silver is gaining on gold.
Where is silver forecast to trade next?
Current consensus projections put silver near $59.66 at the end of Q3 2026 and approximately $70.87 on a 12-month view, implying some near-term give-back before a longer grind higher.