






















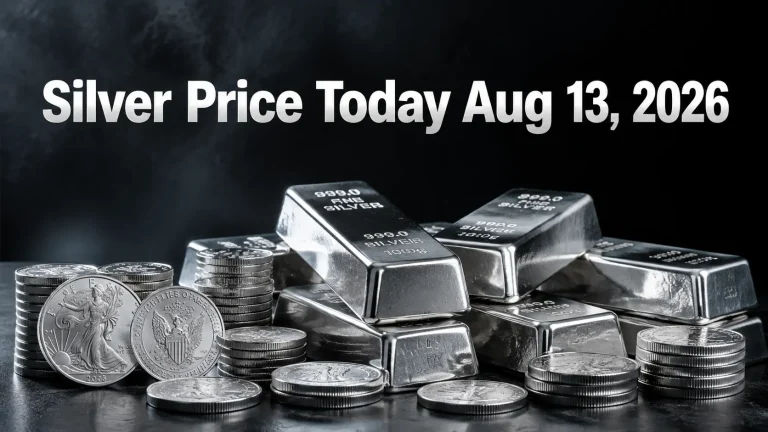
As of Aug 13, 2026, at 2:10 AM EDT, Silver is changing hands at $65.57 per troy ounce. Translated into U.S. dollars across smaller weights, that works out to $2.11 for a single gram and $2,107.96 for a full kilogram. Quotes on this metal reprice tick by tick, shaped by investor positioning, physical offtake, currency swings, and the macro calendar.
Silver Spot Price Table – Aug 13, 2026
|
Silver Price |
Price |
Change |
|
Silver Price Per Ounce |
$65.57 |
+$0.63 |
|
Silver Price Per Gram |
$2.11 |
+$0.02 |
|
Silver Price Per Kilo |
$2,107.96 |
+$20.25 |
Quotes refresh around the clock. Reading captured 08/13/2026, 2:10 AM EDT.
Silver Spot Price Aug 13 2026: Where the Market Stands
At $65.57 per troy ounce, the current silver price Aug 13 2026 has added $0.63, a gain of 0.97% against the prior settlement of $64.935. The metal began the session at $64.86 and has since covered a band of $64.82 to $65.94, pressing back toward the $66.00 area that turned buyers away earlier in the week.
The complete data set for the silver price Aug 13 2026 current market looks like this:
|
Metric |
Value |
|
Last Price (USD/oz) |
$65.57 |
|
Daily Change |
+$0.63 (+0.97%) |
|
Open |
$64.86 |
|
Previous Close |
$64.935 |
|
Day’s Range |
$64.817 – $65.938 |
|
52-Week Range |
$36.96 – $121.79 |
|
Volume |
5,167 contracts |
|
Gold/Silver Ratio |
~67.4 : 1 |
|
Trend (SuperTrend) |
Bullish above $62.13 |
|
Data Timestamp |
Aug 13, 2026 · 2:10AM EDT |
Bottom line up front: the silver spot price per ounce Aug 13 2026 is inching forward on cooler U.S. inflation numbers and steady haven buying, though oscillators are running hot. Over the trailing year the metal has tacked on roughly 72%, ranking among the strongest performances anywhere in the precious metals market this cycle.
For continuously updating charts across the metals complex, visit Natural Resource Stocks.
Silver Price Aug 13 2026 USD Per Ounce: Converted Units
Silver trades in troy ounces of 31.1035 grams, which is why buyers outside the futures pit usually want the metric math done for them. Below, the silver price Aug 13 2026 usd per ounce is broken out across the weights that matter to coin buyers, jewelers, refiners, and industrial purchasers.
|
Unit |
Weight |
Silver Price (USD) |
Daily Change |
|
Troy Ounce |
31.1035 g |
$65.57 |
+$0.63 |
|
Gram |
1 g |
$2.11 |
+$0.02 |
|
10 Grams |
10 g |
$21.08 |
+$0.20 |
|
Tola |
11.6638 g |
$24.59 |
+$0.24 |
|
Kilogram |
1,000 g |
$2,107.96 |
+$20.25 |
|
100 oz Bar |
3,110.35 g |
$6,556.50 |
+$63.00 |
|
1,000 oz Bar |
31,103.5 g |
$65,565.00 |
+$630.00 |
Physical product rarely changes hands at the raw quote. Expect dealers to add 12% to 25% on top of the current silver price Aug 13 2026 for sovereign coins such as American Silver Eagles, while heavy 100-ounce cast bars sit nearest to the underlying figure.
Silver Price Drivers Aug 13 2026: The Forces Behind the Move
Today’s advance traces back to four separate catalysts. Reading these silver price drivers Aug 13 2026 tells you considerably more than the closing quote does, because each one carries its own time horizon and its own capacity to reverse.
1. A Cooler CPI Print Trims September Fed Hike Odds
Consumer prices in the United States climbed 0.1% for July, landing exactly where forecasters had it, and the year-over-year pace slipped to 3.4% from 3.5%. Traders responded by pulling the implied probability of a September Federal Reserve hike back to about 40%, versus 54% only a week ago, based on CME Group’s FedWatch tool.
Of everything on this list, that repricing carries the most weight for the silver spot price Aug 13 2026. Because the metal throws off no interest or dividend, a flatter expected policy path makes it cheaper to own in relative terms. Most desks now assume the Fed sits on its hands until the August inflation report lands, which leaves a soft cushion beneath the market.
2. A Motionless Dollar and Steady Yields
The U.S. Dollar Index barely budged, finishing at 99.93 (+0.02%), while the 10-year Treasury benchmark ticked up 0.62 basis points to 4.688%. Against the yen, the greenback eased 0.06% to 159.32 as traders weighed the possibility of earlier tightening from the Bank of Japan.
A dollar going nowhere is quietly helpful for the current silver price Aug 13 2026. It strips out the currency drag that normally weighs on dollar-priced commodities and hands control back to metal-specific supply and demand.
3. Haven Demand Stays Well Supported by Geopolitics
A cluster of flashpoints continues to draw defensive money into the precious metals market:
- Red Sea shipping: A Houthi strike on a merchant vessel killed four Egyptian crew members, the first loss of life at sea from such an attack since hostilities with Iran opened on February 28.
- U.S. naval action: American forces hit a cargo ship that was reportedly making its way toward a port in Iran.
- Korean Peninsula: Pyongyang sent a ballistic missile into waters off the east coast in the run-up to joint Seoul–Washington drills.
- Taiwan Strait: Taipei issued a sharp rebuke over scheduled Chinese and Indonesian naval exercises in the waters to its east.
Capital.com senior market analyst Kyle Rodda characterized the mood as “lukewarm,” pointing to unresolved geopolitical risk and a market marking time ahead of the U.S. inflation release. Risk premiums of this type seldom deliver one dramatic surge; what they build instead is a floor. That floor is doing genuine work under the silver price Aug 13 2026 current quote.
4. Gold’s Firmness and What the Ratio Signals
Spot gold added 0.28% to reach $4,419.28/oz, with the futures board stronger still. That leaves the gold/silver ratio around 67.4:1. The measure has tightened considerably as this cycle has progressed, which historically marks the phase where silver begins to lead gold as industrial buying stacks on top of the monetary case.
Follow how bullion is trading in parallel with silver through the gold and precious metals coverage on Natural Resource Stocks.
Silver Price Rally 2026 Aug Precious Metals Market: The Wider View
The silver price rally 2026 Aug precious metals market narrative did not begin this morning. The metal has put on close to 72% across the trailing twelve months, and a 52-week band running from $36.96 to $121.79 shows just how forcefully it has swung in both directions.
Four structural currents sit beneath the move:
A demand deficit that will not close. Solar panel manufacturing, electric vehicle assembly, 5G buildouts, and the electronics feeding AI data centers have all held industrial consumption at elevated levels for years running. Gold mostly gets stored; roughly half of all silver gets used up, which drains the visible pool a little further with every deficit year.
Portfolios hedging currency debasement. Annual inflation at 3.4% still sits above the Fed’s 2% objective, leaving real returns on cash close to nothing. That keeps a steady trickle of capital rotating out of paper and into hard assets.
Supply that cannot flex. Roughly seven ounces in every ten arrive as a secondary output from copper, lead, zinc, and gold operations rather than from dedicated silver mines. Producers therefore cannot lift output simply because the price has risen, so the market rations through price instead.
Financialization and squeeze potential. Lean exchange inventories combined with crowded ETF and futures books mean silver tends to travel in bursts rather than glide. A 52-week peak near $121.79 against today’s $65.57 is a standing reminder that the violence cuts both ways.
Investors hunting equity leverage to the theme typically start by screening producers and developers. The mining company news and press release hub tracks the names most exposed to this move.
Silver Technical Analysis – Aug 13, 2026
The charts are where the case for caution lives. Silver finished a V-shaped base at $55.00, ran to $66.00, and cleared the 61.8% micro-Fibonacci marker at $65.50, only to walk straight into a thick band of overhead supply.
Key Resistance Levels
|
Level |
Significance |
|
$65.84 |
Upper Bollinger Band — immediate cap |
|
$66.00 |
Round-number psychological resistance |
|
$68.20 |
Macro 38.2% Fibonacci retracement |
|
$72.00 |
Prior structural high |
|
$76.00 |
Macro 50% Fibonacci retracement |
Key Support Levels
|
Level |
Significance |
|
$63.15 |
23.6% Fib / SMA(20) confluence — first buy zone |
|
$62.13 |
SuperTrend line — trend flips on a break |
|
$62.00 |
Bull invalidation; a close below breaks the trend |
|
$61.50 |
Logical stop-loss placement |
|
$60.73 |
SMA(200) — major structural support |
Momentum Readings
- RSI: 74 — well inside overbought territory
- MACD: 1.40 vs. signal 1.24 — positive, but extended
- Price sits 4.65% above the SMA(20) — signaling near-term exhaustion
- SuperTrend: green at $62.13 — the dominant uptrend has not broken
- Volume: expanding on upward pushes, which confirms the direction
What it adds up to: the framework is still constructive, yet the odds of a shakeout are elevated. Chart watchers point to the $63.15 pocket as a far more forgiving place to engage than paying up at $66.00. Anyone taking on risk at current levels is better served building the position in pieces and moving stops up behind it.
Silver Price Forecast: The Calendar Ahead
Where the silver spot price per ounce Aug 13 2026 heads next comes down to a short list of triggers:
- The August CPI report — back-to-back soft readings would likely drag September hike odds under 30% and clear a path to $68.20.
- Fed speakers — hawkish resistance to the market’s dovish lean is the clearest threat to the upside case.
- The Dollar Index at 100 — pushing decisively through that line would put a lid on silver; slipping under 99 would light a fire under it.
- Escalation risk — additional incidents in the Red Sea or off Korea would rebuild the haven premium in short order.
- The $62.00 marker — a weekly close beneath it tears up the bullish read and turns attention to the SMA(200) at $60.73.
Working assumption: range trade between $63.15 and $66.00 while an overheated RSI unwinds, with a clean break of $65.84 opening $68.20.
How the Silver Spot Price Gets Set
No single venue publishes the silver spot price Aug 13 2026. The figure is backed out of the most heavily traded near-dated futures contract, chiefly COMEX in New York, with the London over-the-counter market and the Shanghai Gold Exchange filling in around it. Together they keep a quote live for roughly 23 hours a day, from Sunday evening through the Friday close in New York.
A few mechanics are worth carrying with you:
- Spot against futures: Spot covers immediate delivery; futures build in the cost of carry. On a day like today the two sit close together.
- Bid/ask spread: The distance between what a dealer will pay and what they will charge. It widens when liquidity thins out.
- Dealer premium: The markup layered on top of the current silver price Aug 13 2026 to cover minting, fabrication, and distribution.
- The troy ounce: 31.1035 grams, noticeably heavier than the 28.35-gram avoirdupois ounce used for groceries.
Frequently Asked Questions
What is silver trading at on Aug 13, 2026?
As of 12:43 AM EDT, the current silver spot price Aug 13 2026 stands at $65.57 per troy ounce, a session gain of $0.63 or 0.97%. Broken down by weight, that is $2.11 per gram and $2,107.96 per kilogram.
Silver price Aug 13 2026 USD per ounce — what is the exact figure?
The silver price Aug 13 2026 usd per ounce reads $65.57. The session opened at $64.86, ranged between $64.82 and $65.94, and follows a previous close of $64.935.
Why is silver moving higher today?
The dominant silver price drivers Aug 13 2026 are a cooler U.S. July CPI reading of 3.4% annually, September Fed hike odds sliding to roughly 40%, a flat Dollar Index at 99.93, and persistent geopolitical strain spanning the Red Sea, the Korean Peninsula, and the Taiwan Strait.
Has silver become overbought?
On short-horizon indicators, yes. RSI has reached 74 and the price is running 4.65% clear of its 20-day moving average, both of which point to fatigue. The broader uptrend stays intact for as long as silver defends the SuperTrend line at $62.13.
Where does the gold-to-silver ratio stand?
Gold at $4,419.28 against silver at $65.57 puts the ratio near 67.4:1. When that number contracts, it tells you silver is outpacing gold.
What has silver returned over the last twelve months?
The metal is up in the region of 72% year over year, which makes the silver price rally 2026 Aug precious metals market one of the defining commodity stories of this cycle.
Which price levels should silver traders watch?
Overhead, the first hurdle is $65.84 at the upper Bollinger Band, followed by $68.20 and $72.00. Beneath the market, the levels to know are $63.15, $62.13, $62.00, and the SMA(200) at $60.73.
How frequently do silver quotes update?
Constantly. The silver spot price Aug 13 2026 reprices second by second across a roughly 23-hour global session, moved by futures order flow, currency shifts, scheduled economic data, and physical demand.