
























Gold prices hit $2,500 per ounce in 2026, driven by persistent inflation and geopolitical tensions. At Natural Resource Stocks, we’ve identified the top gold stock picks that offer real value for investors navigating this volatile market.
This guide breaks down which mining companies deliver strong returns, what metrics matter most, and how to build a portfolio that works for your goals.
Gold Market Dynamics and Mining Economics in 2026
Current Gold Prices and Analyst Forecasts
Gold trades around $4,186 per ounce as of August 2026, up 0.81% on the day according to Yahoo Finance. This price reflects a market shaped by three concrete forces: central bank demand, currency weakness, and geopolitical risk. In July, HSBC lowered its gold price forecast for 2026 to $4,560 per troy ounce, while J.P. Morgan also provided guidance-all citing expectations that the U.S. Federal Reserve will hold rates steady rather than cut them in 2026. When interest rates stay elevated, gold becomes less attractive relative to bonds, which explains why these forecasts cluster in the $4,000 to $4,900 range.
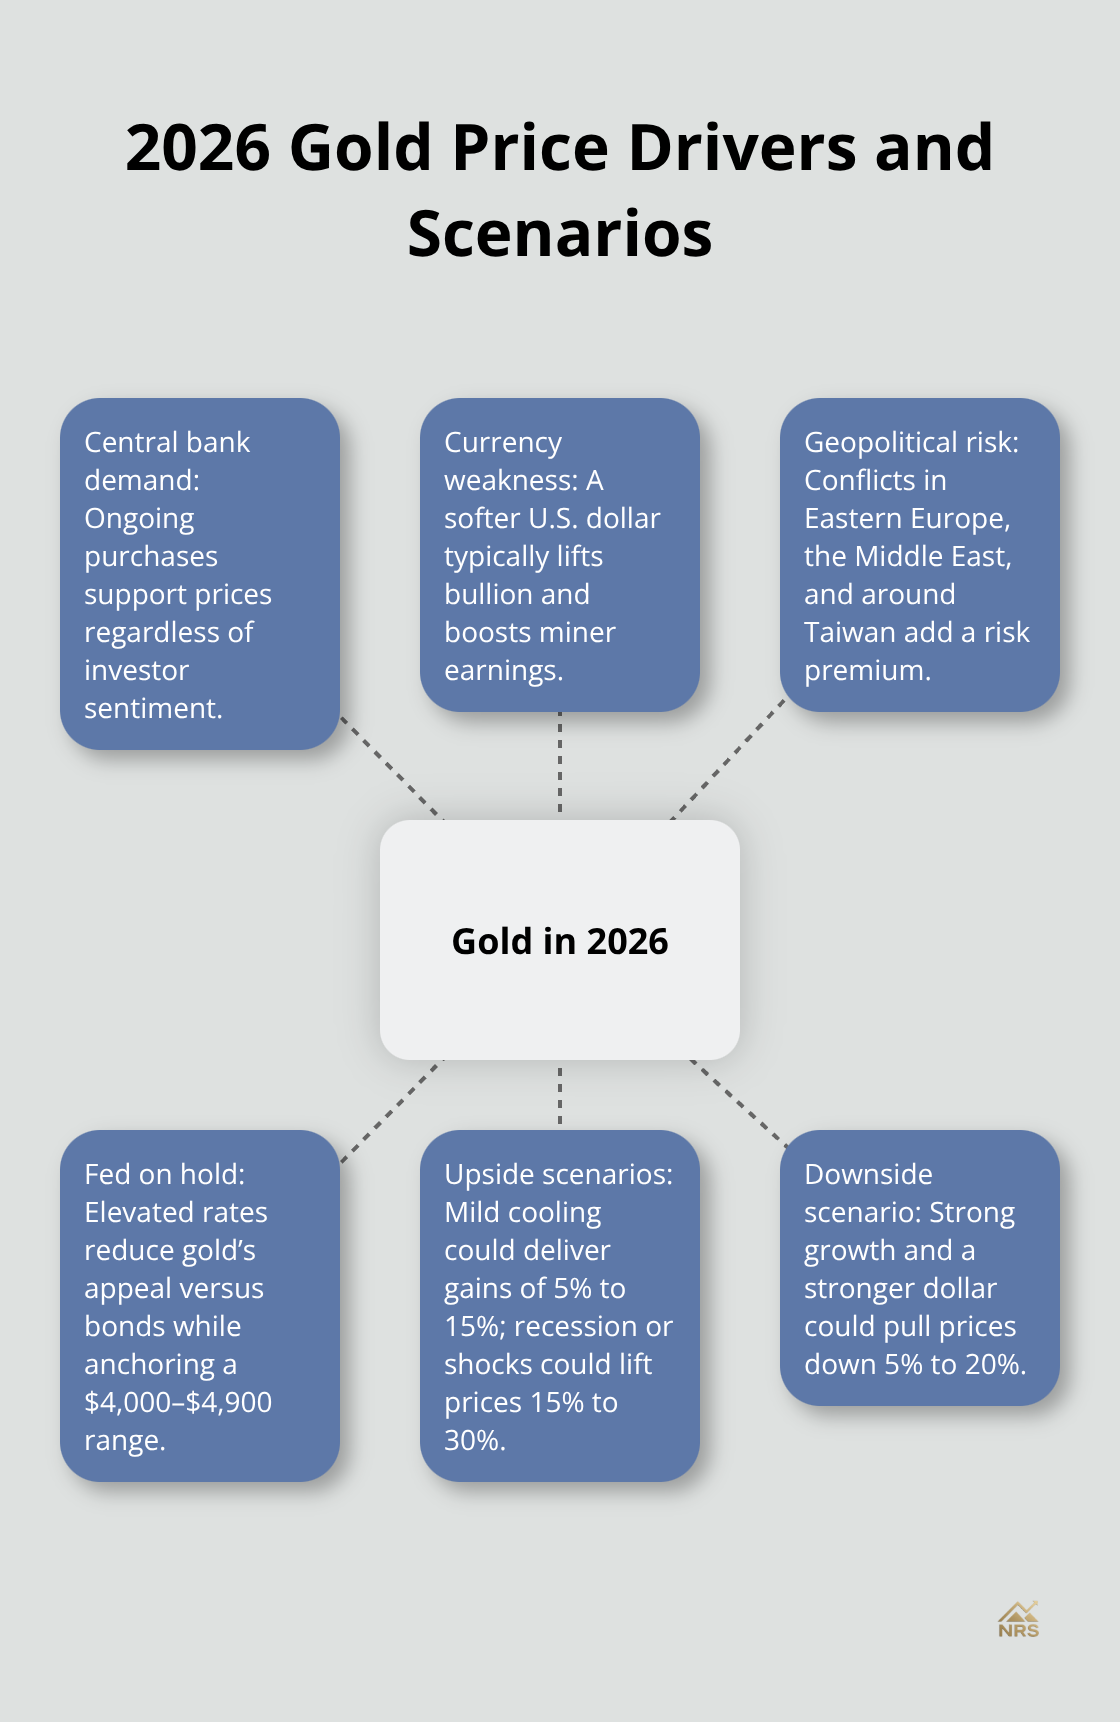
The World Gold Council’s 2026 outlook presents three scenarios: mild economic cooling could push gold up 5% to 15%, global recession or geopolitical shocks could drive gains of 15% to 30%, and strong growth paired with a stronger dollar could pull prices down 5% to 20%.
How Production Costs Drive Mining Profitability
Gold mining economics depend heavily on what miners pay to extract each ounce. Most producers report all-in sustaining costs (AISC) ranging from $1,375 per ounce down to $915 per ounce for integrated operations, meaning a miner with $1,200 per ounce costs locks in profit at current price levels while a producer with $1,600 per ounce costs operates with minimal margin. Ore grade directly impacts this equation: lower grades force miners to process larger volumes of rock, driving up energy, water, and chemical expenses. Historical data shows the easy gold era ended decades ago; South African gold output has halved since 1998, and North American production fell to 78% of 2002 levels, reflecting depleted shallow deposits and the shift toward deeper, costlier mining. New discoveries have declined sharply, with finding costs up 2.6 times since the 1980s, meaning reserve replacement has become the critical filter for stock selection. Focus on companies reporting declining AISC trends and transparent reserve replacement programs rather than betting on price appreciation alone.
Reserve Quality and Long-Term Mine Life
Reserve estimates determine whether a mining operation sustains profits over decades or faces closure within years. A 20% rally in gold prices can generate far larger percentage gains in mining stocks with low production costs and solid reserves, creating what the industry calls gearing or leverage to the underlying commodity. This amplification works both ways: a price decline hits miners harder than bullion holders. Currency translation also matters; many miners incur costs in local currencies while selling in U.S. dollars, so exchange rate movements can widen or compress reported profits independent of the gold price itself. Transparent reporting on reserve replacement and ore grades separates quality operators from those gambling on commodity upswings.
Central Banks and Geopolitical Support
Central bank gold purchases remain a structural support for prices. These institutions view gold as uncorrelated to fiat currencies and inflation hedges, creating demand independent of investment sentiment. Geopolitical tension in Eastern Europe, the Middle East, and around Taiwan adds risk premiums that benefit bullion. The weaker U.S. dollar earlier in 2025 supported bullion, and any further currency weakness in 2026 would likely extend gains. These macro drivers translate directly into earnings for miners with disciplined capital allocation and strong balance sheets, setting the stage for evaluating which specific companies offer the best risk-adjusted returns.
Which Gold Stocks Deliver Real Returns in 2026
Cash Flow Leaders: Caledonia Mining
Caledonia Mining (CMCL) stands out as the clearest near-term cash generator among gold miners tracking in 2026. The company produced over 19,000 ounces in Q3 2025 at its Blanket mine, delivering Q3 gross profit of $36.9 million and free cash flow of $5.9 million on revenue of $71.4 million. CMCL trades at 9.7x forward earnings with a forward dividend yield of 1.95% and a payout ratio under 20%, meaning shareholders receive payments while the company retains capital for growth projects at Bilboes and Motapa. The 52-week gain of 226% reflects recognition that Blanket’s steady output combined with a rising gold price creates predictable earnings power. A Strong Buy rating with a $45 price target implies roughly 55% upside from current levels, according to analyst consensus, making CMCL the pick for investors seeking immediate income paired with growth optionality.
Production Inflection: Alamos Gold
Alamos Gold (AGI) offers scale and multi-year production expansion that justifies a different risk profile. Q3 2025 production hit 141,700 ounces at an all-in sustaining cost of $1,375 per ounce, generating $462.3 million in revenue and $130.3 million in free cash flow. More important, the Island Gold District integration with Magino targets 411,000 ounces annually for the first 12 years at just $915 per ounce AISC, a dramatic improvement that compounds earnings as volumes rise and costs fall. AGI expects Q4 2025 production of 157,000 to 177,000 ounces, with the Lynn Lake project due by 2029 adding another 176,000 ounces yearly. The 119% gain over 52 weeks and a Strong Buy rating with a $47.22 target suggest 12% near-term upside, but the real value lies in 2026 and 2027 when these integration benefits materialize.
Royalty Model: Gold Royalty
Gold Royalty (GROY) provides a third angle: royalty-based exposure without direct mine operating risk. GROY surged 257% over 52 weeks after completing the Pedra Branca deal with BHP in December 2025, paying $70 million for a 25% net smelter royalty on gold and a 2% royalty on copper from BHP’s Brazilian asset. Q3 2025 adjusted EBITDA reached $2.5 million on just $4.1 million in revenue, demonstrating the margin power of royalties. GROY trades at a forward P/E of 74x, reflecting growth expectations as Pedra Branca ramps production, and a Strong Buy rating with a $5.11 target signals 14% upside. For investors uncomfortable with operational leverage, GROY’s royalty model transfers mining risk to operators while capturing upside from their output.
Major Producers and Entry Points
Newmont Corporation (NEM) and Freeport-McMoRan (FCX) represent the major-producer tier with realistic entry points in 2026. NEM trades near $97.73 with a 1-year analyst target of $129.27, implying 32% upside potential, while carrying a $102.98 billion market cap and a 6.18% weight in the sector. FCX sits at $67.30 with a $71.73 target, suggesting 6.5% near-term appreciation, and a $96.75 billion market cap.
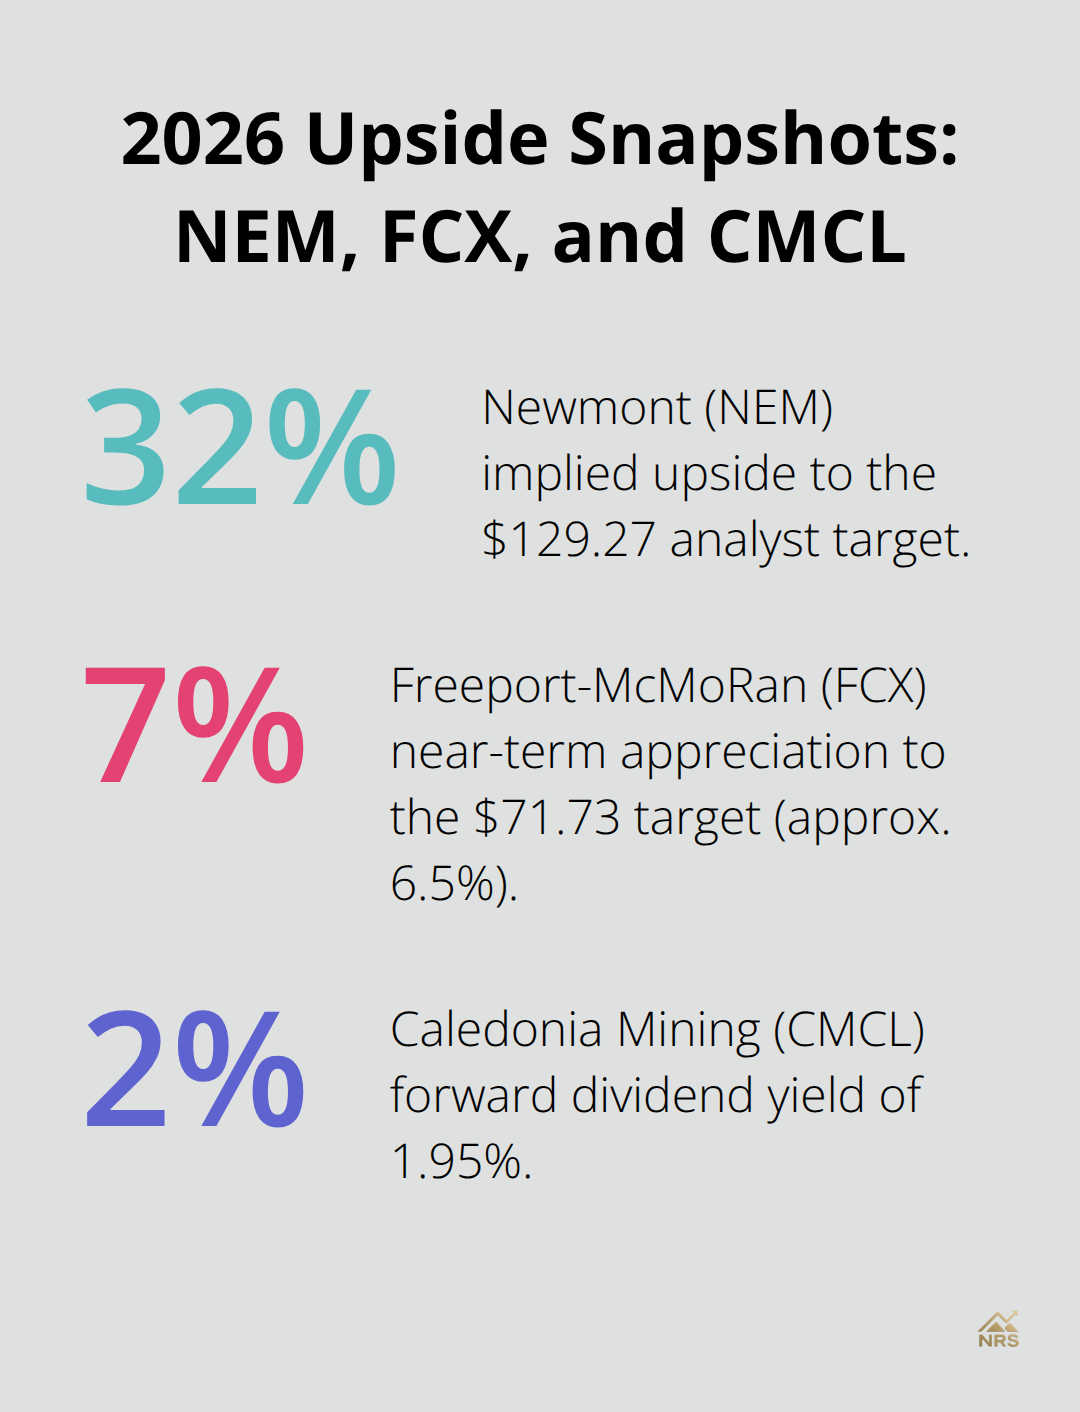
FCX’s 32.51% year-to-date return outpaces NEM’s minus 2.12% decline, reflecting copper’s 43.74% YTD surge alongside gold’s strength. Both names offer the balance sheet strength and reserve depth that reward disciplined investors over market cycles.
Selecting Your Position
For dividend seekers, CMCL’s 1.95% yield combined with sub-20% payout ratios beats the sector’s average and allows reinvestment into growth. AGI’s 0.24% yield reflects its growth-focused capital allocation, appropriate for an operator ramping production. The practical filter: choose CMCL for immediate cash return and near-term upside, AGI for 2026-2027 production inflection and margin expansion, GROY for royalty-based leverage without operational headaches, and NEM or FCX for core positions if you demand scale and proven reserve replacement. Avoid chasing stocks trading well above analyst targets; SCCO at $195.16 sits above its $168.25 target despite a 38.49% YTD gain, signaling caution. The gold sub-sector itself posted a minus 8.97% year-to-date return despite Basic Materials’ 28.60% one-year performance, meaning stock selection matters far more than sector timing in 2026. Understanding which companies control costs and replace reserves separates winners from laggards as gold prices move through 2026 and into 2027.
What Separates Winning Gold Miners from the Rest
Cost Control: The Foundation of Profitability
The difference between a gold stock that compounds wealth and one that destroys it comes down to three measurable factors that separate operators with staying power from those gambling on commodity upswings. All-in sustaining costs (AISC) tell you exactly how much profit remains at current prices. Alamos Gold reported $1,375 per ounce AISC in Q3 2025, but its Island Gold and Magino integration targets $915 per ounce AISC for the first 12 years-a 33% reduction that flows directly to the bottom line as gold prices hold steady or rise. Caledonia Mining’s Q3 2025 gross profit of $36.9 million on $71.4 million revenue reflects tight cost control at Blanket, the foundation for its 1.95% dividend yield and 55% upside to analyst targets.
Historical reality underscores why cost structure matters. South African gold output halved since 1998 and North American production fell to 78% of 2002 levels, all because shallow, low-cost deposits depleted and operators shifted to deeper, costlier mines. A company reporting flat or rising AISC year-over-year signals trouble ahead, while one showing declining costs demonstrates either grade improvement or operational discipline worth owning.
Reserve Replacement: The Sustainability Test
The second filter is reserve replacement, the metric that separates sustainable businesses from extraction schemes. There has been a slow decline since 2006, with both the number of new discoveries and the amount of contained gold trending downwards. Transparent miners publish reserve replacement ratios and ore grade trends in their quarterly filings; anything below 100% replacement of annual production is a red flag that mine life shrinks unless exploration succeeds.
Newmont’s $129.27 analyst target versus its current $97.73 price reflects confidence in its reserve replacement track record, while Southern Copper trading above its $168.25 target despite strong year-to-date gains suggests the market prices in future execution risk. Reserve quality determines whether a mining operation sustains profits over decades or faces closure within years.
Capital Allocation: Where Management Puts Money
Management capital allocation separates disciplined operators from those chasing every shiny project. Caledonia Mining’s 2025 capex plan of $41 million funds sustaining operations at Blanket while advancing Bilboes and Motapa, a balanced approach that rewards shareholders with dividends while building optionality. Alamos Gold’s decision to integrate Island Gold and Magino rather than operate them separately demonstrates conviction in operational synergies, and the $915 per ounce AISC target validates that conviction with concrete numbers.
Royalty companies like Gold Royalty transfer operational risk to miners while capturing upside, as evidenced by its Pedra Branca deal with BHP paying $70 million for a 25% net smelter royalty on gold. This model eliminates the need for operators to manage mine operations directly while still participating in production growth.
Currency and Leverage Effects
Currency exposure matters more than most investors recognize; many miners report costs in local currencies while selling in dollars, so a strengthening dollar compresses reported profits independent of gold prices. A 20% rally in gold prices can generate far larger percentage gains in mining stocks with low production costs and solid reserves, creating what the industry calls gearing or leverage to the underlying commodity. This amplification works both ways: a price decline hits miners harder than bullion holders.
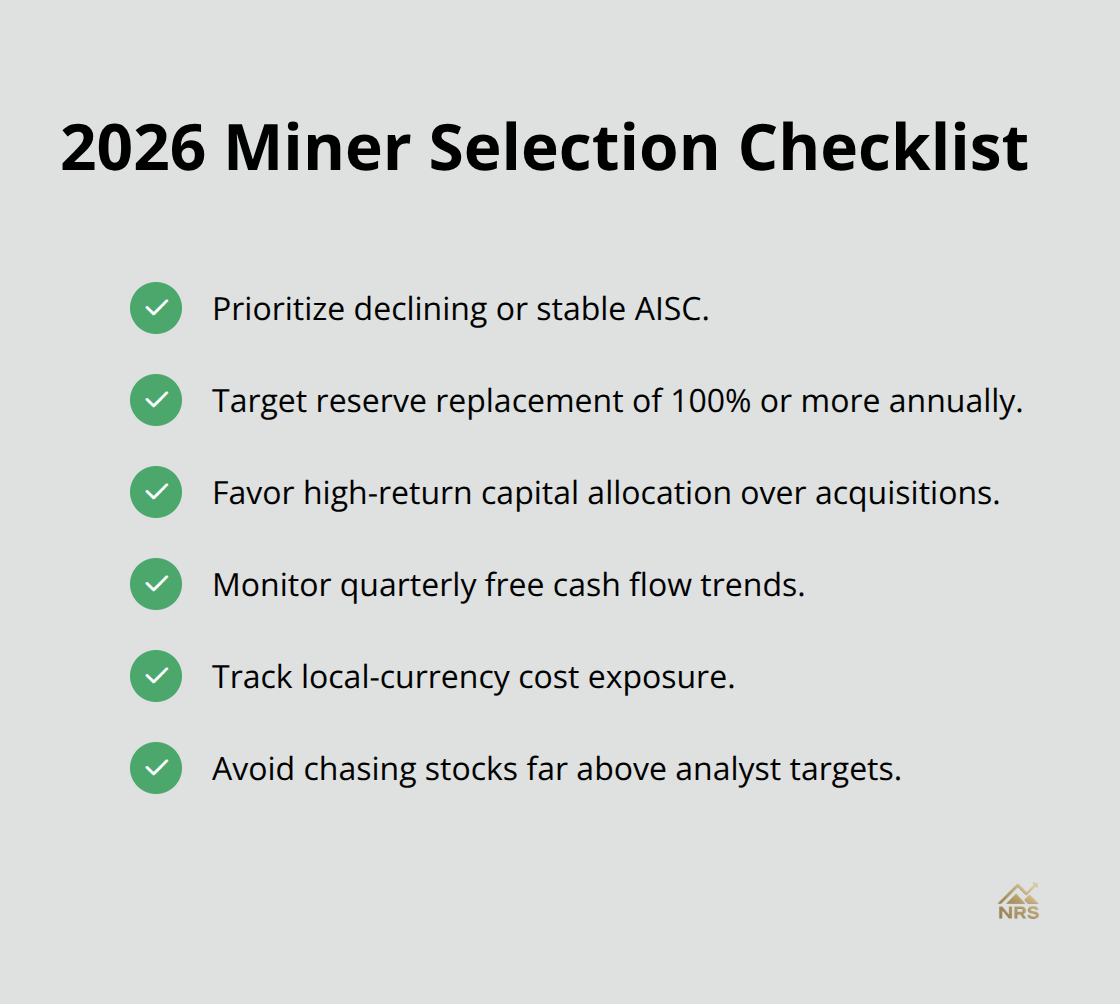
The practical filter for 2026 demands transparent reserve replacement programs, declining or stable AISC, and management teams allocating capital to high-return projects rather than vanity acquisitions. Diversified natural resources portfolios that balance gold miners with other commodities can reduce concentration risk. The gold sub-sector’s minus 8.97% year-to-date return despite Basic Materials’ 28.60% one-year gain proves that stock selection beats sector timing, and disciplined cost control separates the 55% upside opportunities like Caledonia Mining from the crowded middle.
Final Thoughts
Gold’s 2026 outlook rests on three concrete realities: central banks continue buying, geopolitical risk remains elevated, and the U.S. Federal Reserve shows no appetite for rate cuts. These factors support prices in the $4,500 to $4,900 range, creating a favorable backdrop for mining equities. We at Natural Resource Stocks have identified top gold stock picks that capitalize on this environment without requiring perfect timing or commodity forecasting.
The metrics that matter most are all-in sustaining costs, reserve replacement ratios, and capital allocation discipline. Caledonia Mining’s $36.9 million Q3 gross profit on $71.4 million revenue demonstrates how tight cost control generates immediate cash returns, while Alamos Gold’s Island Gold and Magino integration targets $915 per ounce AISC and shows how operational excellence compounds earnings as production scales. Gold Royalty’s Pedra Branca deal with BHP proves that royalty models capture upside without operational headaches, and these three companies represent different risk profiles and return timelines while sharing transparent reporting and disciplined execution.
Start with screening for declining AISC trends and reserve replacement above 100% annually, then monitor quarterly earnings for free cash flow generation and capital allocation decisions. Currency exposure matters; track how much of each company’s costs are denominated in local currencies versus dollars. For deeper analysis and expert commentary on macroeconomic factors affecting gold prices, visit Natural Resource Stocks for video content, market analysis, and community insights that sharpen your stock selection process.