


As of March 5, 2026 at 12:36 AM ET, the live gold spot price for 1 ounce of Gold in U.S. dollars (USD) is approximately $5,160, with prices trading in a recovery range following a sharp mid-week pullback. Gold spot price can fluctuate by the second, driven by investment supply and demand, geopolitical events, and a range of macroeconomic factors.
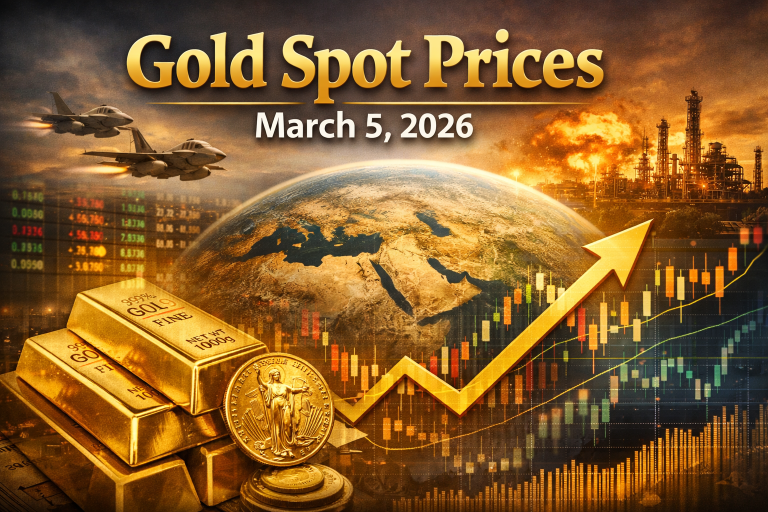
Gold Spot Prices – March 5, 2026
Gold Price | Price (USD) |
Gold Price Per Ounce | ~$5,160 |
Gold Price Per Gram | ~$165.92 |
Gold Price Per Kilo | ~$165,922 |
Live Metal Spot Prices (24 Hours) | Last Updated: 03/05/2026
Note: Gold spot prices update continuously during market hours. Bookmark this page and refresh for the most current gold spot price per ounce on March 5, 2026.
Current Gold Price – March 5, 2026 Market Summary
The current gold price on March 5, 2026, reflects a market in active recovery mode. After gold surged to a multi-week high near $5,400 per ounce at the start of the week — fueled by the outbreak of U.S.-Israeli military strikes on Iran — bullion retreated sharply on Tuesday, March 3, tumbling more than 5% as the U.S. dollar surged and profit-taking swept the market. Gold spot price fell to around $5,050 per ounce, down $277 (−5.16%) on the day during that session, marking one of the sharpest single-day reversals of the year.
However, the sell-off proved short-lived. On March 5, 2026, the gold price is expected to recover after the recent decline, with moderate volatility anticipated this week amid key macroeconomic releases, including initial jobless claims data and other U.S. economic indicators.
The gold spot price on March 5, 2026, is consolidating above critical support, with bulls targeting a retest of the $5,200–$5,311 resistance zone as geopolitical risk remains elevated.
What Is Moving the Gold Price Today? Key Market Drivers – March 2026
1. The U.S.-Iran Conflict: The Primary Catalyst for the 2026 Gold Rally
The dominant force shaping the gold price rally in March 2026 is the escalating military conflict between the United States, Israel, and Iran. The escalating conflict between the United States, Israel, and Iran triggered a historic surge in gold prices, with spot gold blasting past $5,300 per ounce for the first time, exemplifying gold’s timeless role as the ultimate safe-haven asset during geopolitical crises.
The conflict began in earnest on February 28, 2026, when coordinated U.S. and Israeli airstrikes targeted Iranian sites. Gold climbed about 1.37% to $5,350.13 an ounce, with futures up 2.2% to $5,363.10 amid haven demand, as the U.S. and Israel struck Iran, killing Ayatollah Ali Khamenei, prompting vows of retaliation and raising the risk of further escalation.
The subsequent dollar rally on March 3 created a temporary headwind for gold. Independent analyst Ross Norman summarized the dynamic: the dollar was “absolutely roaring away,” along with U.S. Treasuries, providing a strong headwind to gold and particularly silver. Yet the broader structural case for gold remains intact — and analysts were quick to flag upside targets.
BMI, a unit of Fitch Solutions, stated that gold could reach a record high above $5,600 per ounce unless there are clear signs of de-escalation in the Iran conflict, meaning analysts watching this selloff were projecting a potential $450 rebound from the lows within days.
2. Safe-Haven Demand & De-Risking Across Global Markets
Investor behavior in the current environment is being driven by classic risk-off dynamics. The geopolitical shock triggered a classic risk-off move across markets, with equities sliding at the opening bell and crude oil surging, reinforcing demand for bullion as a store of value.
ING analysts noted that a regional spillover or disruption to energy supplies would materially boost gold through higher oil prices, increased inflation expectations, and contained real yields.
Institutional investors are rebalancing their portfolios and shifting to safer assets amid the geopolitical backdrop, with U.S. and Israeli strikes on Iranian territory leading to the consolidation of anti-American forces in the region, worsening amid hardline rhetoric from Iran’s new leadership.
3. Central Bank Buying Continues to Support the Gold Price
Central bank demand remains a powerful structural pillar beneath the gold price in March 2026. Analysts at SP Angel noted that rising geopolitical fragmentation has prompted BRIC central banks to reduce their exposure to dollar-denominated assets in favour of gold, and they expect this theme to continue.
Bullion remains more than 20% higher this year after a 2025 rally of 64%, supported by central bank buying and geopolitical tensions. This institutional demand creates a persistent price floor that limits downside and accelerates rebounds after sharp corrections.
For the first time since 1996, gold now accounts for a larger share of central bank reserves than U.S. Treasuries — a powerful signal of confidence in the metal’s long-term value.
4. U.S. Tariffs and Inflation Expectations
Beyond the Iran conflict, U.S. trade policy is adding a further layer of support to the gold price drivers in March 2026. The U.S. administration’s use of Section 122 to impose universal 10% tariffs is supporting gold prices, with U.S. Trade Representative Jamieson Greer indicating that tariffs could rise to 15% following a new Supreme Court ruling. As a result, more investors are turning to gold as a hedge against systemic risks.
Core producer prices rose by 0.8% in January, marking the strongest monthly increase since mid-2025, which strengthened the U.S. dollar and shifted expectations for the first Fed rate cut to July — yet gold held its ground.
5. Fed Policy and Rate Cut Expectations
The Federal Reserve’s path remains a key variable for the gold price in March 2026. According to CME Group data, the probability of a rate cut to 3.25–3.50% in March stands at just 4.4%, with 95.6% of market participants expecting rates to remain unchanged at 3.50–3.75%, which could limit the upside potential for gold in the near term.
Key upcoming data releases this week could shift those expectations. Investors are watching today’s U.S. initial jobless claims report closely, followed by Friday’s unemployment data, which will further inform the Fed’s trajectory.
6. Trafigura–Venezuela Gold Deal Adds Supply-Side Context
Adding a supply-side dimension to the precious metals market in March 2026, global commodities trading giant Trafigura has been operating in Venezuela following U.S. authorization, as Trafigura and Vitol were providing logistical and marketing services to facilitate the sale of Venezuelan commodities at the request of the U.S. government, operating in full compliance with applicable sanctions and holding all necessary licenses. Reports of a deal involving up to 1,000 kg of gold between Trafigura and a Venezuelan mining firm highlight the growing importance of South American gold flows in the global market — and the complex geopolitical interplay between commodity supply chains and precious metals pricing.
Gold Price Performance: 2026 in Context
To appreciate today’s gold spot price on March 5, 2026, it helps to understand the extraordinary run gold has delivered over the past year and a half.
Gold’s current record high was achieved on January 28, 2026, at $5,602.22 per troy ounce, following a trend of new record-setting highs. The current bull market began when a new high was established on August 7, 2020, with gold passing $2,074 per ounce, primarily driven by the economic uncertainty caused by the COVID-19 pandemic, low interest rates, a weakening U.S. dollar, and increased demand for safe-haven assets.
Gold has notched multiple record highs and climbed nearly 25% so far this year, building on its exceptional 64% jump in 2025, fuelled by robust central-bank purchases, strong inflows into exchange-traded funds, and a shift toward looser U.S. monetary policy.
In short, gold is one of the standout asset performers of this economic era, and the gold price rally in March 2026 remains firmly supported by both cyclical and structural tailwinds.
Gold Price Forecast: What Analysts Are Saying
Major financial institutions remain overwhelmingly bullish on gold’s trajectory. Here is a summary of current analyst targets that are shaping the gold price drivers for March 2026 and beyond:
- JP Morgan: Analysts expect gold prices to rise to $6,300 an ounce by the end of 2026.
- Bank of America: Has reiterated a forecast of $6,000 per ounce for the year.
- Goldman Sachs: Projects continued upside driven by tariff uncertainty, trade war risks, and safe-haven flows.
- UBS / Bloomberg: Several analyst houses, including Bloomberg and UBS, have raised their medium-term price forecasts, with the upper price target now over $6,000 USD per troy ounce — a level that could be reached in the second half of 2026 if geopolitical risks and monetary policy uncertainty persist.
- BMI (Fitch Solutions): Sees potential for gold above $5,600 if the Iran conflict continues without clear de-escalation signals.
- LiteFinance / Technical Outlook: Gold prices are expected to post moderate gains over the next month, with the main drivers of the bullish trend being geopolitical uncertainty, the escalating conflict in the Middle East, and expectations of monetary easing by major central banks. However, a strong U.S. dollar and elevated interest rates may limit the upside.
Key support for the current gold spot price sits in the $5,000–$5,050 range, while resistance is clustered near $5,200 and $5,311. A clean breakout above that zone could target the all-time high near $5,602.
Gold Price Technical Levels – March 5, 2026
Level | Price (USD/oz) |
All-Time High (Jan 28, 2026) | $5,602.22 |
Key Resistance | $5,311 |
Resistance | $5,200 |
Current Spot Price (March 5) | ~$5,160 |
Key Support | $5,050 – $5,000 |
Strong Support | $4,996 |
Gold vs. Other Precious Metals Today
Gold is not the only precious metal worth watching in today’s market. Here is how the broader precious metals complex is trading as of March 5, 2026:
- Silver: After briefly surging above $90/oz earlier this week on safe-haven flows, silver pulled back sharply. Silver prices shed 6.7% to $87.5795 per ounce, while platinum slipped 2.1% to $2,324.65/oz in recent sessions. Silver’s higher volatility relative to gold reflects its dual role as both a safe-haven and an industrial metal.
- Platinum: Broadly weaker amid the same profit-taking dynamics.
- Copper: Benchmark copper futures on the London Metal Exchange settled 0.3% higher at $13,343.50 a ton, while U.S. copper futures slipped 1.5% to $5.9690 a pound.
The gold-silver ratio remains elevated, signaling that gold is outperforming silver in the current risk environment — a typical pattern during acute geopolitical uncertainty.
Why Is the Gold Price So High in 2026?
Investors searching for the current gold spot price on March 5, 2026 may be wondering what has driven gold to these historically elevated levels. The answer lies in a rare confluence of factors that have all aligned in gold’s favor simultaneously:
- Geopolitical crisis: The U.S.-Iran conflict is the most acute driver right now, creating enormous demand for safe-haven assets.
- Central bank de-dollarization: Nations across the developing world accelerated gold purchases to diversify reserves away from dollar dependence and protect against currency volatility, with this institutional demand creating a floor under gold prices.
- ETF inflows: Physical gold-backed ETFs have seen record inflows, bringing institutional investors into the market at scale.
- Tariffs and inflation risk: U.S. trade policy is keeping inflation concerns elevated, reinforcing gold’s role as an inflation hedge.
- Dollar uncertainty: Concerns about the long-term trajectory of the U.S. dollar are prompting a global reallocation into hard assets.
- Fed easing expectations: Even with the current pause, the longer-term trajectory of U.S. monetary policy is expected to remain accommodative, supporting gold.
Gold Mining Stocks: Leveraged Exposure to the Rally
For investors looking beyond physical gold, gold mining stocks offer leveraged exposure to the gold price rally in March 2026. Gold mining stocks have historically outperformed gold bullion during war rallies by 1.5–2x due to operating leverage, with TSX-listed producers like Barrick Gold (TSX: ABX) and Agnico Eagle Mines (TSX: AEM) having all-in sustaining costs (AISC) well below current spot prices, providing significant leverage.
Higher gold prices translate directly into expanded margins for producers, making this an environment that rewards careful selection of quality gold mining names with low costs, strong balance sheets, and operations in stable jurisdictions.
Economic Data to Watch This Week (March 5–7, 2026)
Several upcoming releases could move the gold spot price per ounce in the coming days:
- Today (March 5): U.S. Initial Jobless Claims — a key labor market read that could shift Fed rate cut expectations.
- March 6: U.S. Unemployment Data — Friday’s non-farm payrolls report will be closely watched by gold traders.
- March 11: U.S. Consumer Price Index (CPI) for February — a critical inflation print.
- March 18: U.S. Producer Price Index (PPI) + Federal Reserve Interest Rate Decision — the most important scheduled event for gold markets this month.
Any surprise in these data points — particularly a softer-than-expected jobs or inflation print — could accelerate Fed rate cut expectations and provide fresh upside fuel for the current gold price in March 2026.
Conclusion: Gold Price Outlook for March 2026
The gold price today on March 5, 2026 reflects a market pausing for breath after a dramatic geopolitical-driven surge, but the underlying bull case remains firmly intact. The U.S.-Iran conflict continues to provide a powerful safe-haven bid, central banks are maintaining elevated purchasing activity, and inflation and tariff concerns keep the structural demand story alive.
With support firmly established above $5,000 and major institutions targeting $6,000–$6,300 by year-end, the gold price rally of March 2026 looks more like a consolidation before the next leg higher than a meaningful trend reversal. Traders and investors alike should keep a close eye on today’s jobless claims data, Friday’s employment report, and any developments on the Iran conflict for the next directional signal.