


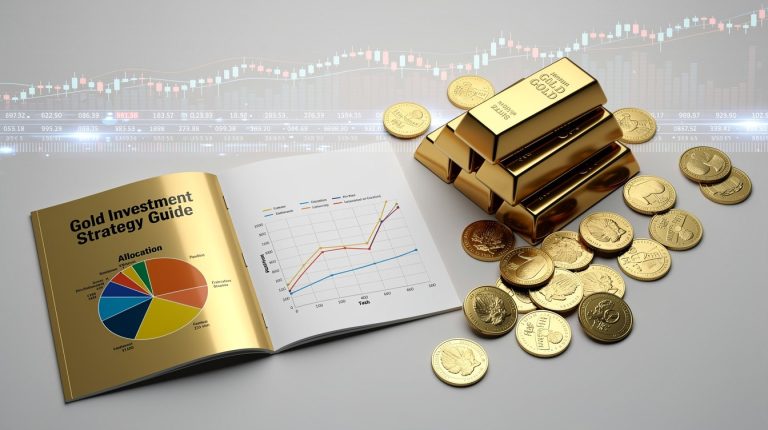
Gold has become a serious asset for investors looking to protect wealth against inflation and market volatility. At Natural Resource Stocks, we’ve seen firsthand how a structured gold investment strategy can stabilize portfolios during uncertain times.
This guide walks you through the practical steps of building a gold allocation that fits your financial goals, from choosing between physical gold and ETFs to understanding the tax implications of each approach.
Why Gold Protects Your Wealth When It Matters Most
Gold has delivered measurable protection during every major market crisis of the past two decades. From 2008 to 2009, when the S&P 500 fell 57%, gold rose approximately 5.5%, providing real cushion when stocks collapsed. During the Covid crash in March 2020, gold spiked to $2,064 per ounce as investors fled risk assets. More recently, gold reached an all-time high of $5,344.30 per ounce in January 2026, driven by geopolitical tensions and persistent inflation concerns.
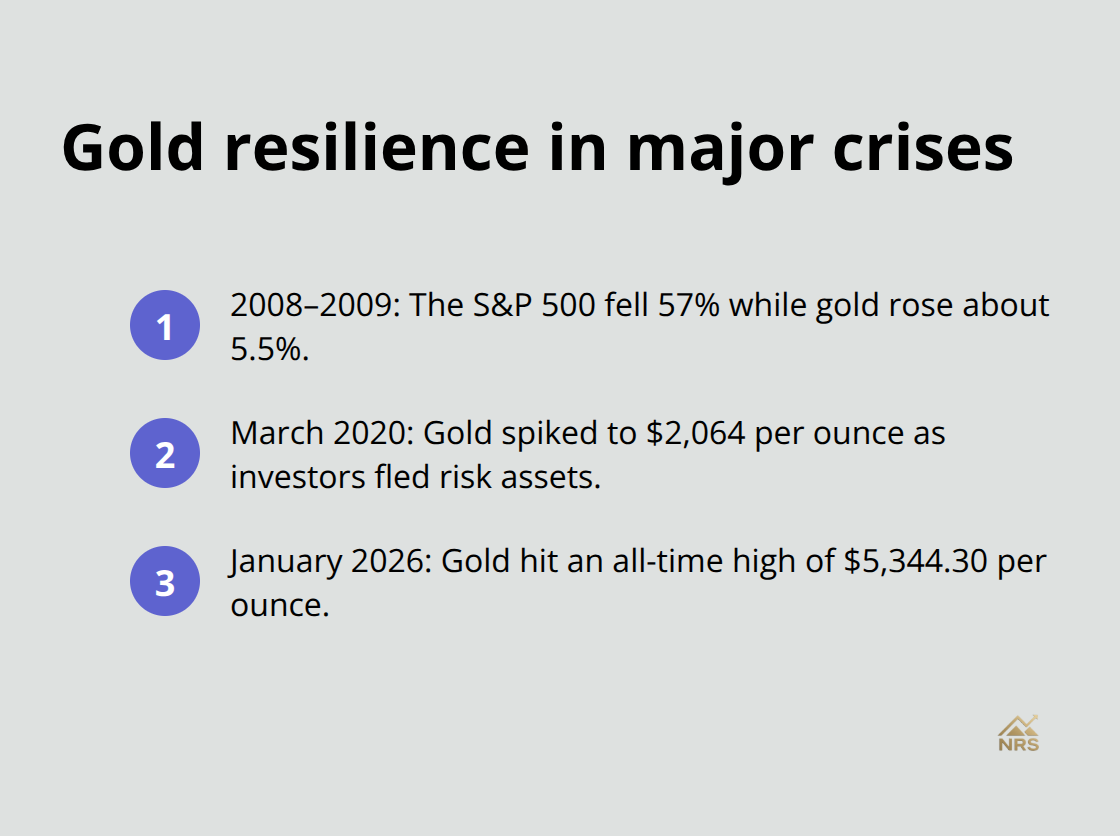
These aren’t theoretical scenarios-they’re concrete data points showing gold’s behavior when uncertainty strikes.
Gold Performs When Paper Assets Falter
Gold doesn’t depend on corporate earnings, interest payments, or economic growth. It holds value based on its scarcity and universal acceptance, which means it performs precisely when paper assets falter. From 2000 through the mid-2020s, gold delivered higher cumulative gains than the S&P 500, a period that included two recessions and multiple geopolitical shocks. This isn’t luck. Gold tends to perform better when real interest rates fall, which happens during recessions, rate cuts, or inflation surprises. Central banks have recognized this reality, with emerging market central banks dramatically increasing gold holdings to diversify away from USD exposure, creating structural demand that supports prices.
Inflation Erodes Purchasing Power, Gold Preserves It
Inflation averaged 4.7% annually from 2021 to 2024, and gold outpaced this by a significant margin. Over the past decade, adding 4% to 15% of gold to average portfolios would have increased risk-adjusted returns, depending on portfolio composition, according to World Gold Council analysis. Stocks require earnings growth to offset inflation, while bonds suffer when rates rise. Gold’s purchasing power remains intact during inflationary periods. Gold’s inverse relationship with the U.S. dollar amplifies this effect-when the dollar weakens due to inflation concerns, gold prices typically rise, providing natural inflation protection.
Real Yields Drive Gold Demand, Not Sentiment
The relationship between gold and interest rates shifted in the mid-2020s. Gold now often rises when real yields fall, particularly during periods of sovereign stress or policy uncertainty. This explains why gold surged 26% in 2024 and approximately 66% in 2025, despite higher nominal rates-real yields remained compressed due to persistent inflation. Investors should monitor the 10-year Treasury yield minus inflation expectations as a practical indicator for gold’s directional bias. When this spread turns negative, gold typically strengthens.
Portfolio Diversification Requires Assets That Behave Differently
True diversification means holding assets with low correlation to stocks and bonds. Gold’s correlation with long-term yields has fundamentally changed, and it now provides orthogonal diversification rather than traditional hedging. Adding gold to a 60/40 portfolio reduces overall variance without proportionally sacrificing returns, particularly when gold comprises 4% to 15% of total allocation. The 60/20/20 framework gaining institutional adoption reflects this shift: 60% equities, 20% fixed income, 20% real assets including gold. This structure outperformed traditional 60/40 allocations throughout 2024 and 2025 through maintaining growth exposure while dampening volatility through real asset inclusion.
Now that you understand why gold protects wealth, the next step involves determining how much gold fits your specific financial situation and which investment vehicle aligns with your goals.
How Much Gold Should You Actually Own
Calculate Your Ideal Allocation Based on Your Situation
The ideal gold allocation depends on your risk tolerance, time horizon, and existing portfolio composition, not on arbitrary percentages you read online. World Gold Council research shows that adding 4% to 15% of gold to average portfolios increased risk-adjusted returns, but this range masks a critical truth: your specific number matters more than hitting a benchmark. Start by calculating your current equity and bond exposure, then work backward. If you hold a traditional 60/40 portfolio, a 5% gold allocation means reducing either stocks or bonds by that amount. The 60/20/20 framework gaining traction among institutional investors allocates 60% to equities, 20% to fixed income, and 20% to real assets including gold. Within that real asset sleeve, gold typically comprises 40% to 60% of the allocation, translating to 8% to 12% of total portfolio value.
Conservative investors with shorter time horizons should target the lower end of the 4% to 15% range, while aggressive long-term investors can justify higher allocations. The practical approach involves stress-testing your portfolio: run a hypothetical market decline scenario and observe whether gold’s behavior during past crises would have meaningfully reduced your losses. If a 10% portfolio decline would cause you significant financial stress, you need more gold. If you can weather a 20% drawdown without panic, your allocation can skew lower.
Physical Gold, ETFs, and Mining Stocks Each Carry Different Costs
Your choice between physical gold, ETFs, and mining stocks determines both your costs and your actual returns. Physical gold through bars or coins carries premiums above spot price ranging from 3% to 8%, plus storage and insurance costs that typically run 0.5% to 1% annually. This makes physical gold expensive for most investors unless you accumulate substantial quantities where per-unit premiums decline. Gold ETFs like GLD charge expense ratios around 0.4% annually and offer immediate liquidity without storage headaches, making them ideal for core allocations.
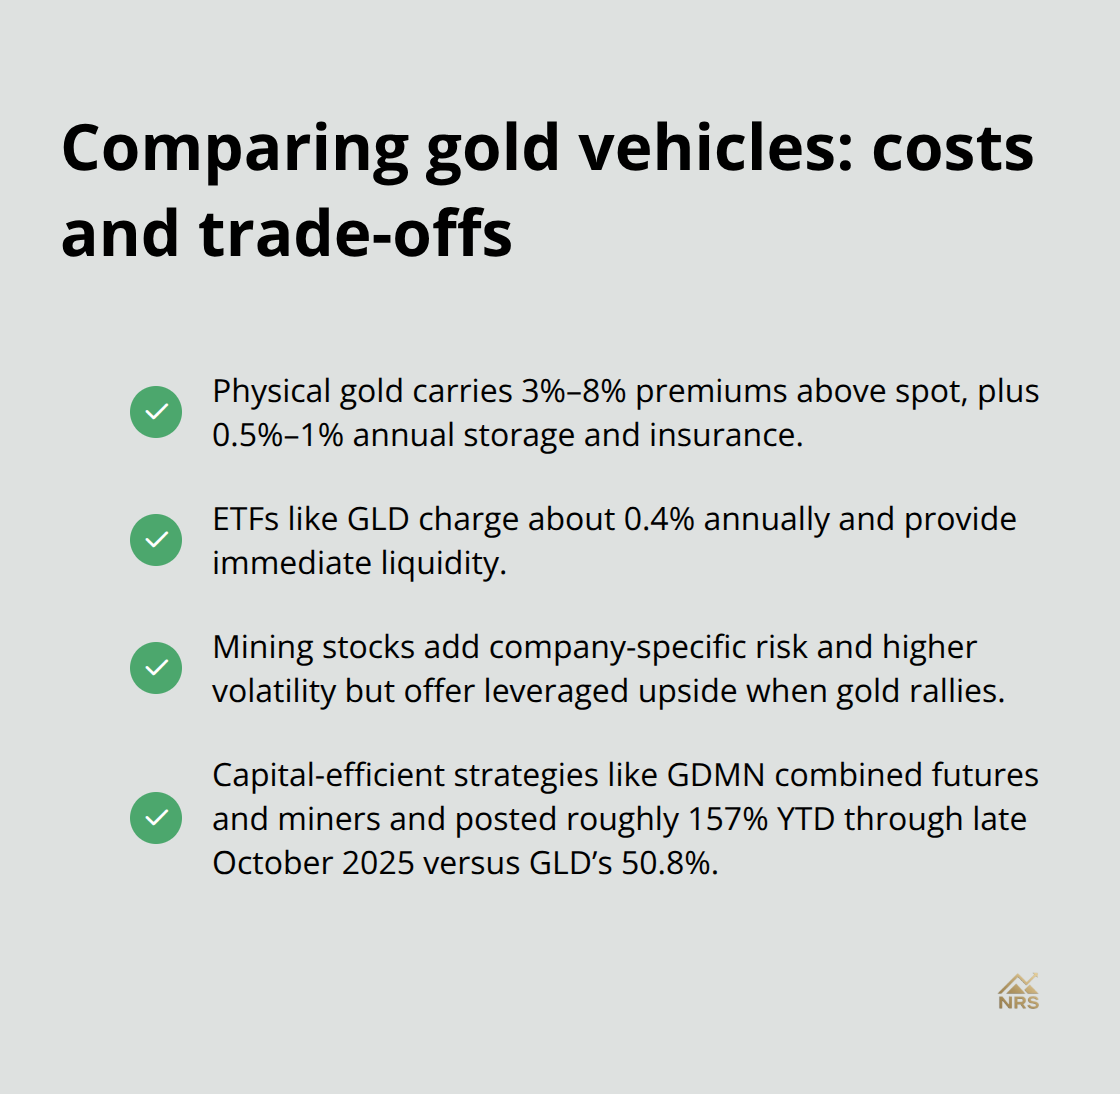
Mining stocks and funds like GDX introduce company-specific risk and higher volatility than physical gold but offer leveraged upside when gold prices surge and mining productivity improves. If you want capital-efficient exposure that amplifies returns during strong gold markets, GDMN combines gold futures with gold-mining equities in a 90/90 structure, delivering roughly $180 notional exposure per $100 invested, and posted approximately 157% year-to-date returns through late October 2025 compared to GLD’s 50.8%.
Tax Treatment Varies Significantly Across Investment Methods
Tax treatment varies significantly: physical gold held longer than one year qualifies for long-term capital gains treatment in most jurisdictions, while gold ETFs structured as grantor trusts are taxed as collectibles at a 28% federal rate regardless of holding period. Mining company stocks receive standard capital gains treatment, making them tax-efficient for long-term holdings. This distinction matters substantially when you calculate your after-tax returns across different time horizons.
Combine Multiple Approaches for Optimal Results
The practical recommendation involves combining multiple approaches within your allocation: use ETFs for 70% to 80% of your gold exposure to maintain liquidity and minimize costs, consider vaulted gold through professional storage providers for 15% to 25% if you want ownership certainty without personal storage burden, and allocate the remainder to mining stocks only if you actively monitor company fundamentals and can tolerate volatility. This layered approach balances cost efficiency, tax efficiency, and portfolio behavior during different market regimes. Your allocation structure now sits in place, but market conditions shift constantly, and understanding what drives gold prices helps you adjust your strategy when geopolitical or economic conditions change.
What’s Actually Moving Gold Prices Right Now
Geopolitical Tension Replaces Sentiment as the Primary Driver
Geopolitical tension has replaced sentiment as the primary driver of gold prices, and understanding this shift fundamentally changes how you should monitor your allocation. Gold spiked to approximately $2,064 per ounce in August 2020 during the Covid crisis, but the 2024–2026 surge tells a different story entirely. Gold climbed from around $2,300 per ounce in early 2024 to an all-time high of $5,344.30 in January 2026, with this rally driven primarily by geopolitical risks, policy uncertainty, and sovereign stress rather than traditional inflation metrics. The practical implication is clear: your gold allocation benefits most when geopolitical tensions escalate, not when consumer price indices rise. Track headlines around trade wars, sanctions, military conflicts, and political instability in major economies as leading indicators for gold appreciation.
Central Bank Purchases Create Structural Demand
Central banks have recognized this reality and shifted their behavior accordingly. Emerging market central banks increased gold holdings substantially to diversify away from USD exposure, creating structural demand that supports prices regardless of short-term economic cycles. This central bank buying provides a floor under gold prices that did not exist during previous decades, fundamentally changing the risk-reward profile for gold holders. When central banks accumulate gold, they essentially bet that geopolitical fragmentation will persist, and this institutional-level conviction matters more than retail sentiment swings.
Real Yields, Not Nominal Rates, Determine Gold’s Attractiveness
Macroeconomic conditions matter, but not in the ways most investors assume. Real interest rates determine gold’s attractiveness, and this distinction separates sophisticated investors from those chasing performance. Gold reached $5,344.30 in January 2026 despite higher nominal rates because real yields remained compressed due to persistent inflation expectations and policy uncertainty. The practical metric to monitor is the 10-year Treasury yield minus inflation expectations, not the headline rate itself. When this spread turns negative or compresses below 1%, gold typically strengthens sharply because investors earn negative real returns holding bonds.
Dollar Weakness and Synchronized Asset Rallies
A weaker U.S. dollar supports gold prices, and this relationship has historically remained reliable across multiple market cycles. Watch the US Dollar Index as a secondary indicator alongside real yields. The 2025 performance data illustrates this clearly: gold delivered approximately 66% returns while the S&P 500 returned 16.4% through early November, demonstrating that gold and equities can move together during periods of synchronized geopolitical concern and falling real yields. This orthogonal behavior works precisely during the periods when you need it most-when both growth assets and safe-haven assets rally together in response to policy uncertainty rather than economic strength.
Track Three Key Metrics Monthly
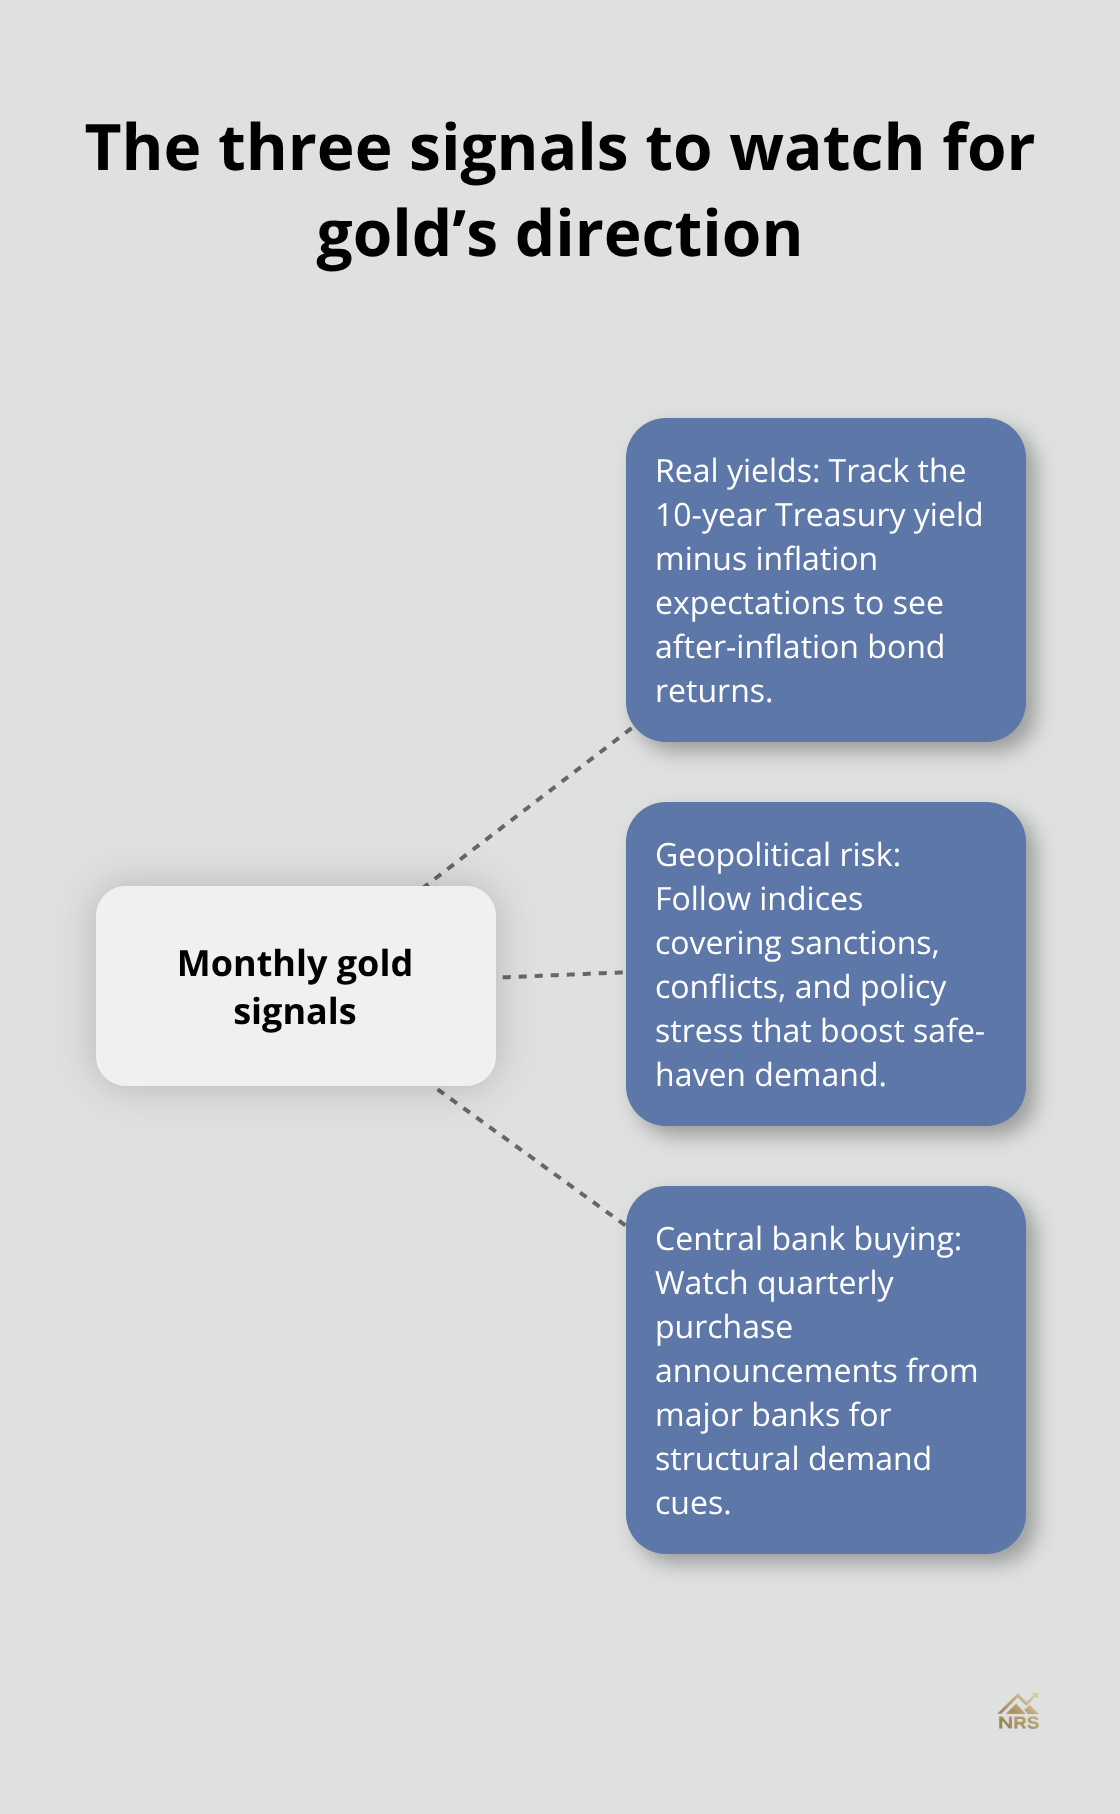
Monitor these three metrics monthly to stay informed about gold’s directional bias. Real yields via the Treasury Inflation-Protected Securities market reveal whether bond investors earn positive returns after inflation. Geopolitical risk indices from sources tracking sanctions and military tensions indicate when safe-haven demand will likely intensify. Central bank gold purchase announcements, which typically occur quarterly through official statements from major central banks including the Federal Reserve and European Central Bank, signal institutional conviction about future fragmentation and policy uncertainty.
Final Thoughts
Building a gold investment strategy guide requires translating market knowledge into concrete action. The evidence proves clear: gold protects purchasing power during inflation, performs when real yields compress, and provides portfolio stability during geopolitical stress. From 2000 through the mid-2020s, gold outperformed the S&P 500, and this outperformance accelerated dramatically in 2024 and 2025 as geopolitical tensions intensified and central banks accumulated holdings. Your allocation should reflect your specific risk tolerance and time horizon, not arbitrary benchmarks.
Implementation begins with choosing your vehicle based on your liquidity needs and cost tolerance. ETFs like GLD offer cost efficiency at 0.4% annually and immediate liquidity, making them ideal for core allocations, while capital-efficient strategies like GDMN delivered approximately 157% year-to-date returns through late October 2025 by combining gold futures with mining equities. Physical gold through vaulted storage providers offers ownership certainty without personal storage burden, though premiums and insurance costs reduce returns. Mining stocks introduce volatility but provide upside leverage when gold prices surge and company fundamentals improve.
Monitor three metrics monthly to stay informed about gold’s directional bias: real yields via Treasury Inflation-Protected Securities, geopolitical risk indices that indicate when safe-haven demand will intensify, and central bank gold purchase announcements that signal institutional conviction about future policy uncertainty. At Natural Resource Stocks, we provide expert analysis on how macroeconomic factors and geopolitical developments affect resource prices, including gold, and our platform offers video content and market analysis to help you refine your allocation as conditions shift.