


Uranium prices swing wildly, and most investors don’t understand why. Geopolitical tensions, mining disruptions, and macroeconomic shifts all play a role in uranium price volatility.
At Natural Resource Stocks, we’ve identified the key forces driving these swings. This guide breaks down exactly what moves the market and how you can position yourself accordingly.
How Geopolitical Shocks and Policy Shifts Drive Uranium Prices
Russia’s Export Ban Exposed Enrichment Bottlenecks
Russia’s ban on enriched uranium exports to the US in November 2024 sent uranium prices spiking from around $76.60 to $81.90 per pound. That single policy move demonstrated how quickly geopolitical friction reshapes uranium markets. Russia controls roughly 44% of global enrichment capacity and 35% of US enrichment imports, yet accounts for only 5% of global uranium supply. This asymmetry means that supply-chain disruptions in enrichment hit harder than disruptions in raw uranium mining. When Russia tightened export rules, US utilities faced immediate pressure to source enriched fuel elsewhere, driving spot prices upward within days. Traders who monitor enrichment capacity data from Rosatom, Urenco, and Orano-not just mining output-catch these swings early. The lesson is blunt: geopolitical risk in uranium doesn’t always correlate with physical supply scarcity. Instead, it creates bottlenecks in the fuel cycle that force buyers into panic purchases.
Government Incentives Now Drive Structural Demand
Government support for nuclear expansion has become the primary driver of structural uranium demand. COP29 commitments brought six additional countries into pledges to triple global nuclear capacity by 2050, bringing total pledges to 31 nations. The US government loosened rules for uranium converters and enrichers and announced new-build deals worth approximately $2.7 billion for Centrus and related contracts. Meta plans up to 7.8 gigawatts of nuclear capacity deployment, while Microsoft renews reactors specifically to power AI data centers. These aren’t theoretical targets-they represent signed contracts and government funding allocations. Long-term uranium contract prices reached approximately $90 per pound by the end of Q1 2026, the highest level since 2008, according to Investing News Network. This price floor reflects confidence that policy support will sustain demand for years ahead. Investors should track government nuclear funding announcements and corporate power-purchase agreements rather than waiting for prices to react.
Concentrated Production Creates Vulnerability
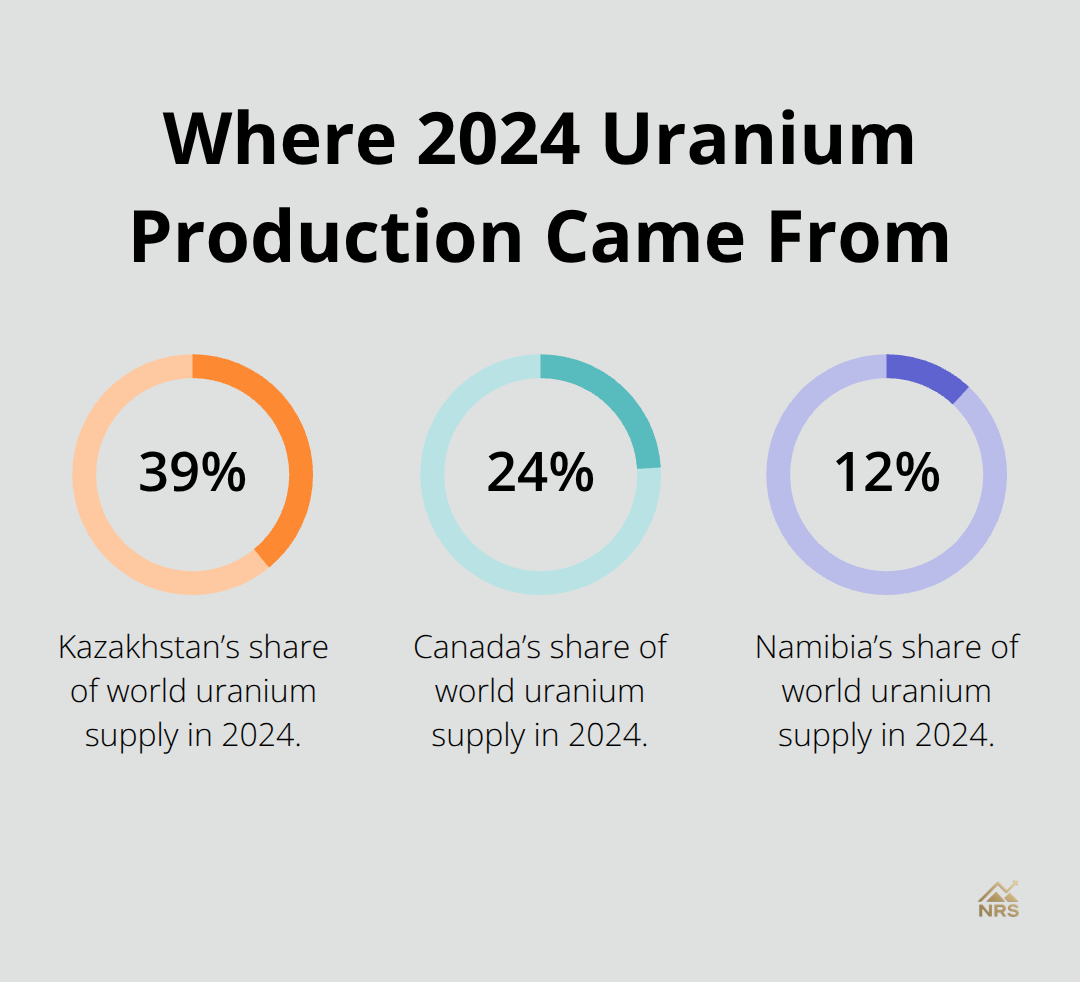
In 2024, Kazakhstan produced 39% of world uranium supply, followed by Canada (24%) and Namibia (12%). When Niger’s coup disrupted Orano’s mining operations in 2024, the company lost control of SOMAÏR and saw approximately 1,150 tonnes of uranium stock worth roughly $210 million stuck in inventory without export permission. That single geopolitical event removed a meaningful portion of global supply from circulation.
Analysts project uranium supply deficits lasting into the 2030s due to lengthy development timelines for new mines. NexGen Energy’s Rook I project in Saskatchewan represents critical future supply, with resources of 337 million pounds and potential production of up to 28.8 million pounds annually by 2030–2031. The company already signed first US utility contracts for 5 million pounds with price floors around $79 per pound and ceilings near $150 per pound. This contract structure signals how tightly supply is expected to remain. Disruptions in any of the three major producing countries can swing prices sharply because replacement supply takes years to develop. These supply constraints set the stage for understanding how demand pressures amplify price volatility across the entire market.
Supply and Demand Dynamics in the Uranium Market
Three Countries Control Nearly 70% of Global Output
Uranium production capacity in 2024 concentrated heavily in three countries: Kazakhstan controlled 43% of global output, Canada contributed 15%, and Namibia supplied 11%, according to the World Nuclear Association. This extreme concentration means that even modest disruptions ripple through global markets within weeks. Kazakhstan’s Kazatomprom has already committed to large sales to Chinese buyers totaling over 50% of its book value, signaling that eastern supply dominance will intensify.
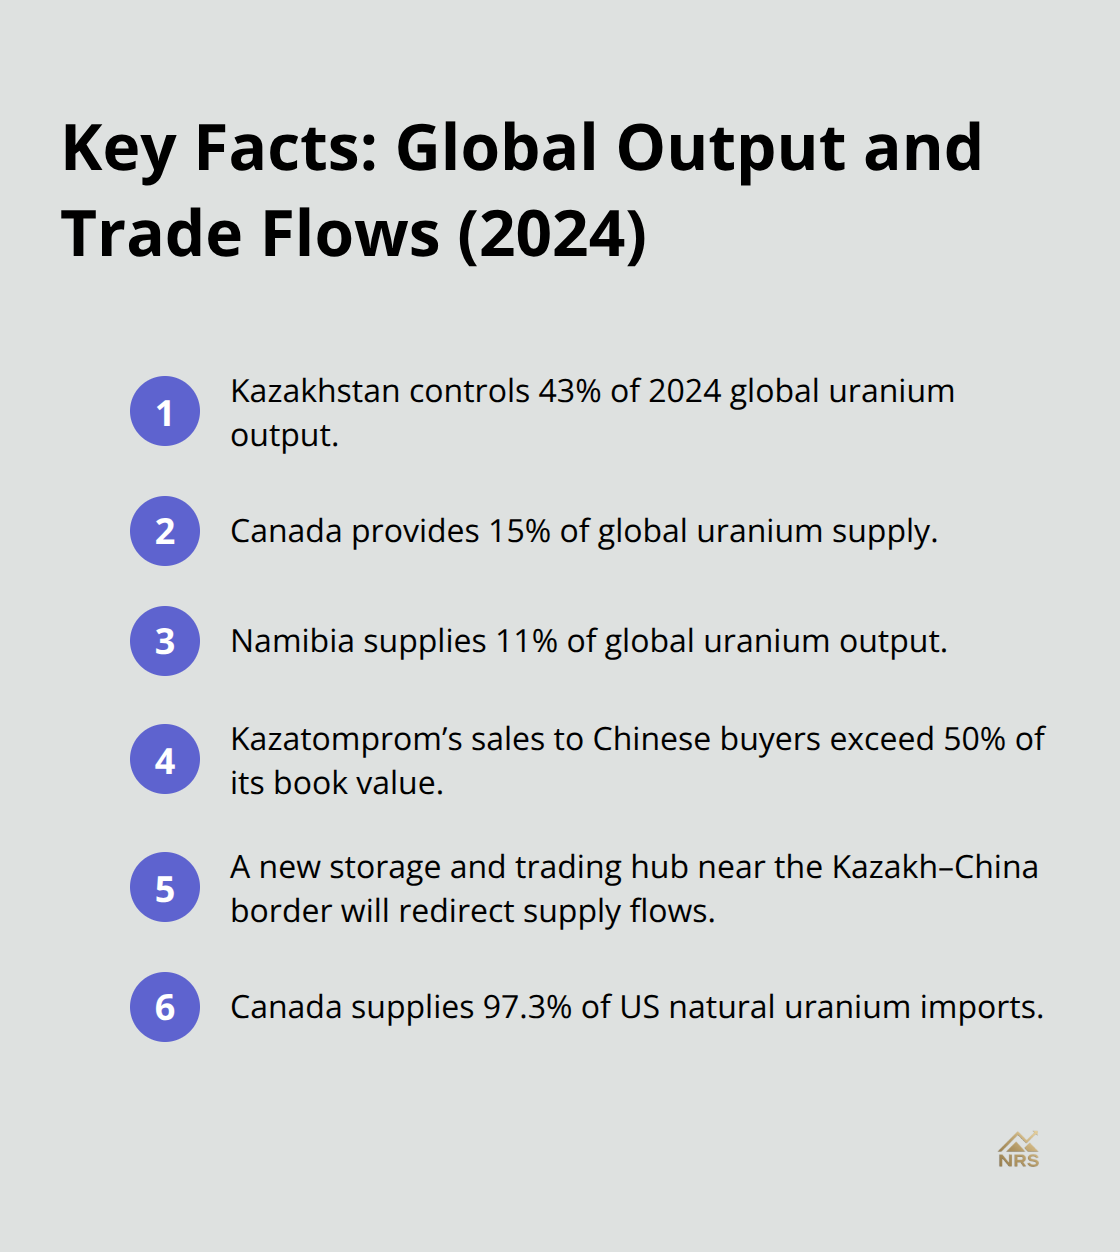
A new storage and trading hub near the Kazakh-China border will further redirect supply flows away from Western markets. Canada remains the single largest source of US natural uranium imports at 97.3% of total imports, making North American supply chains critical for US utilities.
Policy Alignment Determines North American Expansion
Canada’s expansion potential depends on policy alignment with the US, particularly around enrichment capacity treaties. If easing treaties allow Canadian enrichment capacity to grow, it could diversify US supply away from Russian and European sources. NexGen Energy’s Rook I project in Saskatchewan exemplifies the production timeline challenge: despite final federal technical review completion and an upcoming Commission Hearing that could lead to project approval, the mine won’t deliver meaningful volumes until 2030–2031. This multi-year lag between approval and production means current supply tightness will persist regardless of new projects approved today.
Deficits Persist Through the Mid-2020s
With over 12 GW of new nuclear construction starts in 2025 alone, according to the IEA, demand growth from nuclear expansion outpaces supply development. Deficits of this magnitude spanning multiple years create sustained upward pressure on prices and force utilities to lock in long-term contracts at elevated rates.
Spot Prices Lag Contract Prices as Scarcity Expectations Build
Demand growth from nuclear expansion outpaces supply development, which explains why long-term contract prices reached $90 per pound by end of Q1 2026 while spot prices hovered around $86.25 per pound on May 6, 2026. The gap between spot and contract prices reflects genuine scarcity expectations extending years into the future. Meta’s commitment to 7.8 gigawatts of nuclear capacity and Microsoft’s reactor renewals for AI data center power represent concrete demand commitments backed by corporate capital allocation, not speculative bids. These tech-sector deals signal that uranium demand will remain structurally elevated regardless of near-term economic slowdowns.
Inventory Movements Amplify Price Swings
Inventory dynamics add another layer of complexity: Orano’s stranded 1,150 tonnes of uranium in Niger illustrates how geopolitical disruption can lock supply out of circulation despite physical availability. Strategic uranium reserves held by governments and utilities tend to increase during price spikes and decrease during price declines, creating a countercyclical pressure that amplifies volatility. When prices surge, buyers draw down inventory to avoid purchasing at peak rates, which temporarily eases spot price pressure. When prices fall, utilities rebuild reserves, which absorbs supply and supports prices. Tracking inventory movements across major utility companies provides an early signal of demand intensity that spot prices alone won’t reveal. The fundamental imbalance is straightforward: supply deficits extending into the 2030s combined with concentrated production in three countries and multi-year development timelines mean that uranium prices have structural support from supply constraints, not temporary sentiment swings. Macroeconomic forces now amplify these supply-demand pressures, creating additional volatility layers that investors must monitor to anticipate price moves.
How Macro Forces Amplify Uranium Price Swings
Equity Markets and Oil Prices Drive Uranium Volatility
Since 2010, uranium returns have shown strong sensitivity to global equity markets and oil price movements. Since 2022, geopolitical risk has intensified this relationship dramatically, meaning uranium no longer trades in isolation. When stock markets decline sharply or oil prices collapse, uranium typically follows within days because institutional investors reduce exposure across all commodities simultaneously.
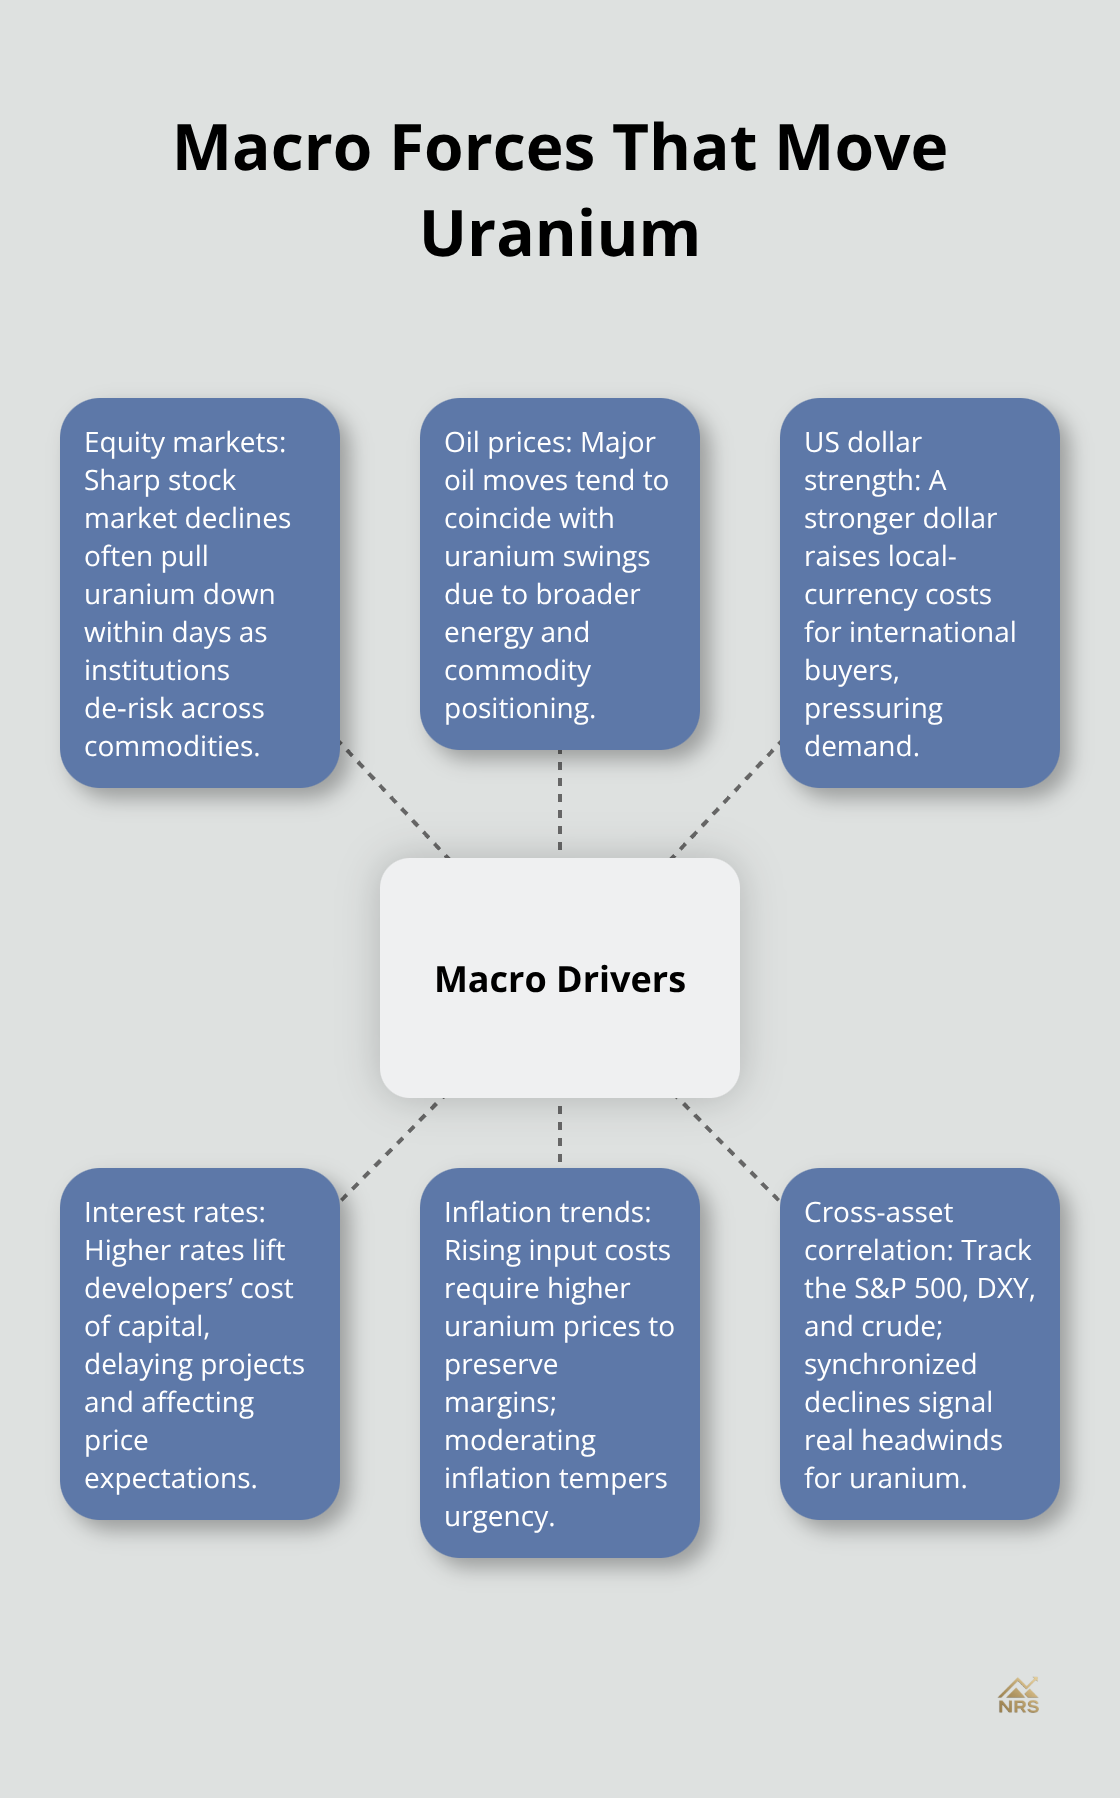
The S&P 500, crude oil prices, and uranium move together far more often than supply-demand fundamentals alone would suggest. This correlation means that a supply deficit cannot support prices if macro sentiment turns negative across the board.
Dollar Strength Creates Hidden Price Pressure
The US dollar strength matters equally to supply dynamics: uranium trades in dollars globally, so when the dollar appreciates against other currencies, international buyers face higher purchasing costs in their local money. From November 2024 through May 2026, the dollar’s relative strength fluctuated between periods of weakness and recovery, and these shifts coincided with uranium price swings that had nothing to do with supply or demand changes. Traders monitoring only uranium supply data miss half the price story. Track the US dollar index, major stock indices like the S&P 500, and crude oil prices alongside uranium-specific metrics. When all three move downward together, uranium faces genuine selling pressure that supply tightness alone cannot offset. When macro sentiment improves and equities rally, uranium benefits from renewed risk appetite independent of any new uranium supply news.
Interest Rates and Inflation Shape Mining Economics
Interest rates create a different pressure: higher rates increase the cost of capital for mining companies developing new uranium projects, which delays production timelines further and reduces the incentive for mine restarts. Rising inflation simultaneously erodes mining margins unless uranium prices rise faster than input costs. From late 2024 through mid-2026, inflation moderated from previous peaks, which reduced urgency for utilities to lock in long-term contracts at extreme prices. This explains why long-term contract prices stabilized around $90 per pound rather than accelerating higher despite persistent supply deficits. Inflation expectations shape uranium demand as much as actual inflation does: when investors expect deflation or disinflation ahead, they reduce commodity exposure broadly, including uranium.
Macro Conditions Determine Price Sustainability
Uranium prices cannot rise sustainably without supporting macro conditions. A supply deficit alone does not guarantee higher prices if equity markets crash, the dollar strengthens sharply, or interest rates spike unexpectedly. Monitor the correlation between uranium and the S&P 500, the US dollar index, and crude oil prices on a monthly basis. When uranium decouples upward from these macro anchors, that signals genuine supply-driven strength worth acting on. When uranium falls while equities rally, the weakness reflects macro headwinds, not supply concerns, and represents a potential buying opportunity if supply fundamentals remain tight.
Final Thoughts
Uranium price volatility stems from three interconnected forces that investors must track simultaneously. Geopolitical disruptions constrain enrichment capacity, supply deficits extending into the 2030s pair with concentrated production in three countries, and macroeconomic conditions amplify or suppress price movements independent of supply fundamentals. Russia’s export ban demonstrated how quickly policy shifts reshape markets, while Kazakhstan’s redirected sales toward Chinese buyers signal structural supply realignment.
Investors navigating uranium prices must monitor enrichment capacity data from Rosatom, Urenco, and Orano alongside mining production figures, since bottlenecks in the fuel cycle matter as much as raw uranium supply. Long-term contract prices at $90 per pound reflect genuine scarcity expectations, while spot prices around $86 per pound show that macro headwinds still constrain upside despite supply tightness. Track the S&P 500, US dollar index, and crude oil prices monthly, because uranium cannot sustain price gains without supporting macro conditions.
Supply deficits persist through the 2030s while production timelines stretch across multiple years, which means uranium will continue swinging sharply through this decade. Government nuclear commitments from 31 nations and corporate power deals from Meta and Microsoft create structural demand that won’t disappear during economic slowdowns. We at Natural Resource Stocks track these supply-demand dynamics alongside macro factors to help investors position ahead of price moves.